

 Novel analysis of locality data can inform better inventory and monitoring practices for paleontological resources at John Day Fossil Beds National Monument, Oregon, USA
Article number: 23(1):a17
https://doi.org/10.26879/1053
Copyright Paleontological Society, April 2020
Author biographies
Plain-language and multi-lingual abstracts
PDF version
Submission: 12 December 2019. Acceptance: 30 March 2020.
ABSTRACT
We evaluated the current inventory and monitoring practices at John Day Fossil Beds National Monument (JODA) with an analysis of fossil yield based on locality data. While JODA covers a range of fossiliferous Cenozoic rock, most paleontological fieldwork conducted by the park staff occurs in the highly fossiliferous Oligocene Turtle Cove Member of the John Day Formation. To optimize the number of fossils collected, JODA established a schedule that cycled fieldwork every four years between the five most fossiliferous areas of the park. We digitized over 1000 field collections from 1999-2019 to evaluate whether the four-year return interval allowed enough time for new fossils to be exposed through erosion in an area between visits as intended by the schedule. We found no significant difference in fossil yield between areas that had not been visited for 1, 2, 3, 4, or 5+ years. Based on these results, we infer that the claystones of the Turtle Cove Member are erodible and fossiliferous enough that one winter of erosion will expose enough fossils to fully “recharge” an area that had been thoroughly inventoried the previous year. Because of limited staff and high fossil yield, not every fossil will be collected. Therefore, we use this analysis to shift JODA’s paleontological inventory and monitoring practices away from a rigid schedule and propose a flexible new system. The paleontology staff will use a tracker geodatabase of locality data from past years to set priorities each year based on past collection and current available staff and space.
Anne E. Kort. Department of Earth and Atmospheric Sciences, Indiana University, 1001 East 10th Street, Bloomington, Indiana 47408, USA, aekort@iu.edu
Nicholas A. Famoso. John Day Fossil Beds National Monument, U.S. National Park Service, 32651 Highway 19, Kimberly, Oregon 97848, USA, nicholas_famoso@nps.gov; ORCID: 0000-0002-1795-624X
Keywords: GIS; inventory and monitoring; locality data; National Park Service; John Day
Kort, Anne E. and Famoso, Nicholas A. 2020. Novel analysis of locality data can inform better inventory and monitoring practices for paleontological resources at John Day Fossil Beds National Monument, Oregon, USA. Palaeontologia Electronica, 23(1):a17. https://doi.org/10.26879/1053
palaeo-electronica.org/content/2020/2996-gis-at-john-day-fossil-beds
Copyright: April 2020 Paleontological Society.
This is an open access article distributed under the terms of Attribution-NonCommercial-ShareAlike 4.0 International (CC BY-NC-SA 4.0), which permits users to copy and redistribute the material in any medium or format, provided it is not used for commercial purposes and the original author and source are credited, with indications if any changes are made.
creativecommons.org/licenses/by-nc-sa/4.0/
INTRODUCTION
Locality data forms an integral basis for paleontological research by contextualizing a fossil’s environment, age, and community and allowing researchers to revisit important sites. With the advent of Geographic Information Systems (GIS) and the ever-increasing precision of the Global Positioning System (GPS), geospatial analysis of locality data can be used to inform collection practices beyond simply relocating old sites. Several studies have used spatial data for known fossil sites in combination with other data like topography or geologic unit to locate unexplored areas with high fossil yield potential (Oheim, 2007; Chew and Oheim, 2009; Malakhov et al., 2009; Anemone et al., 2011). However, locality data and GIS can also be used to evaluate year to year collection practices within a well-studied area. The John Day basin in central and eastern Oregon presents an excellent case study for analysis of long-term collection. Some of the most complete data can be found in lands managed by the John Day Fossil Beds National Monument (JODA) under the National Park Service (NPS) and the United States Department of Interior as it has a long record of precise locality data across a large area of coverage stretching back to the mid-1980s.
 The John Day basin contains an extensive fossil record across central and eastern Oregon (Condon, 1910; Fremd, 2010; Graham, 2014). The major fossiliferous formations in this area span from the early Eocene through to late Miocene, representing one of the longest, most continuous fossil records in the world (Albright et al., 2008, Liggett et al., 2018) (Figure 1). The most extensive of these formations, the John Day Formation (~39.7-18 Ma), historically has played a pivotal role in understanding North American Oligocene ecosystems (Condon, 1910; Cope, 1885; Fremd, 2010; Graham, 2014). Major finds have included nimravids, early canids, early equids, oreodonts, numerous rodents, and the last known primate in North America (Cope, 1885; Korth and Samuels, 2015; Samuels et al., 2015; Famoso, 2017). As the national significance of the John Day Formation and the John Day basin was recognized, the State of Oregon designated three areas of the region as state parks in the 1930s (Liggett et al., 2018). In 1974, the U.S. Congress authorized JODA, based on those original three state parks, to add stricter protections to these significant paleontological resources (Liggett et al., 2018).
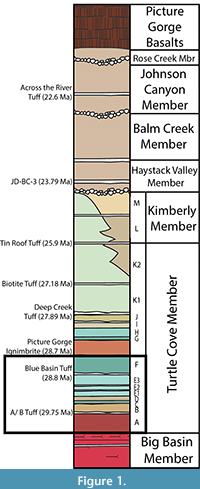
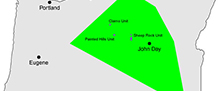
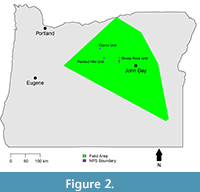
The U.S. Congress established JODA in 1975 with a mission to preserve and provide for the scientific and public understanding of the fossil resources found in the John Day basin (Enabling Legislation of 1974, Public Law 93-486). To fulfill this mission, JODA staff have conducted systematic paleontological fieldwork within the monument and maintained a museum collection of fossils since the creation of the monument (Liggett et al., 2018). Furthermore, while JODA itself covers only 57 square kilometers split into three separate units (Sheep Rock, Clarno, and Painted Hills), the paleontology staff at JODA regularly collect from sites on non-NPS-administered land through partnerships with the Bureau of Land Management (BLM), U.S. Forest Service (USFS), and other federal, state, tribal, non-profit, and private landowners (Figure 2). Through fieldwork in and outside of the monument, JODA has become a major repository for fossils from central and eastern Oregon (Liggett et al., 2018).
 The establishment of JODA shifted collection in the John Day basin from sporadic expeditions by universities to consistent, systematic fieldwork by dedicated park staff. However, available staffing at the park has been a limiting factor on field collection, with the size of the paleontology division fluctuating from a dozen to as few as one over the years, and even seasonally. Because of the large scope of collections, paleontologists at JODA have had to allocate resources carefully when choosing which paleontological sites to closely monitor and collect. Before the implementation of the Inventory and Monitoring Program in the NPS, JODA paleontologists focused on collecting from the most productive areas on NPS-administered lands (Fremd, T., Memo to Superintendent, John Day Fossil Beds National Monument, February 17, 1986). The cyclic prospecting schedule implemented in 1986 focused fieldwork on prospecting, searching a designated area for exposed paleontological resources with a distinction made between fine and coarse prospecting. Fine prospecting involved thorough coverage of an area on hands and knees looking for smaller specimens, collecting everything identifiable to at least the taxonomic level of order for mammals and class for other organisms. Alternatively, coarse prospecting entailed a shorter walk around checking for more obvious, larger, well-exposed specimens (Fremd, 1995).
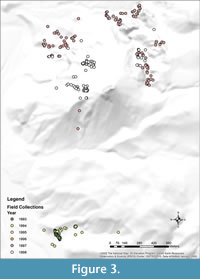 The cyclic prospecting schedule outlined a four-year rotation of fieldwork among each of the five most productive areas. (Fremd, 1995). The schedule split each of the five main areas into subareas. and designated when to visit each subarea for fine or coarse prospecting on the four-year rotation (Table 1). This system ostensibly allowed enough time for erosion and weathering to uncover more fossils without waiting so long that significant discoveries eroded away. However, little field data was available early on to confirm the validity of the four-year interval (Fremd, T., Memo to Superintendent, John Day Fossil Beds National Monument, February 17, 1986). Furthermore, a four-year return interval demands an ambitiously large field area be covered each year with the five areas covering approximately 0.2 - 0.5 square kilometers of exposed rock each. Preliminary observation of the data shows that field collection practices have almost never been consistent with the original cyclic prospecting schedule (Fremd, T., Memo to Superintendent, John Day Fossil Beds National Monument, February 17, 1986) (Figure 3). Because field days and field staff fluctuate from year to year and seasonally, JODA staff cannot consistently cover such a large area every field season. With over 30 years of field collection, we can evaluate, 1) the effectiveness of the four-year return interval for allowing fossils to “recharge”, and 2) best practices for monitoring large, productive field areas regularly.
Several factors potentially control the rate of fossil exposure, such as rock erodibility and abundance of fossils. Though these vary substantially between the formations exposed within the boundaries of JODA, most of JODA’s field collection occurs within the highly fossiliferous Turtle Cove Member of the John Day Formation (approximately 6,800 of 13,800 cataloged paleontological specimens). Four of the five areas covered by the cyclic prospecting schedule are exposures of the Turtle Cove Member. The Turtle Cove Member consists of a soft silty claystone that erodes into badlands type landscapes. It is interbedded with volcanic tufts that separate the member into subunits (14 layers, A-K2, in the type area), with a large ignimbrite dividing the upper and lower sections (Retallack et al., 2000; Hunt and Stepleton, 2004; Albright et al., 2008) (Figure 1). Most notably, it is highly fossiliferous across several of its subunits, chiefly E1, E2, E3, K1, and K2 (Famoso, 2016). Because most of the collection occurs within the Turtle Cove Member, we only evaluated the fossil “recharge” rate for this unit of JODA’s geology. We used field collection locality data from one of the five areas outlined in the cyclic prospecting schedule, which will herein be referred to as Test Area. Test Area is entirely exposures of the lower Turtle Cove Member (below the Picture Gorge ignimbrite). Precise locality information is available to qualified researchers upon request from JODA’s museum program. We used these results to create a new system for inventory and monitoring in line with current NPS practices, that evaluates priority areas on a year to year basis.
MATERIALS AND METHODS
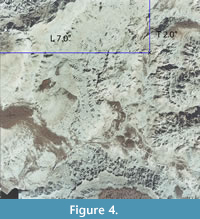 We used the long record of locality and field data at JODA to evaluate year to year fossil yield in the Turtle Cove Member of the John Day Formation, using Test Area as a case study. Early locality data at JODA was recorded in the form of analog measurements on aerial photographs in inches (Figure 4) or using coarser Township, Range, and Section. The aerial photograph coordinates were phased out as the park acquired GPS units, starting with the handheld Garmin units and later on the more precise Trimble differential GPS units. Even with this new technology, GPS coordinates were only recorded in handwritten field notes and not captured digitally until 2017. The park is now implementing a decoupled GPS system with Trimble R1 units connected to tablets via Bluetooth that allows direct transfer of coordinates from tablet to cloud service. Because both the aerial photograph coordinates and a majority of the GPS data associated with uncatalogued specimens required digitization of so-called “dark data” (Marshall et al., 2018), we chose to focus on a single area from the original five outlined by the cyclic prospecting schedule. First, we pulled previously digitized GPS data for cataloged museum specimens from the Interior Collections Management System (ICMS) database for JODA to visualize broad patterns in field collection since the establishment of the monument. We chose Test Area based on the large number and spread of collections across the entire basin.
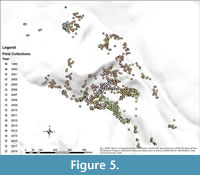 We compiled locality data for Test Area from 20 years of field notes (1999-2019). We digitized 1057 field collection localities in ArcMap 10.5 (ESRI, 2017) (Figure 5). We digitized field localities with GPS coordinates by importing a table of the field numbers and associated GPS coordinates and applying the Add XY Data tool. To digitize the aerial photograph coordinates, we scanned the original aerial photographs, imported the image into ArcMap, and georeferenced their location by matching 8-10 landmarks with the satellite imagery basemap. We then measured the inches from the top and from the left as recorded in the field notes on the physical copy of the aerial photograph (Figure 4). We located the same area on the digitized aerial photograph georeferenced in ArcMap and added a point to mark the location. For each digitized locality, we recorded only the field number and year of collection.
For the purposes of this study, we assumed the lower Turtle Cove is uniform in fossil distribution and that most collections came from fine prospecting as defined by the cyclic prospecting schedule. Though E1, E2, and E3 are the most abundant subunits of the lower Turtle Cove, these are the layers with the most area outcropping in Test Area and many of the other cyclic prospecting areas. Additionally, many fossils are found as float as erosional processes move fossils away from their parent layer. We know most of these collections came from fine prospecting where an area was thoroughly checked for fossils based on the narratives in the field notes. We did not factor in size of the specimens or the taphonomic state of specimens in the collection, as we only wanted to test number of fossils found. Though field collections can contain multiple fossils, these are often fragments of a larger specimen that can be reassembled in the lab. To simplify assumptions about the number of fossils in an area, we only used field collection numbers as a proxy for the total number of fossils. Therefore, we tested only previous collection as the variable controlling fossil abundance.
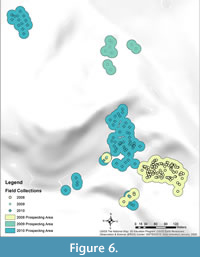 With the digitized locality data, we estimated year to year yield by approximating a collection area for each year and then looking at the difference in number of collections from early to later years with overlapping collection areas. We estimated a collection area for each year using a 15 m buffer around the collection points for that year (Figure 6). We determined this buffer size using some collection data with known collection areas from overlays of aerial photographs made during fieldwork. This buffer size also accounted for crew size. JODA field practices have the crew spread out and cover separate areas, so a larger crew size means more area covered and not more fossils found in the same area. We used the estimated collection area to identify areas where collection for two years overlapped. For each possible combination of two years, we intersected the estimated collection areas and erased the collection areas of all years between the two years to generate a polygon of collection area that had a hiatus in collection. We counted the number of field collections for each year within these overlap areas to compare how many collections were made in the earlier year compared to the later year based on the length of hiatus (Appendix 1). We automated these steps with a Python 2.7 (Python Software Foundation, 2019) script integrated into ArcMap 10.5 (ESRI, 2017) to go through every combination of years (Appendix 2).
The final raw dataset included the length of hiatus for each year combination, the overlap area in square meters, the number of field collections for the early year within the overlap area, and the number of field collections for the later year within the overlap area (Appendix 1). We created two indices to compare the number of field collections for different lengths in hiatus: yield difference over area (YDOA) (Eq. 1) and last year yield over area (LYYOA) (Eq. 2).
YDOA = ((Last year yield - First year yield)/Area)*1000
1
LYYOA = (Last year yield/Area)*1000
2
A negative value for YDOA indicates more collection occurred in the earlier year and a positive value indicates more collection in the later year. A negative value would indicate the area had not “recharged” with fossils since the last time of collection, and a zero or positive value would be expected if enough time had elapsed to expose more fossils in the area. LYYOA will always be zero or positive and is expected to be higher for longer hiatuses with more time for fossils to erode out in the area. We binned each overlap area by the length in hiatus and compared areas with a 1, 2, 3, 4, or 5+ year collection hiatus (Appendix 1). We grouped the longer hiatuses to compare with the proposed four-year recharge (Fremd, T., Memo to Superintendent, John Day Fossil Beds National Monument, February 17, 1986) and because longer hiatuses were less common.
We performed all statistical analysis in the R programming language (R Core Team, 2017). First, we tested for normality and homogeneity of data using the Shapiro-Wilk W test and Bartlett test, respectively (Bartlett, 1937; Shapiro and Wilk, 1965). Because the results of these tests indicated non-normal and/or heterogenous data, we used nonparametric statistical tests to evaluate the data. We separated the dataset by length in hiatus and tested each subset for a significant difference from zero in YDOA using a one-sample Wilcoxon test (Wilcoxon, 1945). We then tested for differences in LYYOA between the different hiatus lengths using the nonparametric Kruskal-Wallis one-way analysis of variance (Kruskal and Wallis, 1957).
RESULTS
Our calculated overlap areas with number of field collections and each are presented in Appendix 1. Most overlap areas contain some amount of field collections, but some do not. These were included in the final calculations because they indicate areas that were prospected in multiple years and fossils were found in neither. We also found a greater number of overlap areas in the 5+ year hiatus category than any other category. The variation in sample size across the hiatus categories indicates a heterogenous dataset.
The distributions of both YDOA and LYYOA were found to be non-normal and heterogenous. The Shapiro-Wilk test returned a p -value of <0.0001 for both YDOA and LYYOA, rejecting the null hypothesis of normality for both datasets. The Bartlett test returned a p -value of 0.002 for YDOA and a p -value of 0.0003 for LYYOA rejecting the null hypothesis of homogeneity for both indices. Based on these results, we evaluated for significant differences between different length hiatuses using nonparametric tests.
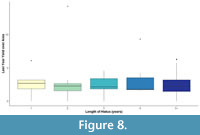
We found YDOA to have no significant difference from zero for any of the hiatus lengths using the Wilcoxon test. For the 1, 2, 3, 4, and 5+ hiatus length classes the Wilcoxon test returned a p -value of 0.4185, 0.7874, 0.234, 0.8339, and 0.417, respectively, rejecting the alternative hypothesis that any length in hiatus had a YDOA greater or less than zero. In addition, the Kruskal-Wallis test for LYYOA returned a p -value of 0.9643, well over our p =0.05 threshold for significance. The examination of the boxplots for both these indices shows similar medians and distributions across all hiatus length classes (Figure 7, Figure 8).
DISCUSSION
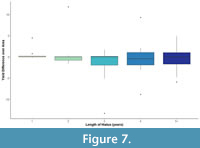 Our results indicate that the number of field collections made in the Turtle Cove Member remains approximately the same no matter the length of hiatus in collection. Based on the results of the Wilcoxon test, YDOA has no significant difference from zero for any hiatus length. This shows that overall, the number of collections in an earlier year is not statistically different from the number in a later year in the same area, regardless of the amount of time left to erode. If the rock required more time to erode to expose fossils, the median for shorter hiatuses would be expected to be negative, and the median for longer hiatuses would be zero or positive. Likewise, the distribution of LYYOA would be expected to be higher for longer hiatus lengths compared to shorter hiatus lengths. However, the boxplot for LYYOA shows that the medians for each hiatus length category are approximately the same (Figure 8). These results suggest that the recharge rate for the Turtle Cove Member is a year or less.
 These results reflect the high number of collections found year to year along the trail that runs through the Test Area’s center. This trail is walked by both visitors and rangers who have the opportunity to report new fossils as they appear. Park paleontologists have thoroughly inventoried and collected the material along the trail several times since 1999, most recently in 2017. Even still, new fossils continue to be found by visitors and staff casually visiting the area.
This short recharge rate fits with the known lithology of the Turtle Cove Member. Water easily softens and transports the claystones of the Turtle Cove Member, shaping the characteristic badlands topography (Graham, 2014). Additionally, the Turtle Cove Member is incredibly fossiliferous as seen in the field collection data and by observation of JODA paleontologists. Given the rapid erosion and number of fossils in this member, it is plausible that the major collection areas recharge after one winter of erosional forces acting on the rock. Erosion also likely reburies exposed fossils while weathering exposes buried fossils, setting a dynamic equilibrium of fossils discoverable during monitoring.
While these results show that approximately the same number of collections will be made regardless of hiatus length, several other factors control the number of collections made. First, the more time spent prospecting an area can increase the number of fossils found. The prospecting style of the people in a group can change whether many small fossils, such as rodent teeth or fragmentary bone, are found in a small area or whether larger fossils are found across a widespread area. It is also possible that while the number of collections stays the same from year to year, more fragmentary fossils are found after a short hiatus and more intact fossils are only found after a long hiatus with more time to be exposed, or vice versa. Variable lithology within the Turtle Cove could also control the size and number of fossils found. Different preservational environments, such as sandstone lenses or ash tufts may have different concentrations, sizes, shapes, and types of fossils as well as different erosional rates when compared to the rest of the unit (Wilson and Moore, 2016). Finally, accessibility of exposures needs to be considered when looking at the number of collections in an area. Exposures of Test Area not explored in the past 20 years are difficult to reach safely, and the most heavily collected areas are along the official trail through the center of Test Area.
Although many factors influence the number of fossils found prospecting on any given trip, the results of this analysis demonstrate that the Turtle Cove Member reliably produces fossils each year independent of past fieldwork contrary to the previously suggested four-year interval. The initial purpose of the four-year return interval and cyclic prospecting was to collect as many scientifically valuable fossils as possible as they were exposed by weathering and before they were destroyed in anticipation of future research questions (Fremd, T., Memo to Superintendent, John Day Fossil Beds National Monument, February 17, 1986; Fremd, 1995). The calculated recharge rate of one year or less demonstrates that to collect every potentially scientifically valuable fossil in JODA, every area would need to be inventoried annually. However, current park collections spaces and staffing make the logistics of this approach infeasible. We therefore have outlined a new resource management strategy to replace cyclic prospecting at JODA by reviewing the limitations of park resources.
Through the digitization and analysis of field collection data and discussion with park staff, we have identified the major issues with the cyclic prospecting schedule at John Day Fossil Beds National Monument. The area set to be covered each year by the cyclic prospecting schedule is too large to be completed within the given time frame by park staff. Inclement weather and other unforeseen disruptions can randomly cancel field days throughout the year, limiting the amount of time field crews could go out and disrupting the schedule even when adding field days year-round. Once off schedule, it is difficult to review which areas have or have not been inventoried without going back through several years of field notes or relying on institutional knowledge. Additionally, the current schedule does not include other obligations, such as BLM localities and the Clarno, Mascall, and Rattlesnake formations, or other priorities, such as the monitoring and retrieval of not-collected or partially-collected paleontological resources and cataloging the backlog of fossils in accessions. Because park priorities change from year to year, we recommend retiring the cyclic prospecting schedule and moving to a system of flexible inventory and monitoring.
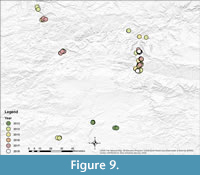 Our proposed inventory and monitoring system heavily relies on the efficient tracking of previously visited areas. Tracking areas visited directly through field notes requires sifting through hundreds of pages of handwritten notes. To alleviate this issue, we have created a geodatabase of all locality data. Currently this database is served only at JODA, but the intention is to have it served by the Upper Columbia Basin Inventory and Monitoring Network or at the national level in a cloud server restricted to authorized users. The current geodatabase allows the user to see all collection areas at a glance (Figure 9). Users can also navigate the map and search through the attribute table of field collections to check on specific areas or named localities. Additionally, this geodatabase will assist in tracking partially-collected or not-collected resources needing excavation, jacketing, and/or extraction. Updating this geodatabase with current information each year will be simplified as Collector for ArcGIS is implemented in field collection, and points can be uploaded and downloaded directly from the ArcGIS Online Cloud service, especially as these tools become standard for the Department of the Interior.
We recommend that JODA sets collection priorities yearly using the geodatabase tracker to locate an area not recently visited. The paleontology staff can then decide the areas to cover based on available resources and research priorities. To inform these decisions, we propose some guidelines to be followed each year to avoid major collection biases. Cyclic prospecting aimed to collect everything, large or small, across all areas of the park. To continue this relatively unbiased collection style, we recommend one major collection area out of the five areas outlined by the cyclic prospecting schedule be chosen each year as the primary collection area and worked through systematically as has been done in the past with cyclic prospecting. If the area is not completely covered in one year, the geodatabase tracker can then be used to pick up again the next year. We also recommend that every part of these areas be revisited at least once every 10 years to check for more complete or rare paleontological resources, such as partial skeletons, to minimize loss of major finds to erosion. The areas more vulnerable to poaching by visitors should be revisited more frequently, possibly monitored on a yearly basis, namely the areas near official visitor trails or visitor-created or “social” trails. Inventorying the major area chosen within the park should take approximately one half of the total field days for the year. The paleontology staff can then allocate the other field days to secondary collection tasks, such as other formations in the park or BLM sites, or the days required for jacketing and removing larger specimens. Additional days would need to be included for any construction mitigation projects occurring within NPS-administered lands. Finally, we recommend high priority be given to fully removing jackets as soon as they are created. Larger jackets can take a crew of 3-4 days to remove. In the past, jackets have been left partially completed for years as other fieldwork took priority, leading to the degradation of the fossil inside. If a jacket cannot be completed and removed within a field season, the fossil should be stabilized with field consolidant and left unjacketed until the excavation can be fully completed. These resources should be monitored regularly while they are in the field.
Our flexible inventory and monitoring system shifts JODA’s collection practices to more effectively represent the full 40 million years recorded in the John Day basin with limited resources. However, given the high volume of fossils eroding out of the Turtle Cove Member, JODA has several internal and external options to increase resources available for fieldwork and recover more fossils. In the past, JODA staff applied for project funds internal to the NPS (Service-wide Comprehensive Call) to temporarily increase staffing. We recommend a continuance of this practice. Providing internship opportunities like the Geoscientists-in-the-Parks Program will continue to supply additional field assistants. Often, non-paleontology staff of JODA will also supplement field crews. The JODA staff can also continue to peruse in-kind collaborations with other land management agencies (e.g., BLM and USFS) to increase the size of field crews. This practice can also work with state and private organizations. A new option established in 2018 is the use of the NPS memorandum of understanding (MOU) between the NPS Paleontology Program, the Paleontological Society (PS), and the Society of Vertebrate Paleontology (SVP). Additional fieldwork done by members of these societies can be accomplished though this MOU. Researchers, museums, or universities can also collaborate with JODA to conduct permitted fieldwork within JODA or the greater fossil beds and even curate JODA specimens given proper repository agreements are established.
Although some of these suggestions are specific to JODA, the principles of a flexible inventory and monitoring system could effectively be applied to other field programs run by public land managers, universities, or museums. Digitally mobilizing “dark” fossil locality information allows researchers to easily visualize large amounts of field collection data (Marshall et al., 2018). These data can be used to relocate old sites, identify underworked areas, or analyze fossil yield (Haug, 2016). Importantly, a central locality geodatabase eases confusion that can occur with turnover in staff. For example, over the course of digitization, we identified a portion of Test Area that had not been visited for 17 years and then inventoried that portion on a subsequent field day. Prior to the creation of our tracker geodatabase, this information would have only been accessible by sifting through several field notebooks and associated maps and overlays. Finally, our suggestions aim to strike a balance between collecting everything in an area to avoid collection bias and collecting only rare or “scientifically significant” fines to curate a collection with limited space. Data from our yield analysis show that collecting every fossil out of the Turtle Cove Member, in addition to every other park obligation, is extremely difficult given available resources. Rather, we aim to use a combination of systematic inventorying and year-to-year decision making based on previous locality data to spread park resources as efficiently as possible. Partnerships with other organizations and NPS project funds can then be used to recover more paleontological resources from the Turtle Cove Member without adding additional strain to JODA’s resources.
CONCLUSION
Digitizing locality data enabled identification of patterns in past fieldwork practices, analysis of fossil yield, and the creation of a new prospecting plan for John Day Fossil Beds National Monument (JODA). Through direct observation, we found that the cyclic prospecting schedule intended to spread year to year fieldwork evenly throughout JODA has never consistently been followed and that some areas were visited more frequently than others. We identified the four-year return interval of the cyclic prospecting schedule as the core cause of these issues. Analysis of the locality data showed that fossil yield was about the same no matter how long an area was left untouched. Based on the original aim of the cyclic prospecting schedule, to collect as many fossils eroding out as possible, JODA staff would have to return to every exposure of the lower Turtle Cove Member every year. Constraints on space and staff make this strategy impractical. Instead, we propose a new flexible inventory and monitoring system wherein the paleontology staff makes fieldwork decisions year to year using the digitized locality data as a guide. We created a tracker geodatabase at JODA, which will contain all locality data associated with the park and its collections. This will allow staff to see previous years collection at a glance and choose areas for fieldwork that optimize the museum collection at JODA to be as representative of the entire park as possible.
Many museums and universities have years to decades long field programs with associated locality data. At JODA, we have shown that digitizing “dark” locality data and capturing future locality data digitally can better inform decisions for future fieldwork. Other field programs could use these methods to re-evaluate existing fieldwork plans or create new ones. By setting fieldwork priorities based on existing locality data, paleontological researchers and resource managers can more efficiently make decisions on where to do fieldwork next and how much to collect.
ACKNOWLEDGMENTS
We would like to thank the Geoscientist-in-the-Parks program, NPS Geologic Resources Division, AmeriCorps, and Environmental Stewards for their financial and administrative support of AEK during her internships in 2018 and 2019. This work could not have been completed without the countless hours of fieldwork performed by John Day Fossil Beds National Monument (JODA) paleontology staff over the years lead by T.J. Fremd, J.X. Samuels, and NAF and the superintendents who created and supported the JODA paleontology program (B. Ladd, J. Hammett, S. Hall, and P. Gamman). We also thank the IU paleontology group, A. Sharp, A. Jerolleman, and two anonymous reviewers for their constructive reviews of this manuscript.
REFERENCES
Albright III, L.B., Woodburne, M.O., Fremd, T.J., Swisher, C.C., III, MacFadden, B.J., and Scott, G.R. 2008. Revised chronostratigraphy and biostratigraphy of the John Day Formation (Turtle Cove and Kimberly Members), Oregon, with implications for updated calibration of the Arikareean North American Land Mammal Age. The Journal of Geology, 116:211-237. https://doi.org/10.1086/587650
Anemone, R., Emerson, C., and Conroy, G. 2011. Finding fossils in new ways: an artificial neural network approach to predicting the location of productive fossil localities. Evolutionary Anthropology: Issues, News, and Reviews, 20:169-180. https://doi.org/10.1002/evan20324
Bartlett, M.S. 1937. Properties of sufficiency and statistical tests. Proceedings of the Royal Society of London A, 160:268-282. https://doi.org/10.1098/rspa.1937.0109
Chew, A. and Oheim, K. 2009. Using GIS to determine the effects of two common taphonomic biases on vertebrate fossil assemblages. Palaios, 24:367-376. https://doi.org/10.2110/palo.2008.p08-047r
Condon, T. 1910. Oregon Geology: A Revision of "The Two Islands" by Thomas Condon, with a Few Tributes to the Life and Work of the Author. JK Gill Company, Portland, Oregon.
Cope, E.D. 1885. The Vertebrata of the Tertiary Formations of the West. Book I. Report of the U.S. Geological Survey of the Territories, Washington, D.C.
ESRI. 2017. ArcGIS Desktop: Release 10.5. Redlands, California.
Famoso, N.A. 2017. Statistical analysis of dental variation in the Oligocene equid Miohippus (Mammalia, Perissodactyla) of Oregon. Journal of Paleontology, 91:1060-1068. https://doi.org/10.1017/jpa.2017.42
Famoso, N.A., Samuels, J.X., Hopkins, S.S.B., Davis, E.B., and Emery, M.M. 2016. Updated biostratigraphy of the Turtle Cove Member (John Day Formation) in the John Day basin, Oregon. Society of Vertebrate Paleontology Annual Meeting, Salt Lake City, UT.
Fremd, T.J. 1995. Cyclic prospecting to preserve vertebrate paleontological resources. San Bernardino County Museum Association Quarterly, 42:19-26.
Fremd, T.J. 2010. Guidebook: SVP Field Symposium 2010, John Day Basin Field Conference, John Day Fossil Beds National Monument (and Surrounding Basin) Oregon, USA. Society of Vertebrate Paleontology, McLean, Virginia.
Graham, J.P. 2014. John Day Fossil Beds National Monument: Geologic Resources Inventory Report. Natural Resource Report NPS/NRSS/GRD/NRR--2014/846. National Park Service, Fort Collins, Colorado.
Hanson, C. B. 1996. Stratigraphy and vertebrate faunas of the Bridgerian-Duchesnean Clarno Formation, north central Oregon, p. 206-239. In Prothero, D.R. and Emry, R.J. (eds.), The Terrestrial Eocene-Oligocene Transition in North America. Cambridge University Press, Cambridge.
Haug, N. 2016. Potential fossil yield classification (PFYC) system for paleontological resources on public lands. Instructional Memorandum No. 2016-124, United States Department of the Interior, Bureau of Land Management, Washington, D.C. July, 20, 2016.
Hunt, R.M. and Stepleton, E. 2004. Geology and paleontology of the upper John Day beds, John Day River Valley, Oregon: lithostratigraphic and biochronologic revision in the Haystack Valley and Kimberly areas (Kimberly and Mt. Misery quadrangles). Bulletin of the American Museum of Natural History, 282:1-90.
Korth, W.W. and Samuels, J.X. 2015. New rodent material from the John Day Formation (Arikareean, middle Oligocene to early Miocene) of Oregon. Annals of Carnegie Museum, 83:19-84. https://doi.org/10.2992/007.083.0102
Kruskal, W.H. and Wallis, W.A. 1952. Use of ranks in one-criterion variance analysis. Journal of the American Statistical Association, 47:583-621.
Liggett, G.A., Childs, T., Famoso, N.A., Floray, S., McDonald, H.G., Titus, A.L., and Varner, E. 2018. An overview of the contributions of federal land to paleontology, and a discussion of the U.S. Department of the Interior Museum Program, p. 311-334. In Rosenberg, G.D. and Clary, R.M. (eds.), Museums at the Forefront of the History of Philosophy of Geology, History Made, History in the Making: Geological Society of America Special Paper. Geological Society of America, Boulder, Colorado.
Malakhov, D.V., Dyke, G.J., and King, C. 2009. Remote sensing applied to paleontology: exploration of Upper Cretaceous sediments in Kazakhstan for potential fossil sites. Palaeontologica Electronica, 12.2.3T:1-10.
http://palaeo-electronica.org/2009_2/164/index.html
Marshall, C.R., Finnegan, S., Clites, E.C., Holroyd, P.A., Bonuso, N., Cortez, C., Davis, E.B., Dietl, G.P., Druckenmiller, P.S., Eng, R.C., Garcia, C., Estes-Smargiassi, K., Hendy, A., Hollis, K.A., Little, H., Nesbitt, E.A., Roopnarine, P., Skibinski, L., Vendetti, J., and White, L. D. 2018. Quantifying the dark data in museum fossil collections as palaeontology undergoes a second digital revolution. Biology Letters, 14:20180431.
https://doi.org/10.1098/rsbl.2018.0431
Oheim, K.B. 2007. Fossil site prediction using geographic information systems (GIS) and suitability analysis: The Two Medicine Formation, MT, a test case. Palaeogeography, Palaeoclimatology, Palaeoecology, 251:354-365. https://doi.org/10.1016/j.palaeo.2007.04.005
Python System Foundation 2019. Python Language Reference, version 2.7. Beaverton, Oregon. https://www.python.org/
R Core Team 2017. R: A language and environment for statistical computing. R Foundation for Statistical Computing, Vienna, Austria. https://www.R-project.org/
Retallack, G.J., Bestland, E.A., and Fremd, T.J. 2000. Eocene and Oligocene paleosols of central Oregon. Geological Society of America Special Papers, 344:1-192. https://doi.org/10.1130/0-8137-2344-2.1
Samuels, J.X., Albright, L.B., and Fremd, T.J. 2015. The last fossil primate in North America, new material of the enigmatic Ekgmowechashala from the Arikareean of Oregon. American Journal of Physical Anthropology, 158:43-54. https://doi.org/10.1002/ajpa.22769
Shapiro, S.S. and Wilk, M.B. 1965. An analysis of variance test for normality (complete samples). Biometrika, 52:591-611.
Wilcoxon, F. 1945. Individual comparisons by ranking methods. Biometrics, 1:80-83.
