 Geographic Information Systems technology as a morphometric tool for quantifying morphological variation in an ammonoid clade
Article number: 17.1.19A
https://doi.org/10.26879/418
Copyright Paleontological Society, April 2014
Author biographies
Plain-language and multi-lingual abstracts
PDF version
Submission: 8 July 2013. Acceptance: 17 March 2014
ABSTRACT
Ammonoids are known for their intraspecific and interspecific morphological variation through ontogeny, particularly in shell shape and ornamentation. Many features covary and individual elements are difficult to homologize, which make qualitative descriptions and widely-used morphometric tools inappropriate for quantifying these complex morphologies. However, spatial analyses conducted in a geographic information systems (GIS) environment allow for quantification and visualization of global shell form. Here, we present a GIS-based methodology in which the variation of shell features is assessed to evaluate evolutionary patterns in an ammonoid clade from the Late Cretaceous Western Interior Seaway of North America. We investigate the ancestral and more variable scaphitid heteromorph ammonoid Hoploscaphites spedeni and its less variable descendant H. nebrascensis. We created three-dimensional (3D) digital models of the fossil shells' lateral surfaces using photogrammetric software and imported the reconstructions into a GIS environment. We used the number of discrete aspect patches and the surface-to-planimetric (3D to 2D) area ratios of the lateral surface as terrain roughness indices. These 3D spatial analyses demonstrate the overlapping morphological ranges of H. spedeni and H. nebrascensis in ornamentation despite differences in shell compression. Additionally, the target for evolutionary change in this clade resides in the macroconch body chamber, which becomes less variable through development from H. spedeni to subsequent H. nebrascensis in macroconchs; however, microconchs retain the ancestral variation through ontogeny. These geospatial analyses not only successfully quantified variation in complex morphologies, but also demonstrated the versatility of this method to address questions related to ontogeny and phylogeny.
Mathew J. Knauss. Department of Earth Sciences, University of California, Riverside, 1242 Geology Building, Riverside, California, 92521, USA. mknau001@ucr.edu
Margaret M. Yacobucci. Department of Geology, Bowling Green State University, 190 Overman Hall, Bowling Green, Ohio, 43403-0218, USA. mmyacob@bgsu.edu
Keywords: ammonoids; intraspecific variation; ontogeny; GIS; morphometrics
Final citation: Knauss, Mathew J. and Yacobucci, Margaret M. 2014. Geographic Information Systems technology as a morphometric tool for quantifying morphological variation in an ammonoid clade. Palaeontologia Electronica Vol. 17, Issue 1;19A; 27p. https://doi.org/10.26879/418
palaeo-electronica.org/content/2014/721-gis-based-morphometrics
INTRODUCTION
Paleontologists recognize numerous examples of interspecific and intraspecific variation in ammonoids (Reeside and Cobban, 1960; Westermann, 1966; Kennedy and Cobban, 1976; Howarth, 1978; Landman et al., 1991; Hohenegger and Tatzreiter, 1992; Dagys and Weitschat, 1993; Landman and Geyssant, 1993; Checa et al., 1996; Dagys et al., 1999; Morard and Guex, 2003; Kakabadze, 2004; Harada and Tanabe, 2005; Monnet and Bucher, 2005; Gangopadhyay and Bardhan, 2007; Gerber et al., 2007; Weitschat, 2008; Monnet et al., 2010; Monnet et al., 2011; De Baets et al., 2013). Some of these examples, such as the ammonoids described by Weitschat (2008), demonstrate a large spectrum of morphological variation that is present among stratigraphically co-occurring specimens of the same species. These examples express variations in size, shape and ornamentation throughout the ontogeny of each taxon. If each morphotype of a species was found separately, some paleontologists may classify these specimens as different, closely related species or even genera; however, the morphotypes of each example are often spatially and temporally observed together, which suggests that these morphoypes belong to the same taxon.
Oversplitting of taxa is a serious problem in paleontology since it can cause evolutionary trees, which are necessary for studying evolutionary relationships and the evolution of new character states, to become unresolved (Dzik, 1985; Hughes and Labandeira, 1995; Korn and Klug, 2007). Due to dissimilar morphological variances between some characters, such as septal suture form (Yacobucci and Manship, 2011) and other characters such as shell shape and ornamentation, cladistic approaches used by biologists and paleontologists to define the evolutionary relationships of ammonoids often are inconclusive (Yacobucci, 2012). However, by understanding the spread of variation of relatively variable characters, researchers can better define and utilize characters and character states they apply in cladistic analyses to develop plausible evolutionary trees.
Recognizing the possibility of drastically variable morphological extremes within a species, many paleobiologists seek to explore the mechanisms causing such variation within a taxon. While exact growth rates of ammonoids are unknown, some researchers have concluded that heterochrony (changes in the timing and rate of developmental traits during ontogeny) may play an important role in creating new species (Gould, 1977; Alberch et al., 1979; Landman and Geyssant, 1993; Yacobucci, 1999; Harada and Tanabe, 2005; Gangopadhyay and Bardhan, 2007; Korn et al., 2013). Alternatively, differing paleoecological factors during the existence of any species may account for a broad spectrum of morphological variation, which has been documented recently in several studies on extant and extinct mollusks; see Urdy et al. (2010) and Wilmsen and Mosavinia (2011) for examples. Most likely, both ecophenotypic and genetic variability play a role in creating variation within a species; however, before researchers can distinguish the controls and effects of these two mechanisms, a new methodology is necessary to quantify the spectrum of variation present within a species.
Previous Methods for Quantifying Intraspecific Variation
Ammonoid workers have used a number of techniques to characterize morphological variation: traditional morphometrics, mathematical models, landmark or semi-landmark analyses and qualitative descriptions.
Traditional morphometric involves collecting measurements, such as shell diameter, coiling radius and whorl height, which are subsequently used to calculate Raup's (1966, 1967) parameters to describe variations in the shape of coiling shells. With these parameters, researchers can generate ontogenetic trajectories to describe, compare, and project the possible morphotypes of a taxon (Yacobucci, 2004; Gerber et al., 2007; De Baets et al., 2012; Korn, 2012). While this method does allow for quantitative analysis of disparity within a species or higher taxonomic group, few studies (De Baets et al., 2013) have accounted for ornamentation and its covariation with shell shape within a species; this covariation of ornamentation and shell shape is so prevalent in many ammonoids that it has been dubbed Buckman's First Law of Covariance (Westermann, 1966). Traditional morphometric techniques may be ineffective in their ability to capture the full morphological spectrum of a species.
Mathematical reconstructions allow for shell characteristics to be created and modified to test predictions of morphological change through development (Hariri and Bachnou, 2004; Hammer and Bucher, 2006; Ubukata et al., 2008). Depending on the sophistication of the mathematical models used, some studies may lack an evaluation of how shell shape characters change due to the appearance and disappearance of ornamentation types throughout development. Also, mathematical models may not accurately portray the true morphological variation that occurs at different stages of shell formation.
Landmark-based geometric morphometrics has been used to quantify morphological variation in a number of mollusk species (Stone, 1998; Bocxlaer and Schultheiss, 2010; Reyment, 2011; Bookstein and Ward, 2013). However, landmark techniques require that specific, ideally homologous points can be located on every specimen. In the case of ammonoids, ornamentation can be so variable within a species that no homologous landmarks can be determined that encompass the entire shell form (shape, size and ornament). Although some paleontologists have been successful in using landmarks to describe the shape of ammonoid ribs and overall shape of the shell (Neige, 1999), these studies fail to quantify features such as duration of particular ornaments at ontogenetic stages, variations in shell shape due to strong ornamentation and the clustering of analogous tubercles throughout ontogeny.
Semi-landmarks and closed outline curve morphometrics have also been explored by workers (Reyment and Kennedy, 1991; Bocxlaer and Schultheiss, 2010; Korn and Klug, 2012; Bookstein and Ward, 2013). Semi-landmarks are defined as evenly-spaced, though arbitrary, points along homologous, open or closed curves (Bocxlaer and Schultheiss, 2010). These studies focus mainly on shell shape or shell coiling without addressing ornamentation's effect on these morphological characters. The quantity and placement of ornamentation in some ammonoids varies to such a degree that landmark and semi-landmark techniques alone are impractical to use to quantify variation.
Qualitative descriptions are widely used to explain ornament and shape variation through ontogenetic development (Landman, 1987; Landman and Waage, 1993; Harada and Tanabe, 2005; Gangopadhyay and Bardhan, 2007; Weitschat, 2008; Nishimura et al., 2010; Wilmsen and Mosavinia, 2011). For example, a paleontologist describes what type of ornamentation (ribs, tubercles, bullae, etc.) is present at any given stage in ontogeny and how these features differ within and between species. While qualitative methods can be good descriptors for the variation observed in a given taxonomic group, these practices allow for biased results since many descriptions can be subjective (Bocxlaer and Schultheiss, 2010). Researchers should use new methods to quantitatively describe complex ammonoid morphologies so that morphological variation can be closely examined.
Geographic Information Systems (GIS) as a Morphometric Tool
Geographic information systems (GIS) technology presents a new methodology that paleontologists can exploit for quantifying morphological variation when homologous landmarks cannot be determined. A GIS environment permits complex, spatially distributed information to be documented and analyzed quantitatively. By using a GIS framework for spatial analyses, researchers can store, visualize, manipulate and quantitatively assess global or local variation on a surface (Yacobucci and Manship, 2011). Complex anatomical forms can be analyzed in their full 3D form instead of being simplified into a few metrics that do not represent the entire, continuous morphology.
For over a decade, evolutionary biologists and paleontologists have explored the utility of a GIS-based methodology to assess different morphologies. The occlusal surfaces of mammal teeth (Zuccotti et al., 1998; Jernvall and Selänne, 1999; Ungar and Williamson, 2000; M'Kirera and Ungar, 2003; Ungar, 2004; Evans et al., 2007; Plyusnin et al., 2008; Eronen et al., 2009; Wilson et al., 2012; Salazar-Ciudan and Marin-Riera, 2013), conodont elements (Manship et al., 2006) and various echinoderm skeletal elements (Zachos, 2012; Sheffield et al., 2012) have all been quantified via GIS-based spatial analyses.
Ammonoid workers have begun to use geospatial analyses to visualize and quantify suture form to address questions related to ammonoid paleobiology (Manship, 2004; Waggoner and Manship, 2004; Yacobucci and Manship, 2011). Additionally, Knauss (2012; 2013b) used GIS to quantify intraspecific variation in regards to shape and ornamentation of ammonoids through their late ontogeny. By using GIS to analyze shell morphology as a "landscape," researchers can directly compare morphological variation with respect to shape and ornamentation within a species to address paleobiological questions.
Here we present a new methodology for ammonoid workers to visualize and quantify intraspecific variation through the late ontogeny of ammonoids with respect to 3D surficial characters, such as ornamentation and shell shape, using as our example a heteromorph clade from the Late Cretaceous Western Interior of North America. First, we applied a 3D GIS-based methodology to the flank surface of each ammonoid to globally quantify and visualize morphological variance, focusing on the surface roughness or "topography" of the shell. Second, we synthesized these data and compared the exposed phragmocone, formed during the juvenile stages (Bucher et al., 1996), to the final body chamber, formed during the morphogenetic countdown to full sexual maturity, between both dimorphs of the ammonoid species. From these comparisons, we determined the target of evolutionary change, that is, the ontogenetic stage exhibiting the broadest spectrum of variation that may provide the most "raw material" for natural selection. Last, we evaluated the GIS-based technique for its usefulness in quantifying ornament and shell shape intraspecific variation in these ammonoids.
METHODS
Ammonoid Taxa
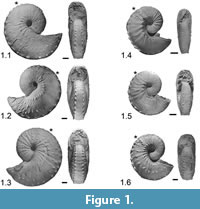 The ammonoids used for these GIS-based analyses are scaphitid heteromorphs. Scaphites are known for their planispiral phragmocones and straight shaft final body chambers, which terminate in a detached hook that is recurved back toward the phragmocone. Because of the significant morphological changes that occur at the onset of the final body chamber, these taxa allow for the late ontogenetic stages to be defined more discretely than some non-heteromorph ammonoids. Scaphitid ammonoids, therefore, are good candidates for testing a new GIS-based morphometric technique for quantifying intraspecific variation through late ontogeny.
Hoploscaphites spedeni. Numerous ammonoid specimens belonging to the scaphitid genus Hoploscaphites are known from the Late Cretaceous Western Interior of North America. Hoploscaphites spedeni is highly variable in shell size, shape and ornamentation (Figure 1.1-6). Diagnostic characteristics of this species include:
Macroconch shape variable, dominantly stout with quadrate to slightly depressed aperture[,] body chamber with strong, locally clavate ventrolateral tubercles, usually with bullae below umbilical shoulder[,] scattered flank tubercles/bullae on hook [and] phragmocone with up to four rows of tubercles or none. Last whorl of microconch more loosely coiled, commonly with mid flank row of tubercles on body chamber; phragmocone variously tuberculate (Landman and Waage, 1993, p. 129).
Landman and Waage (1993) demonstrate the morphological variation of this taxon through numerous images, qualitative descriptions and size and shape morphometrics. They recognized three major forms, which they dubbed typical, rotund and compressed. Reflecting Buckman's Law of Covariation (Westermann, 1966), the rotund forms tend to be heavily ornate while the compressed forms have sparse ornamentation. The typical form, the most common morph of H. spedeni, has features that grade between the rotund and compressed forms. Both macroconchs and microconchs (sexual dimorphs) are known in this species. Stratigraphically, this species occurs in the upper-most Pierre Shale and lower Fox Hills Formations of the Late Cretaceous (Maastrichtian) Western Interior. The morphotypes of this species co-occur in many instances and are mainly recovered from stratigraphically discrete concretionary layers, suggesting a fine temporal control for these exceptionally well-preserved ammonoids. H. spedeni occurs only in the H. nicolletii Range Zone and has proven to be an important index fossil for biostratigraphic zonation within the Western Interior (Waage, 1964, 1968; Speden, 1970; Landman and Waage, 1993; Landman et al., 2010; Landman et al., 2013).
Hoploscaphites nebrascensis. Significantly less variable than Hoploscaphites spedeni, H. nebrascensis (Landman and Waage, 1993; Landman et al., 2010) is hypothesized to be a paedomorphic descendant species of H. spedeni via increased juvenile phragmocone flank tubercles, which extend from the phragmocone onto the full body chamber and, in some specimens, extend to the aperture (Landman et al., 2013). Diagnostic characteristics of this species include:
Macroconch compressed, last whorl markedly higher than wide, phragmocone conspicuously tuberculate with strong ventrolateral tubercles and five to seven rows of weaker flank tubercles, which commonly extend onto part of the body chamber. Microconch variably tuberculate, commonly with double row of umbilical tubercles/bullae (Landman and Waage, 1993, p. 161).
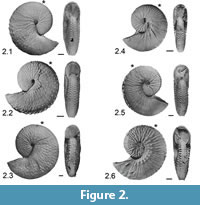 As in H. spedeni, both macroconchs and microconchs of H. nebrascensis are known. In a description of scaphitid ammonoid specimens recovered from the Late Cretaceous Western Interior, Landman and Waage (1993) show that most H. nebrascensis ammonoids are less variable in characters such as shell shape, size and ornamentation (Figure 2.1-6). In fact, the shape of the macroconchs remains consistent among specimens regardless of variations in shell size, and tubercles are found on almost all ribs. Most notably, a researcher can distinguish H. nebrascensis from H. spedeni by the extensive tuberculation of the shell through the full ontogeny. However, discoveries of intermediate specimens assigned to H. spedeni (Landman et al., 2013) show that a qualitative assessment of ornamentation (i.e., tubercles) may be ineffective in species identification due to the possible overlap in the variation spectra between H. spedeni and H. nebrascensis. Stratigraphically younger than H. spedeni, H. nebrascensis occurs in the mid to upper Fox Hills Formation in the H. nebrascensis Range Zone (Waage, 1964, 1968; Speden, 1970; Landman and Waage, 1993; Landman et al., 2010; Landman et al., 2013).
Three-Dimensional Digital Modeling
Specimens belonging to H. spedeni and H. nebrascensis were observed, measured, and photographed at the Yale Peabody Museum of Natural History (YPM). These specimens were previously sampled from concretions located at the type locality of the Fox Hills Formation near the Black Hills of South Dakota (USA) (Landman and Waage, 1993). Of the numerous specimens housed at YPM, we observed the best preserved specimens for this analysis: 19 macroconchs and 20 microconchs of H. spedeni and five macroconchs and five microconchs of H. nebrascensis. In order to quantify variation using GIS techniques, we created digital models of each specimen. We used photographs, photogrammetric software, and 3D rendering and editing software (Falkingham, 2012) to reconstruct each fossil specimen in a 3D format.
Falkingham (2012) has shown that this methodology for acquiring 3D digital models of fossils creates a higher resolution model than if one used a 0.3 mm resolution laser scan to generate 3D reconstructions. Additionally, photogrammetry has several advantages in comparison to using a 3D laser scanner. First, photogrammetry is significantly less expensive than more traditional 3D digital modeling techniques since the researcher only requires an ordinary digital camera to photograph specimens. Second, many of these software packages are accessible online and at no cost to the researcher. Last, photogrammetry can be less time-consuming in comparison to other 3D modeling methods; high resolution digital models can be created with as few as 30 photographs (Falkingham, 2012), making this method for producing 3D models highly advantageous for many researchers.
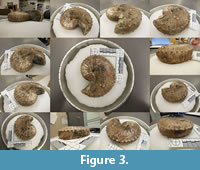 For each specimen observed, we captured 140 to 200 photographs, depending on its size, of the best preserved lateral surface of the shell. To ensure that full coverage of the lateral surface was properly photographed, we placed each shell on an adjustable cushion contained within a round pan with every 10° marked off along the pan's edge ranging from 0° to 350° (Figure 3). The cushion allowed for each fossil specimen to be positioned so that the dorso-ventral plane was perfectly level, which is convenient for GIS analyses; we used a bubble level to verify the leveling around the shell. We captured three to four photographs varying in angles between parallel and perpendicular to the dorso-ventral plane at every 10° mark around the specimen. Three to four photographs captured at every 10° around the specimen are necessary because at least three key points must be recognized in each photograph for proper reconstruction (Falkingham, 2012); however, this method does not require that photographs be taken at specified angles from the horizontal plane. Once these photographs were captured, we took additional random photographs around the specimen at varying angles to ensure photographs overlapped in their coverage of the ammonoids. We used a Nikon S6200 digital camera to take photographs of the specimen at 6.0 MPX; a low pixel resolution allowed for more storage capacity without sacrificing image quality at the small scale of the camera's view. In addition to photographing the specimens, we measured standard ammonoid shell parameters using digital calipers.
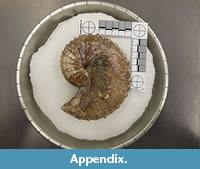 Several free photogrammetric software programs are available for 3D digital modeling. The program 123D Catch (Autodesk, Inc., 2013) was the most efficient at creating accurate models and was therefore used for this analysis (see Appendix). To delete extraneous background points, we exported the dense-point clouds produced by 123D Catch as .OBJ files and then imported these files into MeshLab (Cignoni et al., 2011), an open source program for processing and editing 3D digital models. Once imported into MeshLab, we removed extraneous background points that were positioned around the ammonoid dense-point cloud model. Additionally, we digitally cut each ammonoid along the dorso-ventral plane so that only the lateral surface facing up was assessed. We visually approximated the position of the dorso-ventral plane along the ammonoid's keel; because we verified the orientation of the dorso-ventral plane of each ammonoid with a bubble level when photographing them, the error in the visual approximation of the dorso-ventral plane is unlikely to be a major factor. After editing the ammonoid 3D models in MeshLab, we extracted the vertices of the .OBJ files (the dense-point cloud having between 100,000 to 200,000 points) and saved them as a text file to be uploaded directly into GIS software as a series of GPS coordinates.
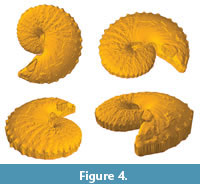 To reconstruct the ammonoid surface within ArcGIS 10 (ESRI, Inc., 2011), we created a triangulated irregular network (TIN), defined as "a data model for storing surfaces as triangular facets with varying orientations" (Price, 2012, p. 591), from the imported XYZ vertices of the dense-point cloud (Figure 4). We verified that the TIN surface was equally as visually accurate as the original photographs of the ammonoid specimens (Figure 3, Figure 4). We left the scale of each ammonoid TIN model at its default setting since the GIS analyses of 3D models we utilized are scaleless.
Morphological Analyses in GIS
Orientation Patch Count Analysis. Various researchers who utilize GIS to quantify morphology have used surface aspect, or slope direction, on vertebrate teeth (Ungar and Williamson, 2000; Evans et al., 2007; Wilson et al., 2012; Salazar-Ciudad and Marin-Riera, 2013). Specifically, these researchers used the number of discrete patches with different aspects on the surface of the tooth as an index for dental complexity. Evans et al. (2007) and Wilson et al. (2012) called this metric "orientation patch count (OPC)," and currently a database is growing that lists the OPC of various mammalian teeth. If the tooth surface is complex (i.e., having numerous ridges or cusps), then the OPC will be higher; likewise, if the tooth surface is fairly simple (i.e., being only a single ridge), then the OPC will be lower. We emphasize that the OPC metric is scaleless and does not necessarily take into account the area of individual patches, but rather, it only considers the number of patches. For example, a large conical-shaped feature will have the same number of aspect patches as a proportionally smaller feature of the same shape.
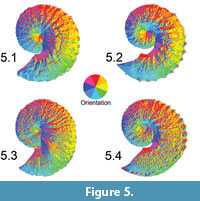 We applied this OPC index to the ammonoid TIN surfaces within ArcGIS 10 (Figure 5.1-4). H. spedeni and H. nebrascensis both have ribs and tubercles. Ribs running along the flank of the shell are equivalent to an elongate ridge, having two main slope aspects (e.g., North and South). On the other hand, tubercles are circular to ellipsoid in shape, having potentially more than two main slope aspects (e.g., North, South, East and West). By extracting a polygon feature class containing all the discrete aspect patches (North, Northeast, East, Southeast, South, Southwest, West and Northwest), we were able to count the total number of polygons representing the lateral shell surface. We compared this metric between A) both dimorphs, B) both lefts and rights, and C) both phragmocones and body chambers. The largest specimens tended to be the most tuberculate; therefore, we predicted that the largest specimens would have the highest OPC values.
Two technical difficulties arose when constructing aspect polygons. Due to the manner in which ArcGIS 10 reads class break tables assigned to TINs for reclassification of feature classes, the North aspect is divided into two feature class polygons: 337.5° to 359.9° and 0° to 22.5° (the default classification). Two adjacent polygons both belonging to North were not merged together if one polygon was west of 0° and the other east of 0°. Additionally, the TIN surface showed numerous very small polygons of different aspect around the margins of the ammonoid models (see Figure 5.2 for an example), most likely reflecting errors at these steeply sloping areas in the generation of the TIN surface in ArcGIS 10 (compare Figure 3, Figure 4, Figure 5). These extraneous polygons around the perimeter of each shell coupled with the two North aspect feature classes caused inflation of the OPC. However, all specimens were subject to these same types of errors, and we are confident that comparative evaluation of OPC values is still valid.
Preservation of the fossils being modeled should also be considered in any test of surface complexity, such as OPC. Cracks, chips or sections of the shell where the original aragonite has been removed may influence the surface complexity or relief of features on the shell, possibility affecting the OPC value. A long crack, such as that observed in the H. spedeni macroconch featured in Figure 3, may create additional slope surfaces or aspect patches, possibly increasing the OPC value (see also Figure 5.1). Nevertheless, these small cracks on the surface are not likely to largely affect or skew the results of the OPC analysis in these species due to the large number of surface features being quantified, provided that the shell is very well-preserved like the specimens assessed in this study.
We tabulated the OPC for each ammonoid and assessed the distributions of these data. According to a Shapiro-Wilk W test for normality, both species have normally distributed OPC values at the 95% confidence limit (W = 0.97, p = 0.85 for H. spedeni macroconchs; W = 0.95, p = 0.33 for H. spedeni microconchs; W = 0.86, p = 0.22 for H. nebrascensis macroconchs; W = 0.87, p = 0.26 for H. nebrascensis microconchs). Therefore, we deemed a Student's t test for equality of means and F test for equality of variances appropriate initial statistical analyses, which were conducted in PAleontological STatistics (PAST) (Hammer et al., 2001; Hammer and Harper, 2006) at the 95% confidence limit. Additionally, we calculated in PAST the Coefficient of Variation (CV), a statistical treatment commonly used to assess morphological variation (Yacobucci, 2004; De Baets et al., 2013). OPC values were compared for whole shells, separated body chambers, and separated phragmocones and between the sexual dimorphs of both H. spedeni and H. nebrascensis (e.g., macroconch body chambers of H. spedeni vs. macroconch body chambers of H. nebrascensis).
Surface-to-Planimetric Area Ratio. In addition to OPC as a measure of surface ruggedness, some vertebrate paleontologists and biologists use a relief index derived from the ratio of the surface (3D) area to the planimetric (2D map) area of fossil tooth crowns (Ungar and Williamson, 2000). Rashid (2010) demonstrated that the 3D surface area to 2D planimetric area ratio of a topographic surface is a good index for topographic roughness and is independent of scale.
In order to calculate the surface-to-planimetric area ratio, we converted the TIN of each ammonoid to a digital elevation model (DEM) raster, defined as "a data set composed of an array of numeric values (e.g., elevation data), each of which represents a condition in a square element of ground" (Price, 2012, p. 581) within ArcGIS 10. Converting the TIN model to a DEM raster was necessary for raster algebra to be applied within the GIS software. The cells of the raster remained at the default cell size since reducing the cell size or increasing the cell number had no effect on the resolution of the lateral surface of the ammonoid DEM. Rasterizing the 3D model within the GIS software caused a loss of resolution of small-scale topographic features, such as fine ribs. However, large-scale surficial features, such as shell shape (e.g., flank convexity) and the larger tubercles, remained intact. After creation of the DEM raster, we used the 3D Analyst Tools within ArcGIS 10 to create a percent slope raster, where the slope value for each cell was calculated and displayed as a percentage (m%). Using the Raster Calculator Tool within the Spatial Analyst Toolbox, we then applied the following calculation provided by Berry (2013) to the percent slope rasters to calculate the 3D to 2D area ratio index for each cell:

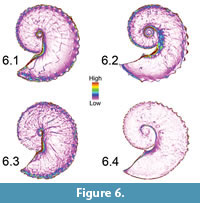 The sudden abrupt change in slope near the ammonoids' ventral and dorsal margins caused the indices to show a strong skew (Figure 6.1-4). We therefore used the non-parametric Mann-Whitney U test for equality of medians at 95% confidence limit for statistical comparisons of the area ratio values. Since the Mann-Whitney U test can only do pairwise comparisons of univariate data, representative ammonoids were selected for statistical analyses. For H. spedeni, we sorted specimens into three bins representing specimens with the lowest, intermediate and highest median area ratios. Individual representative specimens from each bin were then selected for comparison. The expectation was that these bins would reflect the three morphs (compressed, typical and rotund) recognized by Landman and Waage (1993). Since relatively few H. nebrascensis specimens were available for this study, we selected H. nebrascensis representatives with the lowest and the highest median area ratios. Because the number of raster cells was so large for each specimen when observed in its entirety, we isolated and applied statistical analysis to only the separated body chambers and phragmocones of the representatives.
As with the OPC analysis, the surface-to-planimetric area ratio index may be sensitive to the quality of preservation of the ammonoids. For example, the crack observed mid-flank on the body chamber of the H. spedeni macroconch featured in Figure 3 is not only visible in the OPC-displayed TIN model (Figure 5.1) but also visible in the surface-to-planimetric area ratio raster (Figure 6.1) despite the loss of fine-detail in the raster models. However, the number of cells representing the crack in this specimen is low in comparison to the number of cells making up the raster model as a whole. We therefore conclude that in this analysis, cracks and chips to the outer aragonite shell are not likely to largely affect the distribution of the surface-to-planimetric area ratio values but should receive consideration in future work with other ammonoid taxa.
RESULTS
OPC Analysis
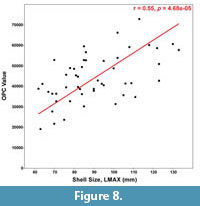
 Visually, OPC can be used to distinguish the type of ornament that dominates on any particular specimen. For example, tubercles often have all, or at least more than two, aspect classes visually represented (Figure 7.1). Moreover, ammonoids with strong ribs and no tubercles typically have alternating aspect classes representing the two sloping sides of each rib (Figure 7.2). Therefore, our prediction that the more tuberculate specimens would have higher OPC values was borne out in our results. A reduced major axis regression quantitatively supports a link between shell size and OPC (Figure 8). A reduced major axis regression was considered appropriate for modeling the relationship between OPC value and shell size (LMAX) since both the metrics were measured (rather than fixed values). A positive correlation (r = 0.55, p = 4.68e-05) was present between OPC value and shell size, indicating that larger specimens (with more tubercles) have higher OPC values than smaller specimens (with fewer tubercles).
 Because some ammonoids are known to show asymmetry between the left and right flanks of the shell (for example, see Yacobucci and Manship (2011) for a discussion of suture asymmetry), a comparison of the OPC values of whole shells between lefts and rights of each dimorph was conducted. In macroconchs, left H. spedeni and right H. spedeni were shown to have equal means and equal variances in OPC (df = 17; absolute t = 0.61, p = 0.55; F = 1.90, p = 0.41). However in microconchs, left H. spedeni and right H. spedeni were shown to have equal means but unequal variances in OPC (df = 18; absolute t = 2.15, p = 0.052; F = 4.55, p = 0.03). The right H. spedeni microconchs had more variable OPC values in comparison to the left H. spedeni microconchs. These differences were most likely attributable to our sampling only the best preserved sides of the best preserved specimens. We therefore concluded that pooling both left and right H. spedeni was suitable to increase the sample size for OPC analyses. Due to the small sample size of H. nebrascensis specimens, a comparison between left and right lateral shell models was not performed.
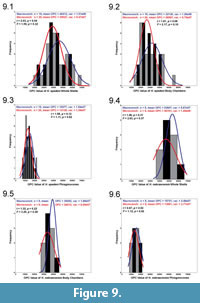 When we compared all complete macroconch and microconch specimens belonging to H. spedeni via the Student's t and F tests, statistically unequal means but equal variances were detected (df = 37; t = 2.03, p = 0.04; F = 1.59, p = 0.32). Whole H. spedeni macroconchs had statistically larger mean OPC values than the whole H. spedeni microconchs. Figure 9.1 displays a frequency histogram of OPC from both whole shell macroconchs and microconchs of H. spedeni demonstrating the overlapping variances but the higher mean OPC in the macroconchs. When the body chambers and phragmocones were assessed separately for H. spedeni, no statistically significant differences in OPC value were present (Figure 9.2-3).
These results suggest that H. spedeni dimorphs have equal spectra of variation. However, these equal ranges of variation for each dimorph have distinctly different central tendencies, in this case, reflecting different ornamental features. The similarity in the range of variation for both dimorphs of H. spedeni fits the description of Landman and Waage (1993) that both the macroconch and the microconch had complementary morphotypes, but the different means suggests that differences are present between the two dimorphs despite the similarity in their variances. The different means in the whole shells may be attributable to the inflation of the adult body chamber in the macroconchs, which provided more space for more tubercles and more ribs to form during development, hence increasing the mean OPC values. However, the lack of statistical significance for separated body chamber comparisons is in disagreement with this interpretation made from the whole shell comparisons. Slight inconsistencies between the base of the body chamber, as defined by the ultimate septum, and the decrease or cessation of flank tubercles most likely is a primary factor affecting these distributions.
The CV's for the OPC value distributions of H. spedeni dimorphs' whole shells and separated body chambers and phragmocones present similar results as those determined by the F tests (Table 1). However, we do note that in contrast to the results of the F test, the CV's of the separated body chambers of the H. spedeni macroconchs do have a larger spread of variation (CV = 34.92%) compared to microconch body chambers of this species (CV = 28.61%), suggesting more variation may be present in the body chambers of macroconchs than in those of microconchs of H. spedeni.
In all the H. nebrascensis OPC value Student's t and F test comparisons, no statistically significant differences were determined. Figure 9.4-6 shows the distributions of H. nebrascensis dimorphs. The lack of statistically significant differences between the dimorphs within this species also supports the description of Landman and Waage (1993) of this taxon having a considerably less variable morphology overall in comparison to its ancestor, H. spedeni. However, an assessment of the CV's of the whole shells, body chambers, and phragmocones between the dimorphs of H. nebrascensis reveals that macroconch body chambers exhibit the most narrow spread of variation (CV = 11.02%), with microconch body chambers (CV = 22.95%) being more comparable to H. spedeni's morphology (Table 1).
All analyses between the two species' respective dimorphs exhibited no statistically significant differences (Figure 10.1-6). Frequency histograms of these distributions demonstrate that the range of OPC values for H. spedeni and H. nebrascensis overlapped, at least with respect to their ornamentation. H. nebrascensis specimens tended to fall near the upper limits of the morphological spectrum of H. spedeni, and H. nebrascensis macroconchs appeared to have a more narrow distribution of OPC values (possibly suggesting more consistency in the distribution of ornamentation) than H. spedeni macroconchs. Although statistically significant differences in comparisons between H. spedeni and H. nebrascensis were not borne out of the Student's t and F tests, the CVs of these species and their dimorphs are reminiscent of the observations we made of the distributions on the frequency histograms (Table 1).
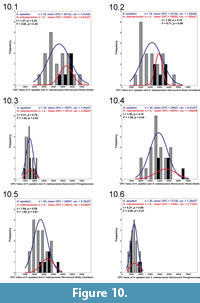 According to the Student's t and F tests, phragmocones within and between the two species and dimorphs had the most similar means and variances in all comparisons (Figure 9.3, 9.6, Figure 10.3, 10.6). These results suggest that ornament variation is highest in the macroconch body chambers of H. spedeni and may be the target for evolutionary change, while the juvenile phragmocones remained less variable with respect to ornamentation in both dimorphs. Conversely, the CVs of the phragmocones of both H. nebrascensis dimorphs reflect variances that are more widely distributed than the body chambers of H. spedeni macroconchs, with the H. nebrascensis microconch phragmocones showing the largest CV between both species and dimorphs in this study (Table 1). These contrasting results may be attributable to low sample size, especially in H. nebrascensis.
Surface-to-Planimetric Area Ratio Analysis
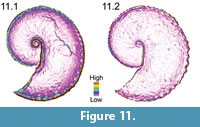
Upon visual inspection of the surface-to-planimetric area ratio rasters, we noted that this terrain roughness index is most likely not measuring aspects of flank ornamentation, but rather, it may also be capturing shell flank convexity. Shells with flatter flanks (i.e., more compressed flanks) tended to have more visually similar area ratio maps, which consisted of mostly one map classification. Conversely, specimens that had more convex flanks (i.e., more rotund flanks) tended to have various map classifications due to the curved slope of the flank near the umbilicolateral and ventrolateral shoulders (Figure 11). Exceptions to this generalization were present, however. For example, specimens that had very convex, or rotund, flanks but also very large ventrolateral tubercles appeared more compressed around the shells' shoulders.
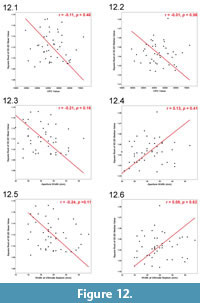
 We extracted the square root for each 3D:2D area ratio and calculated the mean and median ratio for each whole specimen. Calculating the square root for each 3D:2D area ratio was necessary for appropriate comparisons between the mean and median of this metric to other metrics, such as OPC value of whole shells, aperture widths (mm), and widths of shells at their ultimate septa (mm); the latter two shell metrics are proxies for shell compression. Neither the mean nor median area ratios correlated with the OPC values, the aperture widths or the widths of shells at their ultimate septa (Figure 12.1-6). These results suggest that the surface-to-planimetric area ratio analysis is quantifying multiple characters together, such as a combination of large ornamentation (i.e., strength of the ventrolateral tubercles) and flank convexity.
 For the representatives chosen for the Mann-Whitney U test, we predicted that the median area ratios of the separated body chambers and phragmocones would reflect their respective whole shell bins (that is, low, intermediate and high area ratio values, intended to mirror compressed, typical and rotund morphs of Landman and Waage (1993), respectively). However, that was not the case for the H. spedeni macroconchs. For the separated body chambers, the lowest median specimen was compressed, the intermediate median specimen was rotund and the highest median specimen was a typical morphotype. Conversely for the phragmocones, the lowest median specimen had a typical morphotype, the intermediate median specimen was compressed and the highest median specimen was rotund. Separated body chambers and phragmocones of the microconchs of H. spedeni did, in fact, have the lowest median for the compressed forms and the highest median for the rotund forms. These observations suggest that large changes in shell morphology occur during ontogeny, particularly in the macroconchs. The Mann-Whitney U test revealed statistically significant differences at the 95% confidence limit in median area ratios for all comparisons made. The results of these analyses imply that large changes in ornamentation and shell shape occur during body chamber formation (U* values generally differed the most in body chamber comparisons and least in phragmocone comparisons). These results are presented in Table 2.
DISCUSSION
Evolutionary Implications
The spatial analyses of "terrain" (i.e., shell) roughness explored here demonstrate visually and quantitatively that the macroconch body chamber is the target for evolutionary change between H. spedeni and subsequent H. nebrascensis. Both the macroconchs and the microconchs of H. spedeni are equally variable; however, according to the results of the OPC CV (Table 1), this species' descendant, H. nebrascensis, demonstrates a sharp reduction in the variance of its macroconchs, but not of its microconchs. Interestingly, variation in the microconch phragmocone of H. nebrascensis remains the highest (CV = 38.8%) compared to all other analyzed distributions. Possibly due to fewer constructional limitations, such as not needing an inflated body chamber that would otherwise inhibit the adaptive morphology of the species, microconchs of H. nebrascensis were able to retain the morphological variation expressed by their ancestor, H. spedeni. A larger sample size of both H. nebrascensis dimorphs is necessary to confirm whether these data are likely to represent true differences in variation or are an artifact of low sample size.
The results obtained from these GIS-based spatial analyses are consistent with the interpretation of Landman and Waage (1993) and Landman et al. (2013) that H. nebrascensis is a paedomorphic descendant of H. spedeni. Specifically, a prolonged and heightened expression of the H. spedeni phragmocone's ornamentation continuing into the development of the body chamber may have been one way in which the rotund H. spedeni morphotype originated (Figure 1.3, 1.6). This same process may have been the mechanism by which some H. spedeni ammonoids developed an even stronger tuberculate morphology to give rise to H. nebrascensis (Figure 2.1-6). While the degree to which ornamental variation is either internally (genetically) or externally (ecophenotypically) driven remains unclear, transitional specimens, such as the H. spedeni specimen described in Landman et al. (2013), can be assessed within GIS-based morphometrics to test patterns of morphological change in relation to paleoenvironmental fluctuations. The interplay between the morphogenetic expression of shell shape, tubercles, and ribs may be an important evolutionary mechanism for all Hoploscaphites species, as well as the closely related genus Discoscaphites, which has large tubercles similarly associated with ribs (Landman and Waage, 1993).
GIS as a Morphometric Tool
GIS was successful in quantifying the morphological variation of the two taxa in question. Of course, this methodology could be improved or refined for future studies. Specifically, a few problems and limitations made themselves apparent while working with the GIS-based methodology.
For example, photogrammetric software used in creating 3D digital models of the Hoploscaphites specimens appeared to give visually accurate results (Figure 3, Figure 4, Appendix), but some of the digital models had minor errors in how their lateral surfaces were reconstructed. Highly tuberculate specimens of H. spedeni had tubercles that did not appear correctly modeled. The photogrammetric software package, 123D Catch, was able to "understand" that rough surfaces were present where tubercles were observed, but slight variations in the shape of individual tubercules were often not properly represented. We hypothesize that the outer nacreous layer of these ammonoids may appear as different colors depending on the camera angle and light source, preventing the photogrammetric software from properly reconstructing the exact position of tubercles. A simple solution to avoid this problem in future studies may be to powder coat the specimens so that colors and light refractions from the nacreous layer do not affect the calculations made by the photogrammetric software.
Additionally, this same software package reconstructed a few ammonoid shells with some of the supporting cushion attached to the keel of the shell; this error only affected the lateral surface directly adjacent to ventrolateral tubercles (Appendix). A white cushion was used so that the margins of the shells could be easily seen in photographs for vector digitizing in additional 2D geospatial analysis not discussed here (Knauss, 2013a). Instead, using a black cushion or powder coating the ammonoid specimens may boost the visual contrast between the specimens and their background, allowing the photogrammetric software to distinguish differences between the shell and its immediate surrounding environment.
To test the ability of the photogrammetric software to consistently produce accurate 3D digital representations, multiple trials with different photographs should be made and the results visually compared. If access to specimens is time limited, a future researcher wanting to employ 3D geospatial analyses could merely take numerous photographs (400 or more, for example) and conduct multiple trials utilizing a smaller, random subset of the total number of photographs. This method for testing the accuracy of the photogrammetric software would be faster than performing five or more independent trials with different sets of 100 to 200 photographs per specimen. The advantages of using photogrammetry instead of employing 3D laser scanning to create 3D digital models is that photogrammetry software is free and easily accessible to most researchers (Falkingham, 2012), unlike many of the potentially expensive or restrictive methodologies described by Hoffmann et al. (2013); however, this study shows that variation in the reconstruction of complex surfaces can be problematic in some cases, and future researchers wanting to apply the methods we utilized here should compare their photogrammetrically produced 3D digital models to those produced by 3D laser scanners, micro-CT scanners, etc. (Hoffmann et al., 2013) when possible to assess precision and accuracy.
The 3D geospatial analyses used in GIS software could also be easily adjusted and refined. The TIN model exhibiting aspect had North divided into two feature classes: east of 0° and west of 0°. Using the Merge Tool within ArcGIS 10 would have combined all the North aspect polygons into one composite polygon feature class instead of only merging adjacent North aspect polygons while maintaining the true number of North patches. Computer script could be created to merge adjacent North aspect polygons of different classes into one North class while retaining the spatial identity of the patches.
Besides OPC and surface-to-planimetric area ratio analyses, which are relatively scaleless, scale-dependent 3D spatial analyses could be explored in future work to expand the GIS method as a morphometric tool. For instance, the standard deviation of elevation, slope variation and other methods to generate terrain roughness indices are all scale-dependent options available to quantify surface roughness. The website of Cooley (2013) provides an extensive list of sources on how to calculate surface ruggedness metrics using different methods in ArcGIS software.
The versatility of GIS-based methods allows for many different kinds of ammonoids and other fossil organisms with complex morphologies to be quantified and visualized through their full ontogeny. This new GIS-based technique may even allow for characters and character states previously undiscovered to be defined and coded for phylogenetic analyses. The power of geospatial analyses to address questions in paleobiology and morphology has only begun to be explored, and more researchers should investigate the potential of this technique for quantifying complex morphologies.
CONCLUSION
The 3D geospatial analyses employed here, including Orientation Patch Count (OPC) analysis and surface-to-planimetric (3D to 2D) area ratio analysis, allow for visualization and quantification of the range of ornamentation and shell compression through late ontogeny between ammonoid specimens. Our results demonstrate that these methods are sufficient for addressing paleobiological questions related to intraspecific variation and ontogeny.
According to GIS-based spatial analyses, H. nebrascensis specimens have a morphology that falls within the extremely large variation spectrum observed for H. spedeni. The target for evolutionary change between the ancestral H. spedeni and the descendant H. nebrascensis most likely resides in the macroconch body chamber as determined by this new GIS-based morphometric technique. Morphological changes, such as increased tuberculation in H. spedeni, may have resulted in the origination of H. nebrascensis.
GIS-based spatial analyses are an excellent new tool for paleontologists to exploit for morphometrics. Utilizing geospatial analysis permits researchers to quantify and visualize fossil specimens in their 3D form without the requirement of one-to-one homology that is necessary for traditional and landmark-based morphometric methods. One of the greatest advantages of using a GIS framework to analyze specimens is that complex morphologies can be studied holistically, rather than being decomposed into separate, simplifying variables. Although the techniques used in this study still require refinement, and GIS technology and spatial analyses need to be more tailored for paleontological needs overall, this study demonstrates the versatility of GIS to quantify and visualize the variation of complex forms to address paleobiological questions.
ACKNOWLEDGEMENTS
We thank P. Gorsevski, E. Gomezdelcampo and J. Haug for technical advice; S. Butts for access to specimens; and N. Landman for advice on Hoploscaphites morphology. We would also like to thank S. Gerber, K. De Baets and one anonymous reviewer for providing several insightful critiques and helpful recommendations for earlier versions of this manuscript. Funding for this research was provided by the Geological Society of America, the Paleontological Society, and the Department of Geology at Bowling Green State University.
REFERENCES
Alberch, P., Gould, S.J., Oster, G.F., and Wake, D.B. 1979. Size and shape in ontogeny and phylogeny. Paleobiology, 5:296-317.
Autodesk, Inc., 2013. Autodesk 123D Catch; www.123dapp.com/catch (accessed May 4, 2013).
Berry, J.K. 2013. Beyond Mapping III: Procedures and applications in GIS modeling. Berry & Associates, Basis Press, Fort Collins, Colorado; www.innovativegis.com/basis/MapAnalysis/Default.htm.
Bocxlaer, B.V. and Schultheiss, R. 2010. Comparison of morphometric techniques for shapes with few homologous landmarks based on machine-learning approaches to biological discrimination. Paleobiology, 36:497-515.
Bookstein, F.L. and Ward, P.D. 2013. A modified Procrustes analysis for bilaterally symmetrical outlines, with an application to microevolution in Baculites. Paleobiology, 39:214-234.
Bucher, H., Landman, N.H., Klofak, S.M., and Guex, J. 1996. Mode and rate of growth in ammonoids, p. 407-461. In Landman, N.H., Tanabe, K., and Davis, R.A. (eds.), Ammonoid Paleobiology, Volume 13: Topics in Geobiology. Plenum Press, New York.
Checa, A., Company, M., Sandoval, J., and Weitschat, W. 1996. Covariation of morphological characters in the Triassic ammonoid Czekanowskites rieberi. Lethaia, 29:225-235.
Cignoni, P., Ranzuglia, G., Callieri, M., Corsini, M., Ganovelli, F., Pietroni, N., and Tarini, M. 2011. MeshLab. Visual Computing Lab, Italian National Research Council.
Cooley, S.W. 2013. GIS 4 geomorphology: Geomorphology of mountain landscapes & upland watersheds; gis4geomorphology.com/ (accessed May 4, 2013).
Dagys, A.S. and Weitschat, W. 1993. Extensive intraspecific variation in a Triassic ammonoid from Siberia. Lethaia, 26:113-121.
Dagys, A.S., Bucher, H., and Weitschat, W. 1999. Intraspecific variation of Parasibirites kolymensis Bychkov (Ammonoidea) from the Lower Triassic (Spathian) of Arctic Asia. Mitteilungen aus dem Geologisch-Paläontologischen der Institut Universität Hamburg, 83:163-178.
De Baets, K., Klug, C., and Monet, C. 2013. Intraspecific variability through ontogeny in early ammonoids. Paleobiology, 39:75-94.
De Baets, K., Klug, C., Korn, D., and Landman, N.H. 2012. Early evolutionary trends in ammonoid embryonic development. Evolution, 66:1788-1806.
Dzik, J. 1985. Typologic versus population concepts of chronospecies: Implications for ammonite biostratigraphy. Acta Palaeontologica Polonica, 30:71-92.
Eronen, J.T., Evans, A.R., Fortelius, M., and Jernvall, J. 2009. The impact of regional climate on the evolution of mammals: A case study using fossil horses. Evolution, 64:398-408.
ESRI, Inc. 2011. ArcGIS Desktop: Release 10. Environmental Systems Research Institute, Redlands, California.
Evans, A.R., Wilson, G.P., Fortelius, M., and Jernvall, J. 2007. High-level similarity of dentitions in carnivorans and rodents. Nature, 445:78-81.
Falkingham, P. L. 2012. Acquisition of high resolution 3D models using free, open-source, photogrammetric software. Palaeontologia Electronica, 15.1,1T:15pp, 12.03MB; palaeo-electronica.org/content/93-issue-1-2012-technical-articles/92-3d-photogrammetry.
Gangopadhyay, T.K. and Bardhan, S. 2007. Ornamental polymorphism in Placenticeras kaffrarium (Ammonoidea; Upper Cretaceous of India): Evolutionary implications, p. 97-120. In Landman, N.H., Davis, R.A., and Mapes, R.H. (eds.), Cephalopods Present and Past: New Insights and Fresh Perspectives. Springer, Netherlands.
Gerber, S., Neige, P., and Eble, G.J. 2007. Combining ontogenetic and evolutionary scales of morphological disparity: a study of early Jurassic ammonites. Evolution & Development, 9:472-482.
Gould, S.J. 1977. Ontogeny and Phylogeny, The Belknap Press of Harvard University Press, Cambridge, Massachusetts.
Hammer, Ø. and Bucher, H. 2006. Generalized ammonoid hydrostatics modelling, with application to Intornites and intraspecific variation in Amaltheus. Paleontological Research, 10:91-96.
Hammer, Ø. and Harper, D.A.T. 2006. Paleontological Data Analysis. Blackwell Publishing Ltd, Oxford, United Kingdom.
Hammer, Ø., Harper, D.A.T., and Ryan, P.D. 2001. PAST: PAleontological STatistics software package for education and data analysis. Palaeontologia Electronica, 4.1.4:9pp, 178KB; palaeo-electronica.org/2001_1/past/issue1_01.htm.
Harada, K. and Tanabe, K. 2005. Paedomorphosis in Turonian (Late Cretaceous) collignoniceratine ammonite lineage from the north Pacific region. Lethaia, 38:47-57.
Hariri, K.E. and Bachnou, A. 2004. Describing ammonite shape using Fourier analysis. Journal of African Earth Sciences, 39:347-352.
Hoffmann, R., Schultz, J.A., Schellhorn, R., Rybacki, E., Keupp, H., Gerden, S.R., Lemanis, R., and Zachow, S. 2013. Non-invasive imaging methods applied to neo- and paleontological cephalopod research. Biogeosciences Discussions, 10:18803-18851.
Hohenegger, J. and Tatzreiter, F. 1992. Morphometric methods in determination on ammonite species, exemplified through Balatonites shells (Middle Triassic). Journal of Paleontology, 66:801-816.
Howarth, M.K. 1978. The stratigraphy and ammonite fauna of the Upper Lias of Northamptonshire. Bulletin of the British Museum (Natural History), 29:235-288.
Hughes, N.C. and Labandeira, C.C. 1995. The stability of species in taxonomy. Paleobiology, 21:401-403.
Jernvall, J. and Selänne, L. 1999. Laser confocal microscopy and geographic information systems in the study of dental morphology. Palaeontologia Electronica, 2.1:17pp, 906.99KB; palaeo-electronica.org/1999_1/confocal/issue1_99.htm.
Kakabadze, M.V. 2004. Intraspecific and intrageneric variabilities and their implications for the systematics of Cretaceous heteromorph ammonites; a review. Scripta Geologica, 128:17-37.
Kennedy, W.J. and Cobban, W.A. 1976. Aspects of ammonite biology, biogeography, and biostratigraphy. Special Papers in Palaeontology, 17:94.
Knauss, M.J. 2012. Quantifying morphological variability in ammonoids using GIS spatial analyses. Geological Society of America Abstracts with Programs, 44(7):442.
Knauss, M.J. 2013a. Quantifying morphological variability through the latest ontogeny of Hoploscaphites (Jeletzkytes) from the Late Cretaceous Western Interior using geographic information systems as a morphometric tool. Unpublished MS Thesis, Bowling Green State University, Bowling Green, Ohio, USA.
Knauss, M.J. 2013b. Quantifying ornamental variability in an ammonoid clade using GIS spatial analyses. Geological Society of America Abstracts with Programs, 45(7):475.
Korn, D. 2012. Quantification of ontogenetic allometry in ammonoids. Evolution and Development, 14:501-514.
Korn, D. and Klug, C. 2007. Conch form analysis, variability, morphological disparity, and mode of life of the Frasnian (Late Devonian) ammonoid Manticoceras from Coumiac (Montagne Noire, France), p. 57-85. In Landman N.H., Davis, R.A., and Mapes, R.H. (eds.), Cephalopods Present and Past: New Insights and Fresh Perspectives. Springer, Netherlands.
Korn, D. and Klug, C. 2012. Palaeozoic ammonoids – Diversity and development of conch morphology, p. 491-534. In Talent, J. (ed.), Earth and Life. Springer, Netherlands.
Korn, D., Bockwinkel, J., Ebbighausen, V., and Walton, S.A. 2013. Rare representatives in the ammonoid fauna from Büdesheim (Cephalopoda, Eifel, Late Devonian) and the role of heterochrony. Neues Jahrbuch für Geologie und Paläontologie, Abhandlungen, 269:111-124.
Landman, N.H. 1987. Ontogeny of Upper Cretaceous (Turonian-Santonian) scaphitid ammonites from the Western Interior of North America: Systematics, developmental patterns, and life history. Bulletin of the American Museum of Natural History, 185(2):117-241.
Landman, N.H. and Geyssant, J.R. 1993. Heterochrony and ecology in Jurassic and Cretaceous ammonites. Geobios, M.S., 15:247-255.
Landman, N.H. and Waage, K.M. 1993. Scaphitid ammonites of the Upper Cretaceous (Maastrichtian) Fox Hills Formation in South Dakota and Wyoming. Bulletin of the American Museum of Natural History, 215:257.
Landman, N.H., Dommergues, J.L., and Marchand, D. 1991. The complex nature of progenetic species—examples from Mesozoic ammonites. Lethaia, 24:409-421.
Landman, N. H., Kennedy, W. J., Cobban, W. A., and Larson, N. L. 2010. Scaphites of the "Nodosus Group" from the Upper Cretaceous (Campanian) of the Western Interior of North America, Bulletin of the American Museum of Natural History, 342:242.
Landman, N.H., Remin, Z., Garb, M.P., and Chamberlain Jr., J.A. 2013. Cephalopods from the Badlands National Park area, South Dakota: Reassessment of the position of the Cretaceous/Paleogene boundary. Cretaceous Research, 42:1-27.
Manship, L.L. 2004. Pattern matching: Classification of ammonitic sutures using GIS. Palaeontologia Electronica, 7.2.5A:15pp, 736KB; palaeo-electronica.org/2004_2/sutures/issue2_04.htm.
Manship, L., Strauss, R.E., and Barrick, J. 2006. Discrimination of Frasnian (Late Devonian) Palmatolepis species using multivariate analysis of platform elements. Programme & Abstracts, First International Conodont Symposium 2006 (ICOS 2006), Leicester, UK, 55.
M'Kirera, F. and Ungar, P.S. 2003. Occlusal relief changes with molar wear in Pan troglodytes troglogytes and Gorilla gorilla gorilla. American Journal of Primatology, 60:31-41.
Monnet, C. and Bucher, H. 2005. New Middle and Late Anisian (Middle Triassic) ammonoid faunas from northwestern Nevada (USA): taxonomy and biochronology. Fossils and Strata, 52:1-121.
Monnet, C., De Baets, K., and Klug, C. 2011. Parallel evolution controlled by adaptation and covariation in ammonoid cephalopods. BMC Evolutionary Biology, 11:1-21.
Monnet, C., Bucher, H., Wasmer, W., and Guex, J. 2010. Revision of the genus Acrochordiceras Hyatt, 1877 (Ammonoidea, Middle Triassic): morphology, biometry, biostratigraphy and intraspecific variability. Palaeontology, 53:961-996.
Morard, A. and Guex, J. 2003. Ontogeny and covariation in the Toarcian genus Osperlioceras (Ammonoidea). Bulletin de la Société Géologique de France, 174:607-615.
Neige, P. 1999. The use of landmarks to describe ammonite shape: Examples from the Harpoceratinae, p. 263-272. In Oloriz, F. and Rodriguez-Tovar, F.J. (eds.), Advancing Research on Living and Fossil Cephalopods. Kluwer Academic/Plenum Publishers, New York.
Nishimura, T., Maeda, H., Tanaka, G., and Ohno, T. 2010. Taxonomic evaluation of various morphological characters in the Late Cretaceous desmoceratine polyphyletic genus "Damesites" from the Yezo Group in Hokkaido and Sakhalin. Paleontological Research, 14:33-55.
Plyusnin, I., Evans, A.R., Karme, A., Gionis, A., and Jernvall, J. 2008. Automated 3D phenotype analysis using data mining. PLoS ONE 3(3):e1742.
Price, M. 2012. Mastering ArcGIS, Fifth Edition. McGraw-Hill, New York.
Rashid, H. 2010. 3-D Surface-area computation of the state of Jammu & Kashmir using Shuttle Radar Topographic Mission (SRTM) data in Geographical Information System (GIS). Journal of Geomatics, 4:77-82.
Raup, D.M. 1966. Geometric analysis of shell coiling: general problems. Journal of Paleontology, 40:1178-1190.
Raup, D.M. 1967. Geometric analysis of shell coiling: coiling in ammonoids. Journal of Paleontology, 41:43-65.
Reeside Jr., J.B. and Cobban, W.A. 1960. Studies of the Mowry Shale (Cretaceous) and Contempory Formations in the United States and Canada. United States Geological Survey Professional Paper 335.
Reyment, R.A. 2011. Morphometric analysis of polyphenism in lower Cretaceous ammonite genus Knemiceras, p. 95-109. In Elewa, A.M.T. (ed.), Computational Paleontology. Springer, Berlin Heidelberg.
Reyment, R.A. and Kennedy, W.J. 1991. Phenotypic plasticity in a Cretaceous ammonite analyzed by multivariate statistical methods: A methodological study. Evolutionary Biology, 25:411-426.
Salazar-Ciudad, I. and Marin-Riera, M. 2013. Adaptive dynamics under development-based genotype-phenotype maps. Nature, 497:361-365.
Sheffield, S.L., Zachos, L.G., and Lewis, R.D. 2012. A morphometric study of Erisocrinus (Crinoidea) using ArcGIS. Geological Society of America Abstracts with Programs, 44(7):232.
Speden, I.G. 1970. The type Fox Hills Formation, Cretaceous (Maastrichtian), South Dakota: Part 2, Systematics of the Bivalvia. Peabody Museum of Natural History Bulletin, 33:222.
Stone, J.R. 1998. Landmark-based thin-plate spline relative warp analysis on gastropod shells. Systematic Biology, 47:254-263.
Ubukata, T., Tanabe, K., Shigeta, Y., Maeda, H., and Mapes, R.H. 2008. Piggyback whorls: A new theoretical morphologic model reveals constructional linkages among morphological characters in ammonoids. Acta Palaeontologica Polonica, 53:113-128.
Ungar, P. 2004. Dental topography and diets of Australopithecus afarensis and early Homo. Journal of Human Evolution, 46:605-622.
Ungar P. and Williamson, M. 2000. Exploring the effects of toothwear on functional morphology: A preliminary study using dental topographic analysis. Palaeontologia Electronica, 3.1.1:18pp, 752KB; palaeo-electronica.org/2000_1/gorilla/issue1_00.htm.
Urdy, S., Goudemand, N., Bucher, H., and Chirat, R. 2010. Growth-dependent phenotypic variation of molluscan shells: Implications for allometric data in interpretation. Journal of Experimental Zoology Part B: Molecular and Developmental Evolution, 314B: 303-326.
Waage, K.M. 1964. Origin of repeated fossiliferous concretion layers in the Fox Hills Formation. Kansas Geological Survey Bulletin, 169:541-563.
Waage, K.M. 1968. The type Fox Hills Formation, Cretaceous (Maestrichtian), South Dakota. Part I, stratigraphy and paleoenvironments. Peabody Museum of Natural History Bulletin, 27:175.
Waggoner, K.J. and Manship, L.L. 2004. Sutural variation in ammonite ontogeny: applying GIS for paleontologic analyses. Geological Society of America Abstracts with Programs, 36(5), 442.
Weitschat, W. 2008. Intraspecific variation of Svalbardiceras spitzbergensis (Frebold) from Early Triassic (Spathian) of Spitsbergen. Polar Research, 26:292-297.
Westermann, G.E.G. 1966. Covariation and taxonomy of the Jurassic ammonite Sonninia adicra (Waagen). Neues Jahrbuch für Geologie und Paläontologie, Abhandlungen, 124:289-312.
Wilmsen, M. and Mosavinia, A. 2011. Phenotypic plasticity and taxonomy of Schloenbachia varians (J. Sowerby, 1817) (Cretaceous Ammonoidea). Palaeontologische Zeitschrift, 85:169-184.
Wilson, G.P., Evans, A.R., Corfe, I.J., Smits, P.D., Fortelius, M., and Jernvall, J. 2012. Adaptive radiation of multituberculate mammals before the extinction of dinosaurs. Nature, 483:457-460.
Yacobucci, M.M. 1999. Plasticity of developmental timing as the underlying cause of high speciation rates in ammonoids: An example from the Cenomanian Western Interior Seaway of North America, p. 59-76. In Oloriz, F. and Rodriguez-Tovar, F.J. (eds.), Advancing Research in Living and Fossil Cephalopods, Proceedings, IV International Symposium Cephalopods – Present and Past. Plenum Press, New York.
Yacobucci, M.M. 2004. Buckman's Paradox: variability and constraints on ammonoid ornament and shell shape. Lethaia, 37:57-69.
Yacobucci, M.M. 2012. Meta-analysis of character utility and phylogenetic information content in cladistic studies of ammonoids. Geobios, 45:139-143.
Yacobucci, M.M. and Manship, L.L. 2011. Ammonoid septal formation and suture asymmetry explored with a geographic information systems approach. Palaeontologia Electronica, 14.1.3A:17pp, 3.24MB; palaeo-electronica.org/2011_1/136/index.htm.
Zachos, L.G. 2012. Morphometric analysis of fossils using heads-up digitizing and geographic information system (GIS) software. Geological Society of America Abstracts with Programs, 44(4):18.
Zuccotti, L.F., Williamson, M.D., Limp, W.F., and Ugar, P.S. 1998. Modeling primate occlusal topography using geographic information systems technology. American Journal of Physical Anthropology, 107:137-142.

