

Dental measurements do not diagnose modern artiodactyl species: Implications for the systematics of Merycoidodontoidea
Article number: 21.2.23A
https://doi.org/10.26879/748
Copyright Palaeontological Association, June 2018
Author biographies
Plain-language and multi-lingual abstracts
PDF version
Submission: 22 November 2016. Acceptance: 20 April 2018
{flike id=2202}
ABSTRACT
Though dental measurements are frequently used to diagnose the fossil species of Merycoidodontoidea and other extinct artiodactyls, the effective diagnosis of modern artiodactyl taxa via dental measurements has not been extensively tested. Our study finds that variation in artiodactyl dentition is generally higher than in primates, carnivores, rodents and even elephants, with molar coefficients of variation ranging up to 18% (Camelus bactrianus), and that dental measurements poorly diagnose modern artiodactyls via discriminant function analysis, adjusted t -tests on coefficients of variation, or finite mixture analysis. The higher-than-expected coefficients of variation for artiodactyls imply that some fossil taxa may be over-split, but the low utility of dental measurements in separating sympatric species of duikers also suggests that dental measurements are not effective for fully diagnosing certain artiodactyl groups. We advocate a systematic revision of Merycoidodontoidea and many other fossil artiodactyl groups with lower emphasis on dental measurements and better accounting for the ways selenodont dentition varies.
Meaghan M. Emery-Wetherell. 400 E University Way, Department of Geological Sciences, Central Washington University, Ellensburg, Washington 98926, USA. meaghan.wetherell@gmail.com
Edward Byrd Davis. 1275 E 13th St, 100 Cascade, Department of Earth Sciences, University of Oregon, Eugene, Oregon 97403, USA; and 1680 E 15th Ave, Museum of Natural and Cultural History, University of Oregon, Eugene, Oregon 97403, USA. edavis@uoregon.edu
Keywords: quantitative variation; dental morphology; Mammalia; Artiodactyla; Merycoidodontoidea; discriminant function analysis
Final citation: Emery-Wetherell, Meaghan M. and Davis, Edward Byrd. 2018. Dental measurements do not diagnose modern artiodactyl species: Implications for the systematics of Merycoidodontoidea. Palaeontologia Electronica 21.2.23A 1-28. https://doi.org/10.26879/748
palaeo-electronica.org/content/2018/2202-dental-variation-of-artiodactyl
Copyright: June 2018 Palaeontological Association.
This is an open access article distributed under the terms of the Creative Commons Attribution License, which permits unrestricted use, distribution, and reproduction in any medium, provided the original author and source are credited.
creativecommons.org/licenses/by/4.0/
INTRODUCTION
Selenodont artiodactyls are a diverse group of mammals with a rather homogenous set of dentition: though family and even genus-level identifications can be made using dental morphology, species-level identifications of fossil artiodactyls are often made using only dental measurements (e.g., Phleger and Putnam, 1942; Gustafson, 1986; Stevens and Stevens, 2005). Measurements have some natural variance, and so defining a species requires identifying expected levels of intraspecific variation. Expected levels of dental variation in fossil artiodactyls should be guided by the variation of modern artiodactyls, but while qualitative or geographic studies of dental variation exist for a number of different artiodactyls (e.g., Robinette et al., 1957; Hewison et al., 1999; Veiberg et al., 2007; Anezaki et al., 2008; Cucchi et al., 2009; Evin et al., 2013), data or variation values are rarely reported in many of these studies. When reported, variation is often discussed in terms of geometric morphometrics, but paleosystematic revisions continue to rely heavily on simple linear measurements (e.g., Lander and Hanson, 2006; Emery et al., 2015). Therefore, fossil artiodactyl systematics may vary depending on the intraspecific variation cut-off each paleosystematist uses to define “a species.”
Simpson and Roe (1939) suggested a 10% rule of thumb for distinguishing intraspecific from interspecific variation in mammals, but also rightly pointed out that it is impossible to convincingly diagnose vertebrate species in the fossil record when the extent of osteological variation in modern species is unknown. If intraspecific variation were constant across the animal kingdom, the lack of artiodactyl-specific studies should not matter. Recent papers have explored dental variation on several extant mammalian groups, with particular emphasis on carnivores (e.g., Pengilly, 1984; Polly, 1998; Szuma, 2002; Meiri et al., 2005), elephants (e.g., Roth, 1989, 1992), primates (e.g., Gingerich and Schoeninger, 1979; Cope, 1993), and rodents (e.g., Austin and Stangl, 1995; Polly, 2003; Carrasco, 2004; Polly and Head, 2004; Caumul and Polly, 2005; Cordeiro-Estrela et al., 2006; Calede and Glusman, 2017). The abundant research on variation has made it clear that there exists a wide range of variation in mammalia, both by morphology measured and by species - one size range does not fit all groups.
 Without modern-derived parameters for normal intraspecific variation, the systematics literature for different fossil artiodactyl lineages contains many contradictions, a point exemplified by the extinct superfamily Merycoidodontoidea. Merycoidodontoidea has experienced four separate systematic revisions in the last century with results ranging from 88 to 219 diagnosable species, and up to 290 diagnosable taxa when subspecies are included (Thorpe, 1937; Schultz and Falkenbach, 1968; Lander, 1976, 1998; Ludtke, 2007; Stevens and Stevens, 2007). Such divergent systematics systems make it difficult to evaluate this group for any long-term ecological or evolutionary trend, as each system yields different estimates of diversity in different time periods (Figure 1).
To help address the differing species criteria, our study tests whether dental measurements of the kind typically used in Merycoidodontoidea systematics can diagnose between related, similarly-sized artiodactyls both with a priori knowledge of species (discriminant function analysis) and without (adjusted t -test on Coefficients of Variation and finite mixture analysis). We also compare our data to the CVs reported for oreodont species by Stevens and Stevens (2007), and test for increased CV values indicative of multiple species. Our study also tests how wear, sexual dimorphism and dental functionality influence variation in these dental measurements. We used linear regressions of wear against widths or lengths of teeth to test for the influence of wear on variation; three different distributional tests to determine whether sexual dimorphism might present a similar pattern to mixed species samples; and we evaluated the dental variation trends in these 14 species of artiodactyls with regards to trends of functional constraints in the tooth row.
ABBREVIATIONS
Museums
Museum of Comparative Zoology in Harvard (MCZ), Museum of Vertebrate Zoology at Berkeley (MVZ), Vertebrate Paleontology Laboratory at UT Austin (VPL), American Museum of Natural History (AMNH), Field Museum of Natural History (FMNH).
Terminology
Length (L), Width (W), Height (H), Coefficient of Variation (CV). Caniniform teeth include I3, P2 and C1 of camelids.
Species
Camelus bactrianus (bact), Camelus dromedarius (drom), Lama guanicoe (guan), Vicugna vicugna (vicu), Hylochoerus meinertzhageni (hylo), Muntiacus reevesi (reev), Muntiacus muntjak (munt), Philantomba monticola (phil), Cephalophus dorsalis (dors), Cephalophus weynsi (weyn), Cephalophus silvicultor (silv), Cephalophus nigrifrons (nigi), Cephalophus leucogaster (leuc), Ovis dalli (ovis).
MATERIALS
We examined the skulls of 14 different species of artiodactyls in four different families, all selected as analogues for Merycoidodontoidea (Appendix 1). We included camelids as a phylogenetic analogue (Camelus bactrianus, Camelus dromedarius, Lama guanicoe and Vicugna vicugna), several species with analogous morphological features (Muntiacus muntjak, Muntiacus reevesi, Hylochoerus meinertzhagheni, Philantomba monticola, Cephalophus dorsalis, Cephalophus leucogaster, Cephalophus nigrifrons, Cephalophus silvicultor and Cephalophus weynsi) and an additional ecological analogue (Ovis dalli). These species were also selected for maximal sample size (many species of interest had too few specimens in the museums visited to be included in a variation study). Our selection of species covers a range of body sizes with and without sexual dimorphism and includes grazers, browsers and mixed feeders. All six species of Cephalophus overlap in the central lowland forests of Africa (Turpie and Crowe, 1994) and so were also chosen as a sympatric comparative sample.
To our knowledge, paleosystemtically-applicable studies of dental variation have previously been conducted on only five different modern artiodactyl species (Vrba, 1970; Stevens and Stevens, 2005; Carranza and Pérez-Barbería, 2007; Natsume et al., 2008) and our dataset therefore quadruples the number of species with current published literature on quantitative dental variation.
METHODS
Measurements
The specimens discussed in this paper are housed at museums across the United States, and their examination was conducted over the course of the first author’s dissertation (Emery, 2016). To expedite the 10+ weeks of museum work conducted over three years and maximize potential future research, we created 3D models of specimens in Agisoft Photoscan (Agisoft, 2013). Agisoft Photoscan combines photos taken of a specimen at different angles into a single, high-resolution 3D model. We used this unconventional but useful technique instead of digital caliper measurements as a form of permanent, re-collectable data. To ensure compatibility between Photoscan and digital caliper measurements, we checked for significant differences between identical dental measurements on three specimens of Ovis aries using an F test (Zar, 1999). We used three different sets of photos for our photogrammetric models, taken over the course of a year. This is a highly conservative methods test: between improvements in photographic technique by the lead author and improvements in the software, our more recent 3D models are far better than earlier models. Different models do have different levels of accuracy, and variation in accuracy may affect our measurements. To determine whether digital calipers and 3D models were comparable, we performed t -tests in R to compare different measurements between our subsets (R Core Team, 2016). We also tested our measurement variance for significant differences from small measurements on small species, to explore whether our measurement error overwhelmed intraspecific variation in small organisms.
Mahalanobis Test of Outliers
Our sample of Camelus, Lama and Vicugna included zoo, circus and other captive-raised specimens, and most of our specimens of Camelus bactrianus were raised in captivity. Because the nutrition and health of these organisms may differ from those in the wild, it is possible they do not represent an appropriate analogue for wild organisms. We evaluated whether zoo specimens were outliers in our wild-dominated datasets using Mahalanobis distance tests in R (Rasmussen, 1988). For our anomalously zoo-heavy grouping of Camelus bactrianus, we defined outliers as non-zoo specimens to see whether wild specimens lay outside the norm for zoo specimens.
Discriminant Function Analysis
Because tooth size is correlated with body size (Janis, 1990), and dental size is highly heritable (Bader, 1965; Alvesalo and Tigerstedt, 1974), teeth are presumed adequate for making size-based species diagnoses in fossil populations - but this hypothesis assumes that morphologically similar species have distinct enough size classes for dental measurements to diagnose them. We tested these assumptions using linear and quadratic discriminant function analysis (DFA).
We ran DFA on three groups combined by a family or subfamily group that would be easily distinguished by dental morphology: camelids, Muntiacus and Cephalophinae. We excluded Hylochoerus and Ovis, as our sample only had a single species per genus and so could not be “discriminated” from other species that might be morphologically confused for them. We ran our discriminant function analyses in R using jacknife verification, which is a more robust measure for evaluating DFA success (DeGusta and Vrba, 2003; Meloro, 2011). Quadratic DFA would not run on our complete dataset because of multicollinearity issues, so we subsampled for two sets of analyses by length vs. width measurements.
Finite Mixture Analysis
Though we tested the robustness of dental material for species separation with prior knowledge of species divisions, paleontologists work on samples of unknown numbers of species. To mimic an unknown sample, we created a combined species sample of four mid-size duikers, all sympatric and co-occurring in the lowland forests of the Congo (Johnston and Anthony, 2012): Cephalophus dorsalis, C. nigrifrons, C. leucogaster and C. weynsi. We tested our multi-species samples for diagnostically different distributions using multivariate Finite Mixture Analysis. Finite Mixture Analysis determines whether data is better fit by multiple overlapping distributions instead of being composed of a single distribution (McLachlan and Peel, 2004). We used the ‘mixtools’ package in R, running a bootstrapping function that determines whether a consecutively increased number of multivariate distributions is more likely than the previous number of distributions (i.e., whether two overlapping distributions is a better fit than one distribution) (Young et al., 2015).
t-test of the Coefficient of Variation
A common method for detecting multiple species in a population is to look for unusually high coefficients of variation (CV) (e.g., Cope and Lacy, 1992; Cope, 1993; Plavcan and Cope, 2001). We used adjusted t tests to test for significant differences in CV values between multi- and single-species samples (Sokal and Braumann, 1980). We also used a CV correction factor for data that had <8 measurements, as CV underestimates in small sample sizes (Sokal and Braumann, 1980; Sokal and Rohlf, 1995).
Relationship of CV and Size
Variation is inherently linked with size - large things vary more than small things, and this variation is assumed to be proportionally related with a predicted trend of about 10% variation within species (Simpson and Roe, 1939). The advantage of CVs is their status as a unit-less measure of variation that removes the effect of size (Carrasco, 1998; Lovie, 2005). Our dataset returned significantly higher single-species CV values than we expected, causing us to suspect that CV may not perform as uniformly across size classes as expected. We used linear and nonlinear regression models in R to compare standard deviation and means for measurements across our dataset, and the Akaike Information Criterion to discern which model best fit our data (Bozdogan, 1987). If CV truly removes the effect of size, the relationship between standard deviation and mean should be linear with an intercept not significantly different from 0 (proportional variation). If CV does not completely account for the influence of size on variation, either a nonlinear model (allometric variation), or a linear model with an intercept significantly different from 0 (anisometric variation) would best model the relationship between standard deviation and mean.
Additional Causes of Variation
Given that higher variation increases the likelihood that a paleosystematist may reject a single-species hypothesis, it is also important to test whether common factors like ontogeny, sexual dimorphism, and dental functionality affect quantitative dental variation. We found considerably higher variation than expected in many of our dental measurements, and tested for two possible causes: sexual dimorphism, and age-related dental wear.
1) Sexual Dimorphism. Sexual dimorphism is an oft-cited cause for high variation in caniniform teeth (e.g., Schultz and Falkenbach, 1949; Herring, 1972; Gittleman and Van Valkenburgh, 1997), but because body size is correlated with chewing area, size dimorphism can also affect chewing teeth (Carranza and Pérez-Barbería, 2007). Our possible size-dimorphic sample was limited to those specimens with identified sex (bovid and cervid species); of these, only Ovis and Muntiacus are size dimorphic. With too few females to test for size dimorphism in Muntiacus, we only tested for size dimorphism in Ovis dalli molars. We also evaluated the caniniform teeth of our suid and camelid samples. We tested for sexual dimorphism using t -tests, where sex is known a priori, and a series of sex-unknown distribution tests to replicate tools available to paleosystematists: 1) the Shapiro-Wilk test to detect deviation from normal distributions, 2) the Hartigan's Dip test for multimodality, and 3) Finite Mixture Analysis to determine whether our data were best described by more than one normal distribution (Shapiro and Wilk, 1965; Hartigan and Hartigan, 1985; McLachlan and Peel, 2004). We used the 'mvshapiro.Test', 'dip.test' and 'mixtools' packages in R, and conducted our t -tests in R (Hartigan and Hartigan, 1985; Villasenor Alva and Estrada, 2009; Young et al., 2015). Our suid and camelid teeth had too few specimens with identified sex, limiting their usage to only distribution tests.
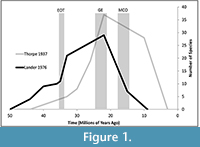
 2) Age-Related Dental Wear. Our measurements were taken on the maximal length and width of the tooth, which was typically larger at the occlusal surface than it was at the base (trapezoidal). Because artiodactyl teeth flare at the occlusal surface, progressive wear should yield progressively shorter measurements (Figure 2.2), which could add to measured variation. We used the crown height of the first molar to measure wear and compare to our other teeth because the early eruption of M1 captures the greatest potential time series of change in length and width.
Accounting for Type I Error
Most of our dataset involved large numbers of tests on different species divisions, increasing the likelihood of getting a significant p value without biological meaning (Type I error). To combat our possible Type I error rate we also report the cumulative binomial probabilities for each test, or likelihood of that number of significant tests occurring by random chance (Weintraub, 1962).
RESULTS AND DISCUSSION
Model Uncertainty and Methodology
None of our species had zoo specimens that were outliers in multivariate space from the species mean. Our Mahalanobis distance test showed that outliers were more likely to be wild-caught specimens than zoo specimens, except for in the predominantly captive sample of Camelus bactrianus, where no wild specimens were outliers. Given that there was no trend for zoo specimens to be dental outliers (or vice versa in Camelus bactrianus), we included zoo specimens with equal consideration in our study of dental traits.
The average 3D model uncertainty for skulls was 0.0155cm +/- 0.0182 cm (mean +/- standard deviation), not as low as the uncertainty reported by Mitutoyo digital calipers (.00254 cm) (Suzuki and Matsumoto 1986). Measurement variance was not significantly different between 3D model measurements and digital caliper measurements (p = 0.24), but the actual measurements were significantly different for two of 16 measurements (p < 0.5). Finding significance in two of 16 tests should happen by random chance about 19% of the time (cumulative binomial probability of 0.19), indicating that digital calipers and Photoscan measurements are comparable.
Though Photoscan measurements are comparable to digital caliper measurements, the methodological uncertainty of Photoscan measurements was sometimes larger than the measured uncertainty for several of the smaller characters of smaller duiker species. Specifically, 38 of 96 measurements had measured uncertainty that was significantly smaller (p < 0.05) than our Photoscan measurement uncertainty (cumulative binomial probability of <.001), while only 9 were less variable than our digital caliper measurement uncertainty (cumulative binomial probability of 0.05; Table 1). Small measurements were more susceptible to this phenomenon, supporting of the findings of Polly (1998), which found that the natural variation of small measurements are often overwhelmed by measurement uncertainty.
The measured variation of our small measurements is still incredibly small: the smallest premolars (Cephalophus and Philantomba) were less variable than the large premolars in our dataset (Table 1). The higher uncertainty of Agisoft Photoscan therefore does not eradicate the dental variation trends discussed in this paper, though our CV values should be considered maximum CVs for our smallest measurements.
Discriminant Function Analysis
The percentage of specimens correctly classified by dental measurements (Table 2) ranged from <15% (Camelus bactrianus, Muntiacus reevesi and Cephalophus weynsi) up to 100% (Cephalophus silvicultor and Philantomba monticola). Overall classification rates within family ranged from 52% to 82% accuracy (Table 2). Species with dramatic size differences had overall higher classification accuracy: for example, Cephalophus silvicultor, part of the lineage of giant duikers (50 kg), was easy to distinguish dentally from the dwarf duiker Philantomba monticola of around 5 kg (Prins and Reitsma, 1989).
t-Tests for Significant Differences in Coefficients of Variation
Given the high variation in our artiodactyl samples, how likely is it a paleontologist would reject a single-species hypothesis for a sample of similarly variable dental material using CVs? For the sample of combined Cephalophus species, only one measurement came up as significant when compared to a single species sample - the row length of the premolars, and only when compared to Cephalophus weynsi (Table 3). When compared to the CV size of the other three duiker species, or of the two peccary species, the premolar CV of the combined Cephalophus sample was not larger than expected from a single-species sample. In this case, the CVs of dental measurements alone were not adequate to detect the presence of a lumped sample of four species.
When the oreodont sample is compared to single species of Cephalophus weynsi, two measurements showed up as being statistically significant: the premolars, when compared to Cephalophus weynsi, and the full toothrow when compared to Cephalophus weynsi or Cephalophus nigrifrons. Neither C. dorsalis nor C. leucogaster had any significantly different CV values, and CVs for the two peccary species evaluated by Stevens and Stevens (2005) also are not statistically different. The statistical determination of a multispecies sample of Miniochoerus species therefore relies entirely upon the species it was compared to. Had Stevens and Stevens (2005) compared their samples to Cephalophus weynsi they would have had excellent reason to reject a single-species hypothesis with two of five measurements being statistically significant (cumulative binomial probability of.02); with the single significant result of Cephalophus nigrifrons (cumulative binomial probability of.23) they would have less reason to reject a single-species hypothesis, and with Cephalophus leucogaster, C. dorsalis or either peccary species there would be no statistical reason to suspect a multi-species sample. Yet while choosing an appropriate analogue for comparison is important, our combined duiker sample was not signifcantly different from single-species samples. Therefore, multiple species of similar sizes are possible within a low-CV sample - simply having a non-significant variation difference does not guarantee that a sample does not contain multiple species.
Finite Mixture Analysis of Multi-Species Sample
We conducted a finite mixture analysis on the same multi-species sample used for the adjusted t- test on CVs conducted above. The finite mixture analysis also failed to reject the null hypothesis of a single distribution (p>.05). The failure of both the t- test and the mixture analysis to identify multiple species may relate to two different causes: 1) biological species are defined with such increased precision that paleontological species are not comparable, and 2) that species do not always diverge in size as well as morphology (or at least, not enough to test without a much larger sample size). Considering that only rarely do paleontological species samples contain in the tens of skulls with full dentition (oreodonts being a rare exception), it is likely that the distinction does not matter: dental measurements are not always sufficient to detect co-existing paleontological species.
Extent and Pattern of Variation
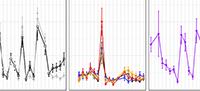
Coefficients of variation ranged from very low (3-4%) to very high (58%). The most variable were caniniform teeth (canines, and P2 and I3 in camelids), but molars were also more variable than the no-larger-than-10% intraspecies rule of thumb suggested by Simpson and Roe (1939) or the variation reported in primates and carnivores (Gingerich and Schoeninger, 1979; Gingerich and Winkler, 1979). In fact, many molar CV values were even higher than several dental measurements of elephants, which were previously presumed to be the uppermost limit of natural dental variation (Roth, 1992).
 For primates, the least variable dental measurement is the length of M1 (Cope, 1993). Primate dental variation is higher in the premolars, and increases posteriorly in the molar row - possibly as a result of functional constraints, and possibly as a result of greater sexual dimorphism expressed in posterior teeth, which develop after the animal reaches puberty (Gingerich and Schoeninger, 1979; Plavcan and Cope, 2001). This pattern is similar in carnivores, with a greater emphasis on dental functionality minimizing variation: carnassial teeth, which must properly occlude, have the lowest variance in the tooth row (Gingerich and Winkler, 1979; Pengilly, 1984).
This pattern was starkly different in our sample, where the least variable dental measurements were the width of M1 and the length of M3 (Figure 3).
Variation was highest in the premolars, but decreased posteriorly in each functional unit. In artiodactyls, premolars are far anterior of the maximal force produced during chewing and may have fewer functional constraints (Greaves, 1978). This lowered functionality is also seen in qualitative variations: artiodactyl premolars are often subject to rotation, absence or replication in the tooth row (Miles and Grigson, 2003).
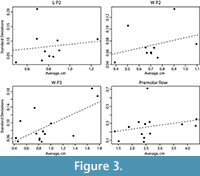
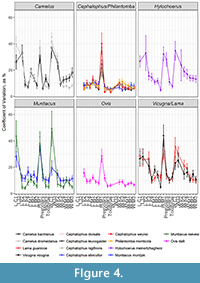 Duikers were an exception to the artiodactyl variation pattern. Duiker variation was overall much lower and unchanged throughout the toothrow: the premolars of duikers were no more variable than their molars (Figure 4). The low variation of duiker teeth runs contrary to the elevation effect expected by measurement error for teeth of this size; smaller measurements should have higher CVs, but the smallest teeth in our sample still had the smallest CVs, suggesting that the overall character stability of duiker dentition is a trait rather than a methodological artifact.
Influence of Age-Related Wear on Dental Variation
Though duiker variation was low, the variation in other species was much higher (Table 2). A possible explanation for such high variation in artiodactyl teeth is the influence of wear on tooth dimensions. Our sample had significant correlation between height and length of M1 for most species (Table 4). Eleven of 17 regressions had slopes significantly different from zero (each with p < 0.05), and all regressions had intercepts significantly different from zero (Table 4). The correlation between length of the molars and M1 height (our age proxy) was stronger in the anterior of the molar row than in the posterior (M1 H and M1 L were more correlated than M1 H and M3 L). This trend was reversed when compared to molar widths: there were more significant correlations between M1 H and M3 W than there were between M1 H and M1 W, and there were higher R2 values for correlations in the posterior of the molar row (Table 4).
The relationship between height and length is particularly strong in M1, possibly because of the higher degree of size correlation when comparing the height of a tooth to the length of the same tooth, and possibly because of the longer preserved wear sequence across all individuals. The morphology of M1 is also a possible cause for correlation: M1 is visibly flared anteroposteriorally at the occlusal surface in many artiodactyl species, far more so than M2 or M3, and may lose more length through wear than the other teeth.
The reasons for this extreme flare of M1 are not clear. In Camelus, M1 bears the brunt of the chewing force (Greaves, 1978); as the first molar to erupt it also carries nearly the entirety of the chewing force for the first several years of the animal's life. Camelus may benefit from having a longer M1 before the rest of the tooth row erupts. The decreasing length of M1 through wear may be a spandrel, or perhaps creates accommodation space for the other teeth as they erupt. Tooth impaction can occur from a lack of accommodation space in the tooth row, and can lead to abscesses, displacement, and bone infection (Forsberg, 1988; Dixon, 2006); having a smaller M1 as the tooth wears could minimize risk of impaction of M2.
Width measurements tell a different story. The correlation between height of M1 and width of different molars is negative: older teeth are wider teeth. This may be a result of cryptic eruption: if a tooth appeared fully erupted but wasn't, we would have underestimated the width. It is possible that increased surface area through wear is of benefit in M3 as the tooth is retained into senescence, or that a smaller initial occlusal surface could help to avoid impaction. If so, it is likely that there is a pattern in artiodactyl teeth between eruption timing and morphology: teeth that erupt in rapid sequence early in an animal's lifespan would be straight rather than trapezoidal, while teeth that erupt more slowly should have trapezoidal lengths for accommodation space or reverse trapezoidal widths to retain occlusal area through tooth wear in the posterior of the tooth row.
Sexual Dimorphism
Another possible reason for high variation in artiodactyl dentition is the presence of sexual size dimorphism. Our t -tests for sexual dimorphism in Ovis dalli were significant for M1 L, but not for any other measurement (Table 5). Our Shapiro-Wilk tests were not significant, indicating no deviation from normality in Ovis dalli molars, though the p value for M1 L did approach significance (p = 0.08, Table 5). Our Hartigan's Dip test was also not significant for any variable, indicating no significant deviation from unimodality in the molar measurements of Ovis dalli (Table 5). Finally, our mixture analysis could not reject the null, single distribution hypothesis for any of our univariate molar measurements in Ovis dalli (Table 5).
Similarly, several of our caniniform values had significant Shapiro-Wilk results, but none showed signs of multimodality according to Hartigan's Dip test (Table 6). Finite Mixture analysis rejected the null hypothesis of a single distribution for the lengths and widths of C1 for Camelus dromedarius, but did not reject the null hypothesis for any other caniniform measurements, including multivariate analyses of multiple measurements. None of our data were significantly likely to have more than a single distribution present.
These results do not rule out the presence of sexual dimorphism in these species, as sexual dimorphism in body size is not always isometrically correlated with tooth dimensions; male artiodactyl teeth can be smaller than anticipated given skull size (Carranza and Pérez-Barbería, 2007), which may increase the difficulty of separating groups by sex using only their teeth. Difference in lifespan is also a complicating factor: because female artiodactyls live longer than males, there may be a longer female tail to the distribution that could exacerbate non-detection of dimorphism (Carranza and Pérez-Barbería, 2007). In this case, there was no significant difference when male and female M1 heights were evaluated with a t -test (p = 0.15), but this difference in age distributions may be a problem in other samples. Sexual dimorphism should not be excluded as a possible source of variation for dental measurements, but it may be difficult to support the hypothesis of sexual dimorphism over a multispecies hypothesis when analysing dentition other than the canines.
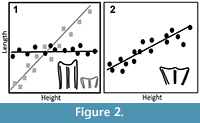
Relationship Between Size and Coefficients of Variation
For most measurements, the relationship between standard deviation and mean was proportional and best described by a linear relationship with a zero intercept (Table 7). M1 L, M2 L, M3 T and length of the molar row all had intercepts that were significantly different from zero (Table 7). We also found that four of our characters had slopes that were significantly different from 0.10 (or, different from the rule-of thumb coefficient of variation of 10%), as did the slope of all our measurements combined and all caniniform teeth together. P2 L, P2 W and the length of the premolar row all had slopes that were not significant from zero, indicating no linear relationship between standard deviation and size (Figure 3). While the relationship between standard deviation and mean was explained well in several measurements by nonlinear relationships, there was not a significant improvement in fit (Table 7). Four of our measurements show non-proportional relationships between standard deviation and mean, and three show no relationship at all (slope not significantly different from 0), meaning that in 7 of 19 measurements CV does not evenly remove the effect of size on this distribution of variance. These results contain a higher number of significant values than would be expected by random chance (cumulative binomial probability of <0.001). When we excluded camels, we found that the anisometric relationship disappeared for M1 L and AP M2 (Table 8). Anisometry was still present in the molar row and width of M3 with or without camels.
The non-proportional relationships between standard deviation and mean is contrary to the correlation predicted by Simpson and Roe (1939), who suggested that larger measurements and larger animals should have proportionally larger standard deviations. Polly (1998) found that measurement error caused inflated CVs for small measurements and suggested these may drive non-isometric relationships between standard deviation and mean. Indeed, smaller measurements in our data show little to no linear relationship between standard deviation and mean (Figure 4); possibly the influence of measurement error overwhelms any linear trend (Polly 1998). However, our results agree with the suggestion by Davis and Calède (2012) that large endmembers are responsible for some of the non-proportionality in CVs. Our measurements were, on the whole, much larger than those conducted by Polly (1998). It seems that CV poorly accounts for size in endmembers: for small measurements, CVs are larger than predicted because of measurement error; yet for large measurements, CVs are larger than anticipated by a purely isometric relationship between standard deviation and mean. In either case, the expectation of the 10% rule of thumb simply does not hold. In our dataset non-proportionality has manifested in linear relationships with non-zero intercepts, or no significant slopes; in larger datasets that showed inflation in both large and small measurements with significantly lower values in the middle, this should result in a nonlinear relationship between standard deviation and mean.
Importantly, when we subsampled our data to remove the two largest endmembers (Camelus species), our trends for the lengths of M1 and M2 became isometric again. Further research should be conducted with additional large ungulates to see whether our anisometric trend is truly size-bias in CV, or results from phylogenetic influence on morphology and variation in our particular sample.
Regardless of the cause for anisometry between standard deviation and mean, this pattern has strong implications for the use of the CV in systematics studies. CVs are simple statistics that are easily compared between species, but our data suggest that they should not be compared between measurements of considerably different size classes or phylogenetic groups.
CONCLUSION
Dental measurements in artiodactyls are not always sufficient for identification at the species level, whether species is known a priori or not. Artiodactyl dentition is more variable than that of carnivores, primates, rodents and in several cases even elephants. Artiodactyl dental variation follows a different variation pattern than in carnivores or primates, with the width of M3 and the length of M1 as the most variable molar measurements. Artiodactyl premolars are highly variable, which may result from a decrease in functional constraints in the anterior of the chewing battery. Premolars are also prone to rotation, replication and absence, which makes premolar rows more variable than either molar rows or overall tooth-row lengths.
With the exception of duikers, selenodont molars show measurement changes through wear, and this should be considered when selecting analogous taxa for comparisons to fossil populations. Canines and caniniform teeth often show signs of sexual dimorphism, but this signal may be difficult to detect without a priori knowledge of sex. Molariform teeth can also show signs of sexual dimorphism related to sexually dimorphic body sizes, but this signal may be less than expected and also may be undetectable because of the obscuring trend of female senescence. We found that distribution tests were unable to detect the presence of two sexes, and it is quite likely that sexually dimorphic traits will not be detectable using statistical techniques.
When selecting a modern analogue for a comparative sample for a paleontological study, it is important to select an analogue that is morphologically similar but also similar in size as our research shows that CV may not perfectly adjust for size differences between different taxa. Though variable within species, artiodactyl dental measurements are often conserved between species and do not always diagnose taxa via DFA or demonstrate multi-species groups via CV t -tests or mixture analysis. Dentition may be generally too conservative to oft-reveal multispecies samples of artiodactyls.
ACKNOWLEDGEMENTS
This work was funded by a Field Museum Research Grant from the Field Museum of Natural History in Chicago, a Theodore Roosevelt Grant from the American Museum of Natural History, an Ernst Mayer Grant from Harvard University and a Thomas Condon and a Smith Scholarship from the University of Oregon. B. McHorse (Harvard) took additional Hylochoerus pictures. M. Fonstad (UO) introduced us to Photoscan after J. Roering (UO) suggested it. Access to collections was given by J. Chupasko (MCZ), R. Banasiak (FMNH), E. Westwig (AMNH), C. Sagabiel (VPL) and C. Conroy (MVZ). D. Polly (Indiana) and an anonymous reviewer contributed valuable edits through peer review. B. McHorse (Harvard), I. Burke, M. Ball (UO), K. Burns, and David, Becky, Leo and Isaac Houts provided much-needed housing during museum travels. S. Hopkins (UO), D. Warrick (OSU), S. Frost (UO), and J. Roering (UO) gave important feedback on this research during the lead author’s dissertation.
REFERENCES
Agisoft, L.L.C. 2013. Agisoft PhotoScan User Manual. Professional edition, version 0.9.0.
Alvesalo, L. and Tigerstedt, P.M.A. 1974. Heritabilities of human tooth dimensions. Hereditas 77:311-318. https://doi.org/10.1111/j.1601-5223.1974.tb00943.x
Anezaki, T., Yamazaki, K., Hongo, H., and Sugawara, H. 2008. Chronospatial variation of dental size of Holocene Japanese wild pigs (Sus scrofa leucomystax). Quaternary Research 47:29-38. https://doi.org/10.4116/jaqua.47.29
Austin, T.A. and Stangl, F.B. 1995. Variation in the deciduous dentition of pocket mice (Heteromyidae: Perognathus and Chaetodipus). The Southwestern Naturalist 104-107. http://www.jstor.org/stable/30054401
Bader, R.S. 1965. Heritability of dental characters in the house mouse. Evolution 378-384. https://doi.org/10.1111/j.1558-5646.1965.tb01729.x
Bozdogan, H. 1987. Model selection and Akaike’s information criterion (AIC): The general theory and its analytical extensions. Psychometrika 52:345-370. https://doi.org/10.1007/BF02294361
Calede, J.J.M. and Glusman, J.W. 2017. Geometric morphometric analyses of worn cheek teeth help identify extant and extinct gophers (Rodentia, Geomyidae). Palaeontology, 60: 281-307. https://doi.org/10.1111/pala.12285
Carranza, J. and Pérez-Barbería, F.J. 2007. Sexual selection and senescence: male size-dimorphic ungulates evolved relatively smaller molars than females. The American Naturalist 170:370-380. https://doi.org/10.1086/519852
Carrasco, M.A. 1998. Variation and its implications in a population of Cupidinimus (Heteromyidae) from Hepburn’s Mesa, Montana. Journal of Vertebrate Paleontology 18:391-402. https://doi.org/10.1080/02724634.1998.10011067
Carrasco, M.A. 2004. Chapter 9: Assessing statistical techniques for detecting multispecies samples of heteromyids in the fossil record: a test using extant Dipodomys. Bulletin of the American Museum of Natural History, 285:120-129. https://doi.org/10.1206/0003-0090(2004)285<0120:C>2.0.CO;2
Caumul, R., and P.D. Polly. 2005. Phylogenetic and environmental components of morphological variation: skull, mandible, and molar shape in marmots (Marmota, Rodentia). Evolution, 59: 2460-2472. https://doi.org/10.1644/05-MAMM-A-293R3.1
Cope, D.A. 1993. Measures of dental variation as indicators of multiple taxa in samples of sympatric Cercopithecus species, p. 211-237. Species, Species Concepts and Primate Evolution. Springer. https://doi.org/10.1007/978-1-4899-3745-2_9
Cope, D.A. and Lacy, M.G. 1992. Falsification of a single species hypothesis using the coefficient of variation: a simulation approach. American Journal of Physical Anthropology 89:359-378. https://doi.org/10.1002/ajpa.1330890309
Cordeiro-Estrela, P., Baylac, M., Denys, C. and Marinho-Filho, J. 2006. Interspecific patterns of skull variation between sympatric Brazilian vesper mice: geometric morphometrics assessment. Journal of Mammalogy, 87: 1270-1279. https://doi.org/10.1644/05-MAMM-A-293R3.1s
Cucchi, T., Fujita M. and Dobney, K. 2009. New insights into pig taxonomy, domestication and human dispersal in Island South East Asia: molar shape analysis of Sus remains from Niah Caves, Sarawak. International Journal of Osteoarchaeology, 19: 508-530. https://doi.org/10.1002/oa.974
Davis, E.B. and Calède, J.J.-M. 2012. Extending the utility of artiodactyl postcrania for species-level identifications using multivariate morphometric analyses. Palaeontologia Electronica 15:1A.
palaeo-electronica.org/content/2012-issue-1-articles/68-artiodactyl-postcrania
DeGusta, D. and Vrba, E. 2003. A method for inferring paleohabitats from the functional morphology of bovid astragali. Journal of Archaeological Science 30:1009-1022. https://doi.org/10.1016/S0305-4403(02)00286-8
Dixon, P.M. 2006. Cheek teeth diastemata and impactions, p. Proceedings of the AAEP/BEVA Dental focus meeting. Retrieved September 7, 2015. https://researchoutput.csu.edu.au/files/9708963/30339_Hughes_49th_British_Equine_Veterinary_Association_Congress,_2010[1].pdf
Emery, M.M., Davis, E.B., and Hopkins, S.S. 2016. Systematic reassessment of an agriochoerid oreodont from the Hancock Mammal Quarry, Clarno (Eocene, Duchesnean), Oregon. Journal of Vertebrate Paleontology. 36:2. https://doi.org/10.1080/02724634.2015.1041970
Emery, M.M. 2016. Assessment of Character Variation in the Crania and Teeth of Modern Artiodactyls for Better Species Diagnosis in the Fossil Record. Unpublished PhD Thesis. University of Oregon - Eugene, Oregon, USA.
Evin, A., Cucchi, T., Cardini, A., Strand Vidarsdottir, U., Larson, G. and Dobney, K. 2013. The long and winding road: identifying pig domestication through molar size and shape. Journal of Archaeological Science, 40: 735-743. https://doi.org/10.1016/j.jas.2012.08.005
Forsberg, C.M. 1988. Tooth size, spacing, and crowding in relation to eruption or impaction of third molars. American Journal of Orthodontics and Dentofacial Orthopedics 94:57-62. https://doi.org/10.1016/0889-5406(88)90451-9
Gingerich, P.D. and Schoeninger, M.J. 1979. Patterns of tooth size variability in the dentition of primates. American Journal of Physical Anthropology 51:457-465. https://doi.org/10.1002/ajpa.1330510318
Gingerich, P.D. and Winkler, D.A. 1979. Patterns of variation and correlation in the dentition of the red fox, Vulpes vulpes. Journal of Mammalogy 60:691-704. https://doi.org/10.2307/1380186
Gittleman, J.L. and Van Valkenburgh, B. 1997. Sexual dimorphism in the canines and skulls of carnivores: effects of size, phylogency, and behavioural ecology. Journal of Zoology 242:97-117. https://doi.org/10.1111/j.1469-7998.1997.tb02932.x
Greaves, W.S. 1978. The jaw lever system in ungulates: a new model. Journal of Zoology 184:271-285. https://doi.org/10.1111/j.1469-7998.1978.tb03282.x
Gustafson, E.P. 1986. Preliminary biostratigraphy of the White River Group (Oligocene, Chadron and Brule Formations) in the vicinity of Chadron, Nebraska. Transactions of the Nebraska Academy of Sciences and Affiliated Societies XIV. http://digitalcommons.unl.edu/tnas/209/
Hartigan, J.A. and Hartigan, P.M. 1985. The dip test of unimodality. The Annals of Statistics 70-84. http://www.jstor.org/stable/2241144
Herring, S.W. 1972. The role of canine morphology in the evolutionary divergence of pigs and peccaries. Journal of Mammalogy 53:500-512. https://doi.org/10.2307/1379040
Hewison, A.J.M., Vincent, J.P., Angibault, J.M., Delorme, D., Laere, G.V., and Gaillard, J.M. 1999. Tests of estimation of age from tooth wear on roe deer of known age: variation within and among populations. Canadian Journal of Zoology 77:58-67. https://doi.org/10.1139/z98-183
Janis, C.M. 1990. Correlation of cranial and dental variables with body size in ungulates and macropodoids. p 255-299. In Damuth, J. and MacFadden, B.J. (eds.), Body Size in Mammalian Paleobiology. Estimation and Biological Implications. Cambridge University Press, New York.
Johnston, A.R. and Anthony, N.M. 2012. A multi-locus species phylogeny of African forest duikers in the subfamily Cephalophinae: evidence for a recent radiation in the Pleistocene. BMC Evolutionary Biology 12:1. https://doi.org/10.1186/1471-2148-12-120
Lander, E.B. 1976. A Review of the Oreodonta (Mammalia, Artiodactyla), Parts I, II, and III. Unpublished PhD Thesis, University of California, Berkeley - Berkeley, California, USA.
Lander, E.B. 1998. Oreodontoidea, p. 402-430 in Janis, C.M., Scott K.M., and Jacobs, L.L. (ed.), Evolution of Tertiary Mammals of North America: Terrestrial carnivores, ungulates, and ungulate-like mammals. Cambridge University Press, Cambridge, UK; New York.
Lander, E.B. and Hanson, C.B. 2006. Agriochoerus matthewi crassus (Artiodactyla, Agriochoeridae) of the late middle Eocene Hancock Mammal Quarry Local Fauna, Clarno Formation, John Day Basin, north-central Oregon. PaleoBios 26:19-34.
Lovie, P. 2005. Coefficient of variation. Encyclopedia of Statistics in Behavioral Science. John Wiley & Sons, Hoboken N.J.
Ludtke, J.A. 2007. Family Agriochoeridae, p. 169-176. In Prothero, D.R. and Foss, S.E. (eds.), The Evolution of Artiodactyls. Johns Hopkins University Press, Baltimore.
McLachlan, G. and Peel, D. 2004. Finite Mixture Models. John Wiley & Sons.
Meiri, S., Dayan, T., and Simberloff, D. 2005. Variability and correlations in carnivore crania and dentition. Functional Ecology 19:337-343. https://doi.org/10.1111/j.1365-2435.2005.00964.x
Meloro, C. 2011. Feeding habits of Plio-Pleistocene large carnivores as revealed by the mandibular geometry. Journal of Vertebrate Paleontology 31:428-446. https://doi.org/10.1080/02724634.2011.550357
Miles, A.E.W. and Grigson, C. 2003. Colyer’s Variations and Diseases of the Teeth of Animals. Cambridge University Press.
Natsume, A., Koyasu, K., Oda, S., Nakagaki, H., Kawai, T., and Hanamura, H. 2008. Tooth size variability and relevance of numerical variation in the Japanese serow. Archives of Oral Biology 53:95-98. https://doi.org/10.1016/j.archoralbio.2007.07.013
Pengilly, D. 1984. Developmental versus functional explanations for patterns of variability and correlation in the dentitions of foxes. Journal of Mammalogy 65:34-43. https://doi.org/10.2307/1381197
Phleger, F.B. and Putnam, W.S. 1942. Analysis of Merycoidodon skulls. American Journal of Science 240:547-566.
Plavcan, J.M. and Cope, D.A. 2001. Metric variation and species recognition in the fossil record. Evolutionary Anthropology: Issues, News, and Reviews 10:204-222. https://doi.org/10.1002/evan.20001
Polly, P.D. 2003. Paleophylogeography: the tempo of geographic differentiation in marmots (Marmota). Journal of Mammalogy, 84: 369-384. https://doi.org/10.1644/1545-1542(2003)084<0369:PTTOGD>2.0.CO;2
Polly, P.D. 1998. Variability in mammalian dentitions: size-related bias in the coefficient of variation. Biological Journal of the Linnean Society 64:83-99. https://doi.org/10.1111/j.1095-8312.1998.tb01535.x
Polly, P.D. and Head, J.J. 2004. Maximum-likelihood identification of fossils: taxonomic identification of Quaternary marmots (Rodentia, Mammalia) and identification of vertebral position in the pipesnake Cylindrophis (Serpentes, Reptilia), p. 197-221. In Elewa, A.M.T. (ed.), Morphometrics. Springer, Berlin, Heidelberg.
Prins, H.H.T. and Reitsma, J.M. 1989. Mammalian biomass in an African equatorial rain forest. The Journal of Animal Ecology 851-861. http://www.jstor.org/stable/5128
R Core Team. 2016. R: A Language and Environment for Statistical Computing. R Foundation for Statistical Computing, Vienna, Austria.
Rasmussen, J.L. 1988. Evaluating outlier identification tests: Mahalanobis D squared and Comrey Dk. Multivariate Behavioral Research 23:189-202. https://doi.org/10.1207/s15327906mbr2302_4
Robinette, W.L., Jones, D.A., Rogers, G., and Gashwiler, J.S. 1957. Notes on tooth development and wear for Rocky Mountain mule deer. The Journal of Wildlife Management 21:134-153. http://www.jstor.org/stable/3797579
Roth, V.L. 1989. Fabricational noise in elephant dentitions. Paleobiology 15:165-179. https://doi.org/10.1017/S0094837300009349
Roth, V.L. 1992. Quantitative variation in elephant dentitions: implications for the delimitation of fossil species. Paleobiology 18:184-202. https://doi.org/10.1017/S0094837300013968
Schultz, C.B. and Falkenbach, C.H. 1949. Promerycochoerinae, a new subfamily of oreodonts. Bulletin of the AMNH; v. 93, article 3. http://hdl.handle.net/2246/405
Schultz, C.B. and Falkenbach, C.H. 1968. The phylogeny of the oreodonts. Bulletin of the AMNH; v. 139. http://hdl.handle.net/2246/1992
Shapiro, S.S. and Wilk, M.B. 1965. An analysis of variance test for normality (complete samples). Biometrika 591-611. http://doi.org/10.2307/2333709
Simpson, G.G. and Roe, A. 1939. Quantitative Zoology: Numerical Concepts and Methods in the Study of Recent and Fossil Animals. Dover Publications, Inc.
Sokal, R.R. and Braumann, C.A. 1980. Significance tests for coefficients of variation and variability profiles. Systematic Zoology 50-66. https://doi.org/10.1093/sysbio/29.1.50
Sokal, R.R. and Rohlf, F.J. 1995. Biometry. 3rd ed. Freeman, New York.
Stevens, M.S. and Stevens, J.B. 2005. Merycoidodontinae and Miniochoerinae, p. 498–573. In Prothero, D. (ed.), The Terrestrial Eocene-Oligocene Transition in North America. Cambridge University Press, Cambridge, UK; New York.
Stevens, M.S. and Stevens, J.B. 2007. Family Merycoidodontidae, p. 157-168. In Prothero, D. (ed.), The Evolution of Artiodactyls. Johns Hopkins University Press, Baltimore.
Strömberg, C.A. 2011. Evolution of grasses and grassland ecosystems. Annual Review of Earth and Planetary Sciences 39:517-544. https://doi.org/10.1146/annurev-earth-040809-152402
Suzuki, M. and Matsumoto, T. 1986. Digital Indication Type Measuring Apparatus. Google Patents. Retrieved November 18, 2015, from https://www.google.com/patents/US4612656.
Szuma, E. 2002. Dental polymorphism in a population of the red fox (Vulpes vulpes) from Poland. Journal of Zoology 256:243-253. https://doi.org/10.1017/S0952836902000286
Thorpe, M.R. 1937. The Merycoidodontidae, an extinct group of ruminant mammals. Peabody Museum of Natural History III:4. New Haven, Connecticut. https://doi.org/10.5962/bhl.title.10230
Turpie, J. and Crowe, T.M. 1994. Patterns of distribution, diversity and endemism of larger African mammals. South African Journal of Zoology 29:19-33. http://hdl.handle.net/10520/AJA00445096_718
Veiberg, V., Mysterud, A., Gaillard, J.-M., Delorme, D., Van Laere, G., and Klein, F. 2007. Bigger teeth for longer life? Longevity and molar height in two roe deer populations. Biology Letters 3:268-270. https://doi.org/10.1098/rsbl.2006.0610
Villasenor Alva, J.A. and Estrada, E.G. 2009. A generalization of Shapiro-Wilk’s test for multivariate normality. Communications in Statistics--Theory and Methods 38:1870-1883. https://doi.org/10.1080/03610920802474465
Vrba, E.S. 1970. Evaluation of Springbok-like fossils: Measurement and statistical treatment of the teeth of the springbok, Antidorcas marsupialus marsupialus Zimmerman (Artiodactyla: Bovidae). Annals of the Transvaal Museum 26:285-299. http://hdl.handle.net/10520/AJA00411752_286
Weintraub, S. 1962. Cumulative Binomial Probabilities. Journal of the ACM (JACM) 9:405-407.
Young, D., Benaglia, T., Chauveau, D., Hunter, D., Elmore, R., Hettmansperger, T., Thomas, H., and Huan, F. 2015. Mixtools: “Tools for Analyzing Finite Mixture Models.” Version 1.1.0.
Zachos, J., Pagani, M., Sloan, L., Thomas, E., and Billups, K. 2001. Trends, rhythms, and aberrations in global climate 65 Ma to present. Science 292:686-693. https://doi.org/10.1126/science.1059412
Zar, J.H. 1999. Biostatistical Analysis 4th ed. Pearson Education India, New Jersey.
