

Volume 28.2
May–August 2025
Full table of contents
ISSN: 1094-8074, web version;
1935-3952, print version
Recent Research Articles
See all articles in 28.2 May-August 2025
See all articles in 28.1 January-April 2025
See all articles in 27.3 September-December 2024
See all articles in 27.2 May-August 2024
Interested in submitting a paper to Palaeontologia Electronica?
Click here to register and submit.
 |
||||
 |
||||
Article Search
 Neil Brocklehurst. Museum für Naturkunde, Leibniz-Institut für Evolutions- und Biodiversitätsforschung, Invalidenstraße 43, 10115 Berlin, Germany, neil.brocklehurst@mfn-berlin.de
Neil Brocklehurst is a postdoctoral researcher at the Museum für Naturkunde, Berlin. He is a Vertebrate Palaeontologist, primarily interested in the earliest evolution of terrestrial vertebrates during the late Palaeozoic. He completed his MSci degree in Palaeobiology at University College London, and undertook a PhD at the Museum für Naturkunde and the Humboldt-Universität zu Berlin. During this time he has carried out research into the completeness of the fossil record and the methods used to examine changes in species richness, origination and extinction rates, and diversification.
FIGURE 1. An illustration of the taphonomic filter in the simulation, shown applied to a single taxon in a single time bin. The taxon is originally present in every locality in each region it occupies, but the taphonomic filter removes it from randomly selected localities
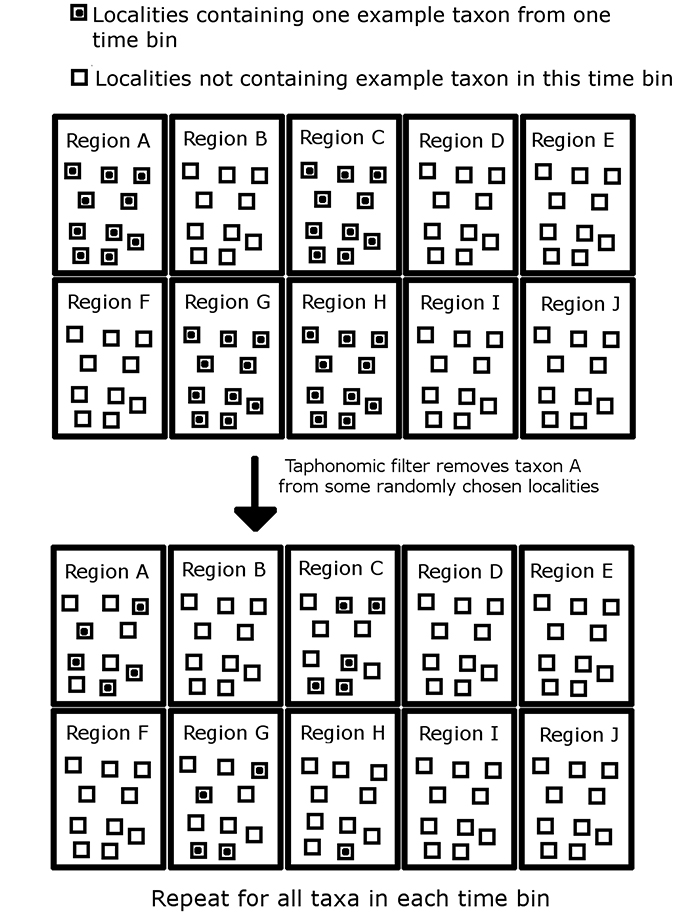
FIGURE 2. An illustration of how sampling proxies are generated in this simulation. This schematic illustrates which formations and localities in a single time bin contain fossils of at least one species of the simulated clade after application of the taphonomic filter. Formations and localities are removed at random, representing a lack of sampling. Note that the number of clade-bearing formations and localities does not necessarily equal the number of formations and localities sampled, allowing the generation of four sampling proxies.
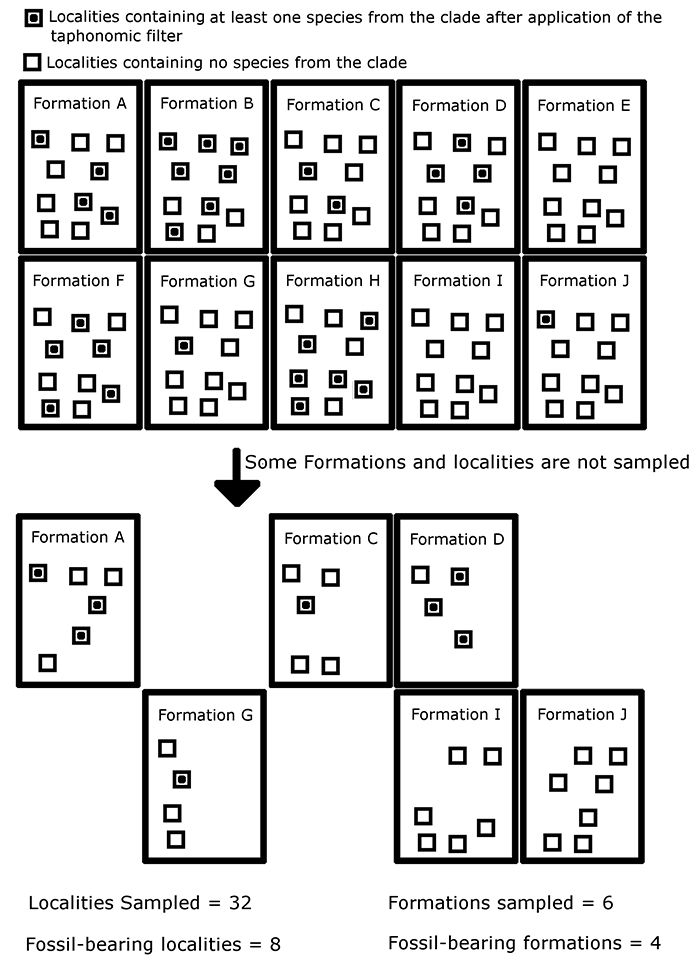
FIGURE 3. The performance of different implementations of the residual diversity estimate (RDE) under different sampling regimes. (3.1) Mean Spearman’s rho values of four implementations of the RDE using Formations as a proxy, with values of PFORM, PLOC and PTAPH variable but equal. (3.2) Mean Spearman’s rho values of four implementations of the RDE using Localities as a proxy. (3.3) Mean Spearman’s rho values of four implementations of the RDE, all using the Smith and McGowan method. (3.4) Mean Spearman’s rho values of the taxic and phylogenetic diversity estimate compared to those of the optimum implementation of the RDE. The dashed red line indicates the critical value at p=0.05. Abbreviations as in Table 1.
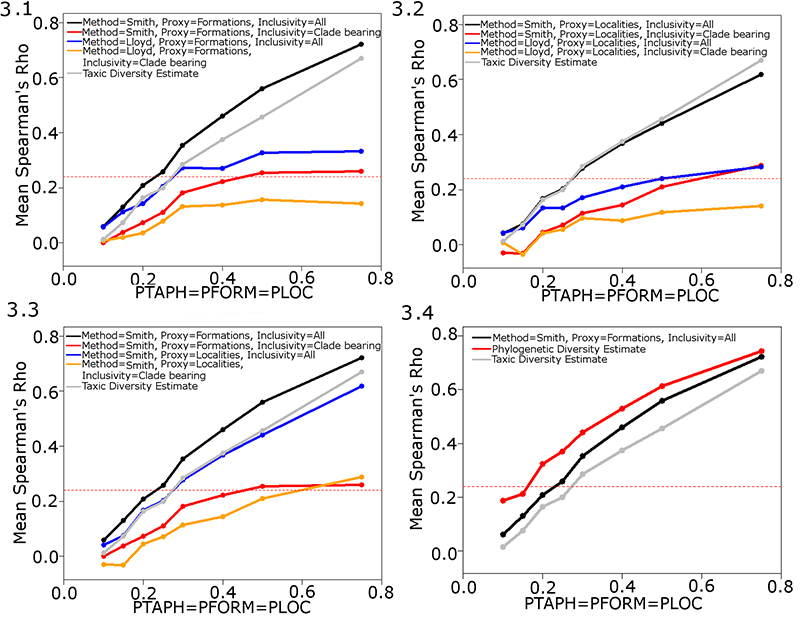
FIGURE 4. The performance of different implementations of the residual diversity estimate examining faunas with varying degrees of homogeneity. PFORM, PLOC and PTAPH are set at 0.25. The rate of dispersal is increased relative to the rate of local extinction to increase the homogeneity of the faunas. The dashed red line indicates the critical value at p=0.05. Abbreviations as in Table 1.
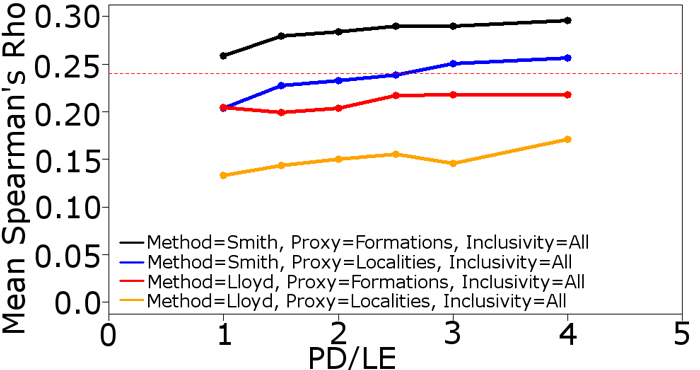
FIGURE 5. The performance of different implementations of the residual diversity estimate when a specific bias is forced to be the dominant influence. (5.1) Mean Spearman’s rho values of four implementations of the RDE using the Smith and McGowan method. PFORM and PTAPH are set at 0.9 to minimise their influence, PLOC is variable. PMIST set at 0.1. (5.2) Mean Spearman’s rho values of four implementations of the RDE using the Smith and McGowan method. LOC and PTAPH are set at 0.9 to minimise their influence, PFORM is variable. PMIST set at 0.1. The dashed red line indicates the critical value at p=0.05. Abbreviations as in Table 1.
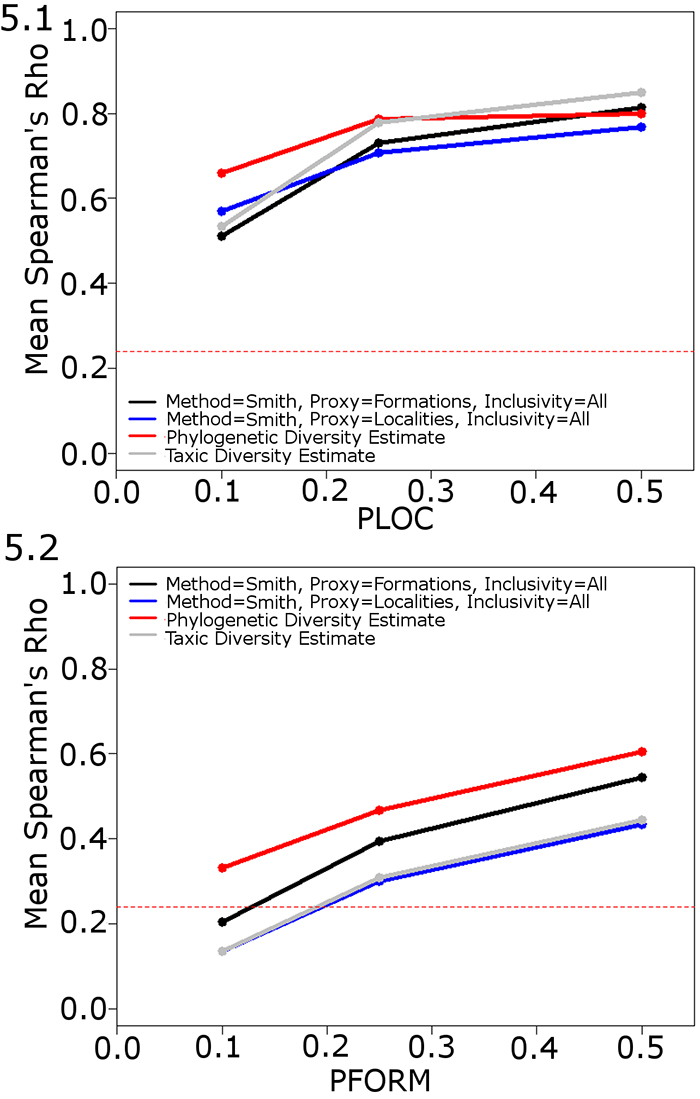
FIGURE 6. The performance of the phylogenetic diversity estimate when errors are introduced to the phylogeny. Mean Spearman’s rho values of the PDE, TDE and the best performing implementation of the RDE. PLOC, PFORM and PTAPH set at 0.25. PMIST variable. The dashed red line indicates the critical value at p=0.05. Abbreviations as in Table 1.
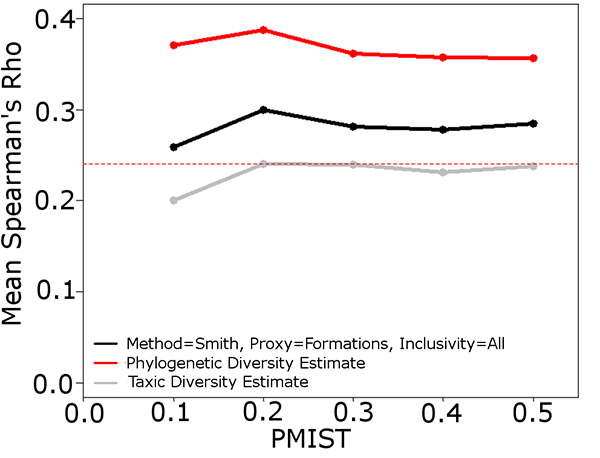
FIGURE 7. Sample simulation comparing the results of the taxic, phylogenetic and residual diversity estimates to the true diversity. PFROM, PLOC and PTAPH set at 0.25. PMIST set at 0.1. Black box highlights instance where the Signor Lipps effect has been exaggerated by the PDE; the TDE and RDE both identify the rapid diversity decrease present in the true diversity. Abbreviations as in Table 1.
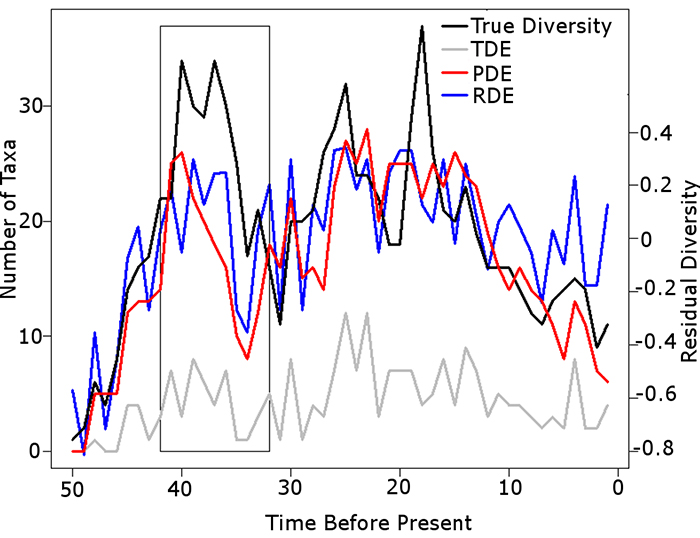
TABLE 1. Abbreviations used in the figures and text.
| Abbreviation | Meaning |
| PTAPH | The probability that a species is not removed from a locality by taphonomic processes |
| PFORM | The probability that a formation is sampled |
| PLOC | The probability that a locality is sampled |
| PMIST | The probability that of a node being subjected to nearest node interchange (i.e., an error is introduced to the phylogeny at that node); in short, the error rate. |
| PD/LE | The probability of dispersal divided by the probability of local extinction. |
| TDE | Taxic diversity estimate |
| PDE | Phylogenetic diversity estimate |
| RDE | Residual diversity estimate |
TABLE 2. The full list of parameter variations tested in this study. For each set of parameter values, 100 simulations were carried out. The Spearman’s rho values presented in the figures and Appendix are the means of the results from the 100 simulation.
| PTAPH | PFORM | PLOC | PMIST | PD/LE | |
| Simulation 1 | 0.1 | 0.1 | 0.1 | 0.1 | 1 |
| Simulation 2 | 0.15 | 0.15 | 0.15 | 0.1 | 1 |
| Simulation 3 | 0.2 | 0.2 | 0.2 | 0.1 | 1 |
| Simulation 4 | 0.25 | 0.25 | 0.25 | 0.1 | 1 |
| Simulation 5 | 0.3 | 0.3 | 0.3 | 0.1 | 1 |
| Simulation 6 | 0.4 | 0.4 | 0.4 | 0.1 | 1 |
| Simulation 7 | 0.5 | 0.5 | 0.5 | 0.1 | 1 |
| Simulation 8 | 0.75 | 0.75 | 0.75 | 0.1 | 1 |
| Simulation 9 | 0.25 | 0.25 | 0.25 | 0.2 | 1 |
| Simulation 10 | 0.25 | 0.25 | 0.25 | 0.3 | 1 |
| Simulation 11 | 0.25 | 0.25 | 0.25 | 0.4 | 1 |
| Simulation 12 | 0.25 | 0.25 | 0.25 | 0.5 | 1 |
| Simulation 13 | 0.9 | 0.1 | 0.9 | 0.1 | 1 |
| Simulation 14 | 0.9 | 0.25 | 0.9 | 0.1 | 1 |
| Simulation 15 | 0.9 | 0.5 | 0.9 | 0.1 | 1 |
| Simulation 16 | 0.9 | 0.9 | 0.1 | 0.1 | 1 |
| Simulation 17 | 0.9 | 0.9 | 0.25 | 0.1 | 1 |
| Simulation 18 | 0.9 | 0.9 | 0.5 | 0.1 | 1 |
| Simulation 19 | 0.25 | 0.25 | 0.25 | 0.1 | 1.5 |
| Simulation 20 | 0.25 | 0.25 | 0.25 | 0.1 | 2 |
| Simulation 21 | 0.25 | 0.25 | 0.25 | 0.1 | 2.5 |
| Simulation 22 | 0.25 | 0.25 | 0.25 | 0.1 | 3 |
| Simulation 23 | 0.25 | 0.25 | 0.25 | 0.1 | 4 |
APPENDIX. Mean and standard deviations of the rho values of all 23 simulations (PDF file).
A simulation-based examination of residual diversity estimates as a method of correcting for sampling bias
Plain Language Abstract
The residual diversity estimate is a method used to remove biases from the fossil record, such as availability of fossil-bearing rocks from different time periods or workers studying certain time periods more thoroughly, so that one may more accurately assess the changes in species numbers through time. The method has proven popular in recent years, but its performance has never been thoroughly tested. This paper presents a simulation-based analysis testing the performance of different methods of implementing the residual diversity estimate and comparing it to other methods of correcting for sampling biases. The paper supports specific practices when using the residual diversity estimate and identifies instances where it performs poorly.
Resumen en Español
Un examen basado en la simulación de las estimaciones de la diversidad residual como un método para corregir el sesgo de muestreo
La influencia de los sesgos de muestreo en las estimaciones de la riqueza de especies a través del tiempo geológico es una gran preocupación, por lo que se han desarrollado múltiples métodos para corregirlos. Un método es la estimación de la diversidad residual, una modelización que elimina la señal de la variable proxy de muestreo elegida. A pesar de haber sido ampliamente aplicada a los estudios de paleodiversidad, la estimación de la diversidad residual aún no se ha probado en un entorno de simulación. Una de las dificultades de una prueba de este tipo es que la simulación debe modelizar el muestreo de tal manera que una variable proxy de muestreo pueda ser extraída a partir del modelo con el fin de calcular la diversidad residual. Aquí, se usa un enfoque novedoso para examinar la eficacia de este método. Fueron simulados los taxones y una filogenia asociada utilizando un modelo nacimiento-muerte, y se añadió un parámetro para representar la dispersión de los taxones entre las áreas en el espacio simulado. El espacio simulado en cada unidad de tiempo se dividió en formaciones y localidades, que se eliminaron al azar para representar un muestreo incompleto, lo cual también proporcionaba variables proxy de muestreo utilizadas para calcular la estimación de diversidad residual. Se obtiene la estimación de la diversidad residual para conseguir un mejor rendimiento cuando la variable proxy más amplia representando regiones enteras, e.g., formaciones, se utiliza en su cálculo, en lugar de las localidades más restrictivas. Una reciente actualización de la estimación de la diversidad residual, incorporando relaciones polinómicas entre la diversidad y las variables proxy, se mostró deficiente, a veces mostrando una peor correlación con la verdadera diversidad de los datos brutos. La estimación de la diversidad residual es mejorada consistentemente por la estimación de la diversidad filogenética, incluso cuando se han introducido errores en la filogenia.
Palabras clave: riqueza de especies; diversidad; simulación; estimación de la diversidad residual; estimación de la diversidad filogenética; corrección de muestreo
Traducción: Enrique Peñalver
Résumé en Français
Une méthode de correction du biais d'échantillonnage utilisant un examen des estimations de diversité résiduelle basé sur une simulation
L'influence des biais d'échantillonnage sur les estimations de richesse spécifique au cours des temps géologiques est d'un intérêt primordial, et de nombreuses méthodes ont été développées pour corriger ces biais. Une de ces méthodes est l'estimation de diversité résiduelle, une approche de modélisation qui élimine le signal d'un « proxy » d'échantillonnage choisi. Bien qu'elle ait été largement appliquée aux études de paléodiversité, l'estimation de diversité résiduelle n'a pas encore été testée dans un environnement simulé. Une des difficultés d'un tel test provient du fait que la simulation doit modéliser l'échantillonnage de telle manière que le « proxy » d'échantillonnage puisse être extrait du modèle afin de calculer la diversité résiduelle. Dans cet article, une approche novatrice est utilisée pour examiner l'efficacité de cette méthode. Des taxons et une phylogénie associée ont été simulés par un modèle de naissances-décès, et un paramètre représentant la dispersion des taxons entre les zones de l'espace simulé a été ajouté. L'espace simulé de chaque fenêtre temporelle a été divisé en formations et en localités qui ont été supprimées de manière aléatoire pour représenter un échantillonnage incomplet, fournissant par la même occasion des « proxies » d'échantillonnage utilisés pour calculer une estimation de diversité résiduelle. Il est montré que l'estimation de diversité résiduelle est la plus performante quand un « proxy » plus large, représentant des régions entières, e.g., des formations, est utilisé dans ses calculs, plutôt que des localités plus restreintes. Une mise à jour récente des estimations de diversité résiduelle, incorporant des relations polynomiales entre la diversité et les « proxies », est peu efficace, montrant parfois une corrélation encore plus faible avec la diversité réelle par rapport aux données brutes. L'estimation de diversité résiduelle fait moins bien que l'estimation de diversité phylogénique, même quand des erreurs sont introduites dans la phylogénie.
Mots-clés : richesse spécifique ; diversité ; simulation ; estimations de diversité résiduelle ; estimations de diversité phylogénétique ; correction d'échantillonnage
Translator: Antoine Souron
Deutsche Zusammenfassung
Eine Simulation-basierte Untersuchung residualer Diversitäts-Schätzungen als eine Methode Probenverzerrung zu korrigieren
Die Einflussnahme von Probenverzerrungen auf den geschätzten Artenreichtum durch die geologische Zeit bereitet große Sorgen und verschiedene Methoden wurden entwickelt sie zu korrigieren. Eine Methode ist die residuale Diversitäts-Schätzung, ein Modellierungsansatz der das Signal einer gewählten Proben-Proxy entfernt. Obwohl sie in paläontologischen Untersuchungen weit verbreitet ist, muss die residuale Diversitäts-Schätzung erst noch in einer Simulationsumgebung getestet werden. Eine Schwierigkeit mit einem solchen Test besteht darin, dass die Simulation eine Probe derartig abbilden muss, dass die Proben-Proxy aus dem Modell entnommen werden kann um die residuale Diversität zu berechnen. Hier wird eine neue Herangehensweise benutzt, um die Effizienz dieser Methode zu untersuchen. Taxa und eine dazugehörige Phylogenie wurden mit dem Geburten/Sterbemodell simuliert und es wurde ein Parameter hinzugefügt der die Dispersion der Taxa zwischen den Gebieten der simulierten Fläche repräsentierte. Die simulierte Fläche in jedem Time-bin wurde in Formationen und Lokalitäten unterteilt, die per Zufall entfernt wurden um unvollständige Proben zu simulieren und die auch Proben-Proxies lieferten, die zur Berechnung der residualen Diversitäts-Schätzung genutzt wurden. Es wurde herausgefunden, dass die residuale Diversitäts-Schätzung am besten gelingt, wenn die weitere Proxy, die gesamte Regionen und besonders Formationen repräsentiert für die Berechnung benutzte wird als eine geringere Anzahl an Lokalitäten. Ein aktuelles Update zur residualen Diversitäts-Schätzung welches polynomische Beziehungen zwischen Diversität und Proxies beinhaltet, funktioniert schlecht, da es zuweilen eine falsche Korrelation mit der echten Diversität anzeigt als mit den Rohdaten. Die residuale Diversitäts-Schätzung wird durchweg von der phylogenetischen Diversitäts-Schätzung übertroffen, auch wenn Fehler in die Phylogenie eingebracht wurden.
Schlüsselwörter: Artenreichtum; Diversität; Simulation; residuale Diversitäts-Schätzung; phylogenetische Diversitäts-Schätzung; Probenkorrektur
Translator: Eva Gebauer
Arabic

Translator: Ashraf M.T. Elewa
-
-
PE: An influential journal
 Palaeontologia Electronica among the most influential palaeontological journals
Article number: 27.2.2E
July 2024

 A Review of Handbook of Paleoichthyology Volume 8a: Actinopterygii I, Palaeoniscimorpha, Stem Neopterygii, Chondrostei