

Volume 28.3
September–December 2025
Full table of contents
ISSN: 1094-8074, web version;
1935-3952, print version
Recent Research Articles
See all articles in 28.3 September-December 2025
See all articles in 28.2 May-August 2025
See all articles in 28.1 January-April 2025
See all articles in 27.3 September-December 2024
Interested in submitting a paper to Palaeontologia Electronica?
Click here to register and submit.
 |
||||
 |
||||
Article Search
 Dominic J. Bennett. Department of Earth Sciences and Engineering, Imperial College London, London UK. Institute of Zoology, Zoological Society of London, London UK. dominic.john.bennett@gmail.com
Dominic gained his BSc and MRes from Imperial College London in biological science and has recently completed his PhD at Imperial College London and the Zoological Society London in palaeobiology and macroevolution. His PhD project focussed on macroevolutionary trends, in particular on the concept of the living fossil, to test whether past evolutionary performance is a predictor of future evolutionary performance.

 Mark D. Sutton. Department of Earth Sciences and Engineering, Imperial College London, London UK. m.sutton@imperial.ac.uk
Mark Sutton is a Senior Lecturer in the Department of Earth Science & Engineering, Imperial College, London. He received his PhD on brachiopod taxonomy from the University of Cardiff in 1996, and his subsequent research centres around three-dimensional reconstruction and phylogenetic analysis of Palaeozoic invertebrates, including arthropods, molluscs, brachiopods, echinoderms and more besides. His research interests extend to other applications of three-dimensional reconstruction and computer modelling in Palaeontology, including evolutionary and phylogenetic modelling. He is best known for work on the Silurian-aged Herefordshire Lagerstätte. Mark is an editor for Palaeontologia Electronica.
 Samuel T. Turvey. Institute of Zoology, Zoological Society of London, London UK. samuel.turvey@ioz.ac.uk
Samuel Turvey is a Senior Research Fellow at the Institute of Zoology, Zoological Society of London. He received his BA and D.Phil from the University of Oxford. His work encompasses both past and present human impacts on biodiversity, from research into the magnitude and dynamics of extinctions during the Late Pleistocene and Holocene, to science-based conservation management of some of the world's most highly threatened species.
APPENDIX 1.
We conducted a literature survey by searching ISI Web of Knowledge and Google Scholar with the search phrase “living fossil”. In total we read 56 papers, chapters and books. Below we list all the references from which we found an explicit or implied definition.
A1 REFERENCES
Amemiya, C.T. et al., 2013. The African coelacanth genome provides insights into tetrapod evolution. Nature, 496(7445):311-6.
Batten, R.L. 1984. Neopilina, Neomphalus and Neritopsis, living fossil molluscs, p. 218-225. In Eldredge, N. and Stanley, S.M. (eds.), Living Fossils (Casebooks in Earth Sciences), Springer-Verlag, New York.
Biernat, G. and Emig, C.C. 1993. Anatomical distinctions of the Mesozoic lingulide brachiopods. Acta Palaeontologica Polonica, 38:1-20.
Biton, R. Geffen, E., Vences, M., Cohen, O., Bailon, S., Rabinovich, R., Malka, Y., Oron, T., Boistel, R. Brumfeld, V. and Gafny S. 2013. The rediscovered Hula painted frog is a living fossil. Nature Communications, 4:1959. https://doi.org/0.1038/ncomms2959
Buckley, G., Brochu, C., Krause, D. W. and Pol D. 2000. A pug-nosed crocodyliform from the Late Cretaceous of Madagascar. Nature, 405(6789):941-4. https://doi.org/10.1038/35016061s://doi.org/10.1038/35016061
Casane, D. and Laurenti, P. 2013. Why coelacanths are not “living fossils”: a review of molecular and morphological data. BioEssays: News and Reviews in Molecular, Cellular and Developmental Biology, 35(4):332-8. https://doi.org/10.1002/bies.201200145
Colgan, M.W. 1984. Cretaceous coral Heliopora (Octocorallia, Conothecalia) - A Common Indo-Pacific Reef Builder, p. 266-272. In Eldredge, N. and Stanley, S.M. (eds.), Living Fossils (Casebooks in Earth Sciences), Springer-Verlag, New York.
Cracraft, J. 1984. Conceptual and Methodological Aspects of the Study of Evolutionary Rates, with some Comments on Bradytely in Birds, p. 95-104. In Eldredge, N. and Stanley, S.M. (eds.), Living Fossils (Casebooks in Earth Sciences), Springer-Verlag, New York.
Darwin, C., 1858. Letter 2384: Darwin, C.R. to Hooker, J.D. In Darwin Correspondence Project. Cambridge University Press, Cambridge, 1-4. https://www.darwinproject.ac.uk/
Darwin, C., 1859. On the origin of species by means of natural selection (first edition). John Murray, London.
Delson, E. & Rosenberger, A.L. 1984. Are There Any Anthropoid Primate Living Fossils?, p. 50-61. In Eldredge, N. and Stanley, S.M. (eds.), Living Fossils (Casebooks in Earth Sciences), Springer-Verlag, New York.
Eisner, T. 2003. Living Fossils: On Lampreys, Baronia, and the Search for Medicinals. BioScience, 53(3):265-269. https://doi.org/10.1641/0006-3568(2003)053[0265:LFOLBA]2.0.CO;2
Eldredge, N. 1979. Alternative approaches to evolutionary theory, p. 7-19. In Schwartz, J.H. and Rolins, H.B. (eds.), Models and Methodologies in Evolutionary Theory. Bulletin Carnegie Museum of Natural History, Pittsburgh.
Eldredge, N. 1984. Simpson’s inverse: bradytely and the phenomenon of living fossils, p. 272-277. In Eldredge, N. and Stanley, S.M. (eds.), Living Fossils (Casebooks in Earth Sciences), Springer-Verlag, New York.
Emery, R.J. and Thorington, R.W.J. 1984. The tree squirrel Sciurus (Sciuridae, Rodentia) as a living fossil, p. 23-31. In Eldredge, N. and Stanley, S.M. (eds.), Living Fossils (Casebooks in Earth Sciences), Springer-Verlag, New York.
Fisher, D.C. 1984. The Xiphosurida: archetypes of bradytely?, p. 196-214. In Eldredge, N. and Stanley, S.M. (eds.), Living Fossils (Casebooks in Earth Sciences), Springer-Verlag, New York.
Fisher, D.C. 1990. Rates of evolution - living fossils, p. 152-159. In Briggs, D.E.G. and Crowther, P.R. (eds.), Paleobiology: A Synthesis, Blackwell Science.
Forey, P. 1984. The Coelacanth as living fossil, p. 166-170. In Eldredge, N. and Stanley, S.M. (eds.), Living Fossils (Casebooks in Earth Sciences), Springer-Verlag, New York.
Friedman, M. and Coates, M.I. 2006. A Newly Recognized Fossil Coelacanth Highlights the Early Morphological Diversification of the Clade. Proceedings. Biological sciences, The Royal Society, 273(1583):245-50. https://doi.org/10.1098/rspb.2005.3316
Gardiner, B.G. 1984. Sturgeons as living fossils, p.148-153. In Eldredge, N. and Stanley, S.M. (eds.), Living Fossils (Casebooks in Earth Sciences), Springer-Verlag, New York.
Ghislin, M.T. 1984. Peripatus as a living fossil, p. 214-218. In Eldredge, N. and Stanley, S.M. (eds.), Living Fossils (Casebooks in Earth Sciences), Springer-Verlag, New York.
Greenwood, P.H. 1984. Denticeps clupeiodes Clausen (1959), p. 140-143. In Eldredge, N. and Stanley, S.M. (eds.), Living Fossils (Casebooks in Earth Sciences), Springer-Verlag, New York.
Greenwood, P.H. 1984. Polypterus and Erpetoichthys : anachronistic Osteichthyans, p. 143-148. In Eldredge, N. and Stanley, S.M. (eds.), Living Fossils (Casebooks in Earth Sciences), Springer-Verlag, New York.
Hay, J. M., Subramanian, S., Millar, C. D., Mohandesan, E. and Lambert, D. M. 2008. Rapid molecular evolution in a living fossil. Trends in Genetics, 24:106-109. https://doi.org/10.1016/j.tig.2007.12.002
Hessler, R.R. 1984. Cephalocarida: Living Fossil without a Fossil Record, p. 181-187. In Eldredge, N. and Stanley, S.M. (eds.), Living Fossils (Casebooks in Earth Sciences), Springer-Verlag, New York.
Hessler, R.R. and Schram, F.R. 1984. Leptostraca as living fossils, p. 187-192. In Eldredge, N. and Stanley, S.M. (eds.), Living Fossils (Casebooks in Earth Sciences), Springer-Verlag, New York.
Hickman, C.S. 1984. Pleurotomaria: Pedigreed Perseverance?, p. 225-232. In Eldredge, N. and Stanley, S.M. (eds.), Living Fossils (Casebooks in Earth Sciences), Springer-Verlag, New York.
Houbrick, R.S. 1984. Diamstoa melaniodes (Reeve) a Relict Snail from South Australia, 236-240. In Eldredge, N. and Stanley, S.M. (eds.), Living Fossils (Casebooks in Earth Sciences), Springer-Verlag, New York.
Houbrick, R.S. 1984. The Giant Creeper, Campanile symbolicum Iredale, an Australian Relict Marine Snail, p. 232-236. In Eldredge, N. and Stanley, S.M. (eds.), Living Fossils (Casebooks in Earth Sciences), Springer-Verlag, New York.
Houbrick, R.S. 1984. The Relict Cerithiid Prosobranch, Gourmya gourmyi (Creese), p. 240-243. In Eldredge, N. and Stanley, S.M. (eds.), Living Fossils (Casebooks in Earth Sciences), Springer-Verlag, New York.
Isaac, N. J. B., Turvey, S. T., Collen, B., Waterman, C., and Baillie, J. E. M. 2007. Mammals on the EDGE: conservation priorities based on threat and phylogeny. PloS One, 2(3):e296. https://doi.org/10.1371/journal.pone.0000296
Janis, C. 1984. Tapirs as living fossils, p. 80-87. In Eldredge, N. and Stanley, S.M. (eds.), Living Fossils (Casebooks in Earth Sciences), Springer-Verlag, New York.
Janis, C. 1984. Tragulids as living fossils, p. 87-95. In Eldredge, N. and Stanley, S.M. (eds.), Living Fossils (Casebooks in Earth Sciences), Springer-Verlag, New York.
Kano, Y., Kimura, S., Kimura, T. and Warén, A. 2012. Living Monoplacophora: morphological conservatism or recent diversification? Zoologica Scripta, 41(5):471-488. https://doi.org/10.1111/j.1463-6409.2012.00550.x
Maisey, J.G. and Wolfram, K.E. 1984. “Notidanus.”, p. 170-181. In Eldredge, N. and Stanley, S.M. (eds.), Living Fossils (Casebooks in Earth Sciences), Springer-Verlag, New York.
Mathers, T. C., Hammond, R. L., Jenner, R. a, Hänfling, B. and Gómez, A. 2013. Multiple global radiations in tadpole shrimps challenge the concept of “living fossils”. PeerJ, 1, e62. https://doi.org/10.7717/peerj.62
Meyer, E.R. 1984. Crocodilians as living fossils, p. 105-131. In Eldredge, N. and Stanley, S.M. (eds.), Living Fossils (Casebooks in Earth Sciences), Springer-Verlag, New York.
Nagalingum, N.S., Marshall, C. R., Quental, T. B., Rai, H. S. Little, D. P. and Mathews, S. 2011. Recent Synchronous Radiation of a Living Fossil. Science, 334(6057):796-799. https://doi.org/10.1126/science.1209926
Novack, M. 1984. Evolutionary statsis in the elephant shrew, Rhynchocyon, p. 4-23. In Eldredge, N. and Stanley, S.M. (eds.), Living Fossils (Casebooks in Earth Sciences), Springer-Verlag, New York.
Obst, M., Faurby, S. Bussarawit, S. and Funch, P. 2012. Molecular phylogeny of extant horseshoe crabs (Xiphosura, Limulidae) indicates Paleogene diversification of Asian species. Molecular phylogenetics and evolution, 62(1):21-6. https://doi.org/10.1016/j.ympev.2011.08.025
Parsons, P. 1994. Habitats, stress, and evolutionary rates. Journal of Evolutionary Biology, 397(3):387-397. https://doi.org/10.1046/j.1420-9101.1994.7030387.x
Patterson, C. 1984. Family Chanidae and other Teleostean fishes as living fossils, p. 132-140. In Eldredge, N. and Stanley, S.M. (eds.), Living Fossils (Casebooks in Earth Sciences), Springer-Verlag, New York.
Royer, D. L., Hickey, L. J., and Wing, S. L. 2003. Ecological conservatism in the “living fossil” Ginkgo. Paleobiology, 29(1):84-104. https://doi.org/10.1666/0094-8373(2003)029
Rudkin, D. M., Young, G. A. and Nowlan, G. S. 2008. The oldest horseshoe crab: a new xiphosurid from late Ordovician Konservat-Lagerstätten deposits, Manitoba, Canada. Palaeontology, 51(1):1-9. https://doi.org/10.1111/j.1475-4983.2007.00746.x
Schopf, T. J. M. 1984. Rates of evolution and the notion of “living fossils.” Annual Review of Earth Planetary Science, 12:245-292. https://doi.org/10.1146/annurev.ea.12.050184.001333
Schram, F.R. and Hessler, R.R. 1984. Anapisida Syncarida, p. 192-196. In Eldredge, N. and Stanley, S.M. (eds.), Living Fossils (Casebooks in Earth Sciences), Springer-Verlag, New York.
Schultze, H.-P. and Wiley, E.O. 1984. Neopterygian Amia as a living fossil, p. 153-160. In Eldredge, N. and Stanley, S.M. (eds.), Living Fossils (Casebooks in Earth Sciences), Springer-Verlag, New York.
Schwarze, K. and Burmester, T. 2013. Conservation of globin genes in the “living fossil” Latimeria chalumnae and reconstruction of the evolution of the vertebrate globin family. Biochimica et Biophysica Acta - Proteins and Proteomics, 1834:1801-1812. https://doi.org/10.1016/j.bbapap.2013.01.019
Schwartz, J.H. 1984. What is a tarsier?, p. 38-50. In Eldredge, N. and Stanley, S.M. (eds.), Living Fossils (Casebooks in Earth Sciences), Springer-Verlag, New York.
Stanley, S.M., 1984. Does bradytely exist?, p. 278-280. In Eldredge, N. and Stanley, S.M. (eds.), Living Fossils (Casebooks in Earth Sciences), Springer-Verlag, New York.
Stanley, S.M. 1984. Neotrigonia, the sole surviving genus of the Trigoniidae (Bivalvia, Mollusca), p. 243-247. In Eldredge, N. and Stanley, S.M. (eds.), Living Fossils (Casebooks in Earth Sciences), Springer-Verlag, New York.
Stanley, S.M. 1998. Macroevolution: Pattern and Process, The Johns Hopkins University Press, Baltimore.
Tattersall, I. 1984. The tree-shrew, Tupaia: a “living model” of the ancestral primates, p. 32-38. In Eldredge, N. and Stanley, S.M. (eds.), Living Fossils (Casebooks in Earth Sciences), Springer-Verlag, New York.
Venkatesh, B., Lee, A. P., Ravi, V., Maurya, A. K., Lian, M. M., Swann, J. B.,... Warren, W. C. 2014. Elephant shark genome provides unique insights into gnathostome evolution. Nature, 505(7482):174-9. https://doi.org/10.1038/nature12826
Vrba, E. 1984. Evolutionary pattern and process in the sister-group Alcelaphini-Aepycerotini (Mammalia: Bovidae), p. 62-79. In Eldredge, N. and Stanley, S.M. (eds.), Living Fossils (Casebooks in Earth Sciences), Springer-Verlag, New York.
Ward, P., 1984. Is Nautilus a living fossil?, p. 257-266. In Eldredge, N. and Stanley, S.M. (eds.), Living Fossils (Casebooks in Earth Sciences), Springer-Verlag, New York.
Wiley, E.O. and Schultze, H.-P. 1984. Family Lepisosteida (Gars) as living fossils, p. 160-165. In Eldredge, N. and Stanley, S.M. (eds.), Living Fossils (Casebooks in Earth Sciences), Springer-Verlag, New York.
Winston, J.E. and Cheetham, A.H. 1984. The Bryozoan Nellia tenella as a living fossil, p. 257-266. In Eldredge, N. and Stanley, S.M. (eds.), Living Fossils (Casebooks in Earth Sciences), Springer-Verlag, New York.
Wray, C., Landman, N. H., Saunders, W. B. and Bonacum, J. 1995. Genetic Divergence and Geographic Diversification in Nautilus. Paleobiology, 21(2):220-228. https://doi.org/10.1017/S009483730001321X
Yoshida, K. 2002. Long survival of “living fossils” with low taxonomic diversities in an evolving food web. Paleobiology, 28(4):464-473. https://doi.org/10.1666/0094-8373(2002)028<0464:LSOLFW>2.0.CO;2
APPENDIX 2.
Identifying commonly cited aspects of the living fossil and the inconsistency of their use. Here we demonstrate how our nine aspects of the living fossil are represented by examples taken from the casebook of living fossils (Eldredge and Stanley 1984).
| Chapter 2: Tree squirrels (Emry and Thorington) | Chapter 5: Primates (Delson and Rosenberger) | Chapters 7 and 8: Ungulates (Janis) | Chapter 10: Crocodiles (Myers) | Chapter 16: Lepisosteid (Wiley and Schultze) | |
| Existing for a long time | Yes, 35 million years | Yes, the older the more 'living fossily' | Yes, since in Eocene | Yes, implicitly, back to the Jurassic | No, because they have no evidence |
| Morphologically conserved | Yes, they have remained stable | Yes | Yes | Yes, a constant morphotype is maintained | Yes, they appear to be |
| Another conservatism | Yes, they’re still arboreal and eat nuts | Not explicitly mentioned | Yes, behaviourally and ecologically | Yes, a constant lifestyle is maintained | Not explicitly mentioned |
| Having primitive features | Yes, they’ve kept the squirrel morphotype | No, a specialist species can be a living fossil e.g.Aotus | Yes, they lack derived behavioural group characteristics | Yes, implicitly | Not explicitly mentioned |
| Phylogenetically distinct | Not explicitly mentioned | Not explicitly mentioned | Not explicitly mentioned | Not explicitly mentioned | Not explicitly mentioned |
| A survivor of a once large clade | Not explicitly mentioned | Not explicitly mentioned | Yes, they have shown a contraction | No, the idea is of a constant living fossil clade | Not explicitly mentioned |
| Geographically isolated | No, they’re very well distributed | Not explicitly mentioned | Yes, they have small ranges and exist in few places | No, they’re well distributed | Not explicitly mentioned |
| Having generalist niche | No, implicitly | No, implicitly | Yes, implicitly | No, they maintain the same specialist niche | Not explicitly mentioned |
APPENDIX 3.
Estimated divergence times of top living fossil vetrebrates according to pEPI using the timetree method and looking-up in fossilcalibration.org.
| Scientific name | NCBI ID | Group | Timetree/ Phylogeny | Fossil Callibration* |
| Latimeria | 7896 | Vertebrates | 413.0 | 408-427.9 [Sarcopterygii] |
| Lepidogalaxias salamandroides | 89578 | Actinopterians | 209.4 | 150.9-235 [Clupeocephala] |
| Ceratodontimorpha | 118077 | Vertebrates | 413.0 | 408-427.9 [Sarcopterygii] |
| Sphenodon | 8507 | Lepidosaurs | 251.8 | 238-252.7 [Lepidosauria] |
| Holostei | 1489100 | Actinopterians | 314.7 | 250-331.1 [Holosteii] |
| Opisthocomus hoazin | 30419 | Aves | 72.4 | 66-86.8 [Neognathae] |
| Ascaphus | 8438 | Amphbians | 183.5 | 165.3-201.5 [Anura] |
| Polypteridae | 8289 | Vertebrates | 386.3 | 378.19-422.4 [Actinopterygii] |
| Monotremata | 9255 | Mammals | 166.2 | 157.3-169.6 [Theria] |
| *Closest available splits, e.g. no estimate is available for lungfishes or coelacanths so the origin of Sarcopterygii is used. | ||||
APPENDIX 4
We used maximum parsimony reconstruction (MPR) (Narushima and Hanazawa, 1997) for estimating the states of internal nodes. This requires that all character traits provided are numeric integers. We, therefore, converted all continuous traits (such as body mass) by binning into ten equally spaced units. For traits that were non-numeric, we made them numeric by randomly assigning numbers. Because trait states are not available for all parts of a tree, we reduce the tree by dropping absent tips and estimated ancestral states for this subset (Appendix 5.1).
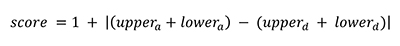
MPR estimates upper and lower internal node states (Farris, 1970). We used these numbers to estimate a change score (score) defined as one plus the absolute difference between the summed upper and lower estimates for the ascending and descending nodes that define a branch (eq. 1), see Appendix 5.2.
 |
(A1) |
Values of one indicate no change has occurred, values between one and two indicate that change must have occurred for some of the most parsimonious trees, values above two indicate more than one change must have occurred. The score begins at one to prevent zero division errors when calculated contrasted change.
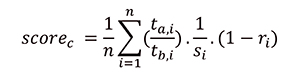
The change scores for each trait were then mapped to the full tree using name matching based on descendants. Scores per trait were equally shared between additional branches that are represented in the full tree (Appendix 5.3). Finally, when calculating the contrasted change score by node, the mean score is calculated for all descendent branches from a node and its previous branch (Appendix 5.4). The sister contrasted change (score c) is then calculated from these data as the mean of contrasted mean changes for all (n) shared traits (t) between a clade (a) and its sister (b). Because traits are non-independent, and some show more possibility of variance than others, our mean was weighted based on the absolute mean of Spearman’s R for shared traits between a clade and its sister (r), and the number of states represented by a trait (s) (eq. 2). Score c was only calculated for clades with estimated change scores for more than four contrastable characters.
  |
(A2) |
Farris, J.S. 1970. Methods for Computing Wagner Trees. Systematic Biology, 19(1):83-92. https://doi.org/10.1093/sysbio/19.1.83
Narushima, H. and Hanazawa, M. 1997. A more efficient algorithm for MPR problems in phylogeny. Discrete Applied Mathematics, 80:231-238. https://doi.org/10.1016/S0166-218X(97)00088-7
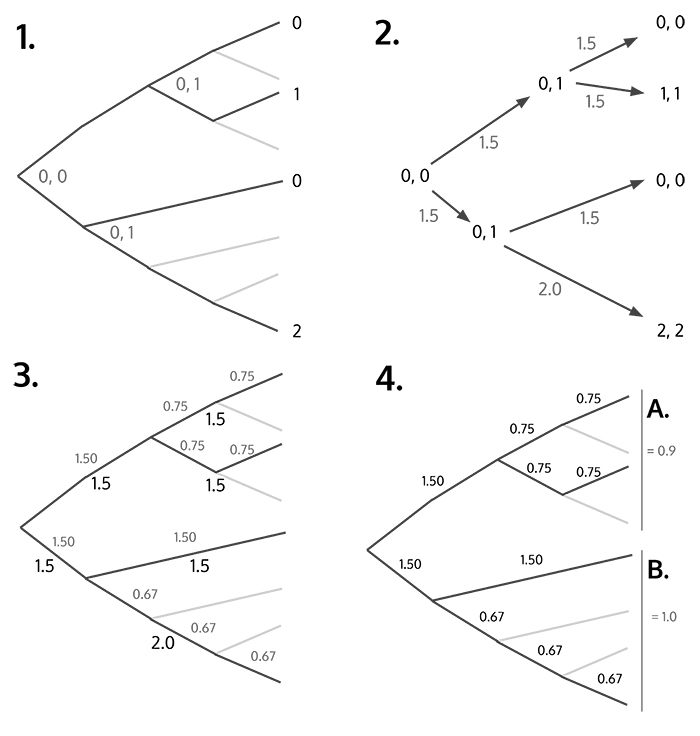
APPENDIX 5.
Calculating amount of change that has occurred for a single trait. (S1.1) Use maximum parsimony reconstruction to estimate upper and lower states of trait at internal nodes. (S1.2) Calculate change score based on the absolute difference of upper and lower states between previous and next node. (S1.3) Map changes onto larger original tree by equally splitting scores for all branch parts. (S1.4) Calculate score for every node and its sister by calculating mean scores from parental and descendant branches.
APPENDIX 6.
Information and statistics for all clades for which pEPI, EPI and ED scores were calculated. Clades are ordered by pEPI. Common names are not available for all clades, these are automatically taken from NCBI. If you are looking for a specific clade, you may not find it because we only calculate values for clades that split. For example, lungfishes are represented by the clade "Ceratodontimorpha" even though they are more commonly known as "Dipnoi". This is because, according to NCBI taxonomy, the Dipnoi group only has a single child, Ceratodonitmorpha, which from the perspective of evolutionary performance make them the same clade. To find a clade, first search for it at the NCBI taxonomy website (www.ncbi.nlm.nih.gov/taxonomy) to ensure it is splitting. Additionally, many clades were ommitted if their "Success" was greater than 0.01 and/or their parent had fewer than 500 descendent species. This file is available in a zipped file with Appendix 7 as a CSV file for download.
APPENDIX 7.
Contrasted change by character for bottom 250 clades most likely to be living fossils according to pEPI. Values below one indicate character has changed more in sister clade, above one indicate the inverse. This file is available in a zipped file with Appendix 6 as a CSV file for download.
FIGURE 1. How to calculate pEPI and EPI from a phylogenetic tree. Numbers above the branches are estimated change scores. Clades A and B are sisters; their performance scores depend on each other. Contrasted change (Cc) is calculated as the mean change score for a clade divided by its sister’s. Contrasted success (Sc) is calculated as the number of species in a clade divided by its sister’s. Time (T) is the amount of time in MY since the clade first appeared. EPI and pEPI are then calculated using equations 1 and 2.
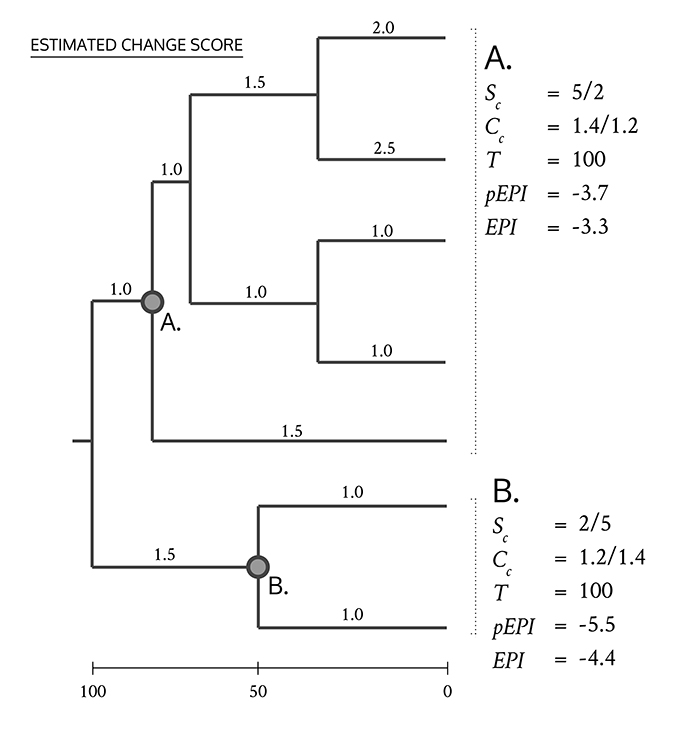
FIGURE 2. (1) pEPI and EPI show a strong correlation. Evolutionary distinctness (ED) when logged shows strong correlations with both EPI (2) and pEPI (3).
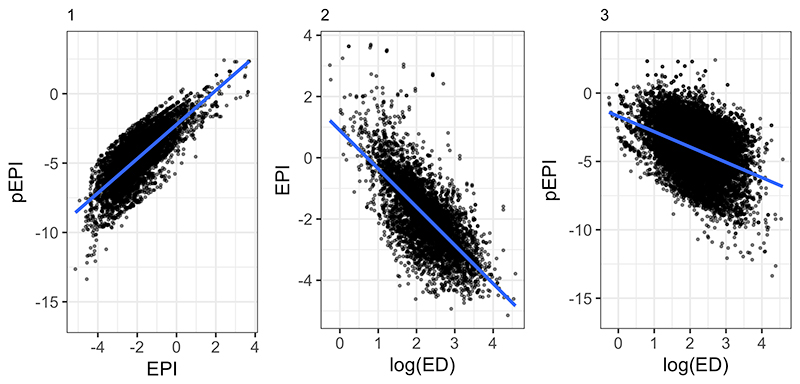
FIGURE 3. Dispersion increases as a clade’s time since splitting increases for both success (1) and change (2). Living fossil clades are found towards the bottom-right, clades that have likely experienced an adaptive radiation aggregate in the top-right.
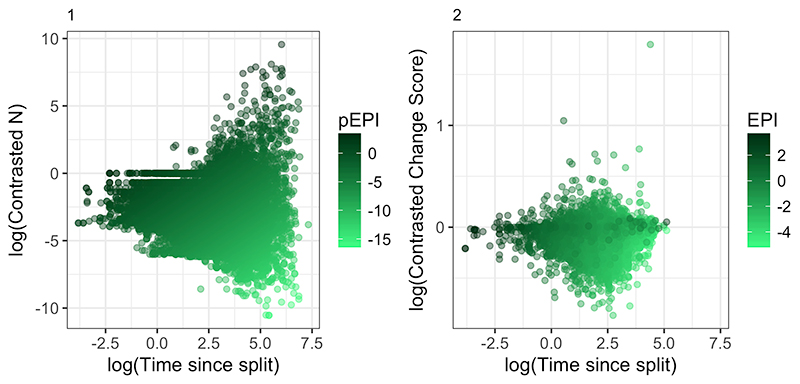
FIGURE 4. Probability of the Wikipedia article for a clade containing the phrase “living fossil(s)” against different scores for EPI (1), pEPI (2) and ED (3).
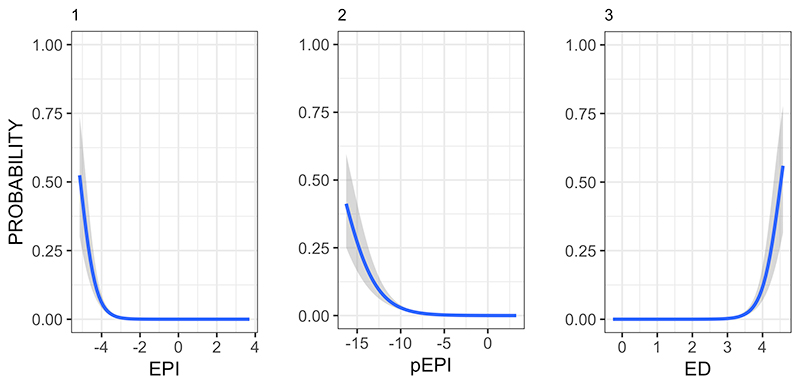
TABLE 1. Top five living fossils according to pEPI and their associated statistics for Amphibia, Arthropoda, Aves, Embryophyta, Lepidosauria, Mammalia, Metazoa, Vertebrata and Actinopteria. “-” indicates no data is available.
| Common name | Scientific name | Change | Success | Time | ED | EPI | pEPI | % |
| Amphibians | Amphibia | - | 3.24E-01 | 351.80 | - | - | -6.99 | 20%-21% |
| Tailed frog | Ascaphus | - | 3.47E-04 | 183.50 | - | - | -13.18 | 0%-1% |
| New Zealand primitive frogs | Leiopelma | - | 6.95E-04 | 183.50 | - | - | -12.48 | 0%-1% |
| Gastric-brooding frog | Rheobatrachus silus | - | 1.49E-03 | 123.90 | - | - | -11.33 | 1%-2% |
| Fire-bellied toads | Bombinatoridae | - | 1.91E-03 | 156.90 | - | - | -11.32 | 1%-2% |
| The Seychelles frogs | Sooglossoidea | - | 1.80E-03 | 135.30 | - | - | -11.23 | 1%-2% |
| Arthropods | Arthropoda | - | 4.10E+02 | 680.50 | - | - | -0.51 | 98%-99% |
| Kauri moth | Agathiphaga queenslandensis | - | 2.64E-05 | 224.00 | - | - | -15.95 | 0%-1% |
| Southern beech moth | Heterobathmia pseuderiocrania | - | 2.64E-05 | 224.00 | - | - | -15.95 | 0%-1% |
| - | Andesiana lamellata | - | 2.70E-05 | 194.00 | - | - | -15.79 | 0%-1% |
| Archaic bell moths | Neopseustidae | - | 5.29E-05 | 194.00 | - | - | -15.12 | 0%-1% |
| - | Prionodiaptomus | - | 2.18E-04 | 507.35 | - | - | -14.66 | 0%-1% |
| Birds | Aves | - | 3.41E+02 | 236.50 | - | - | 0.37 | 99%-100% |
| Hoatzin | Opisthocomus hoazin | 0.74 | 1.13E-04 | 72.45 | 72.69 | -4.56 | -13.37 | 0%-1% |
| New Zealand wrens | Acanthisittidae | 0.80 | 3.72E-04 | 73.10 | 41.68 | -4.55 | -12.19 | 0%-1% |
| Hoopoes, wood-hoopoes, scimitarbills | Upupiformes | 0.96 | 3.41E-04 | 59.58 | 20.68 | -4.13 | -12.07 | 0%-1% |
| Grey hypocolius | Hypocolius ampelinus | - | 1.86E-04 | 29.02 | 32.41 | - | -11.96 | 0%-1% |
| Mousebirds | Coliidae | 0.83 | 6.81E-04 | 81.59 | 38.97 | -4.54 | -11.69 | 0%-1% |
| Land Plants | Embryophyta | - | 1.99E+02 | 919.80 | - | - | -1.53 | 94%-95% |
| Coontails or hornworts | Ceratophyllum | - | 7.91E-05 | 139.00 | - | - | -14.38 | 0%-1% |
| - | Berberidopsidales | - | 1.19E-04 | 113.70 | - | - | -13.77 | 0%-1% |
| - | Andreaeobryum macrosporum | - | 3.11E-04 | 220.00 | - | - | -13.47 | 0%-1% |
| Griffith's oedipodium moss | Oedipodium griffithianum | - | 3.24E-04 | 214.10 | - | - | -13.40 | 0%-1% |
| Soap bark tree | Quillaja saponaria | - | 1.13E-04 | 65.40 | - | - | -13.27 | 0%-1% |
| Lepidosaurs | Lepidosauria | - | 7.06E-01 | 279.70 | - | - | -5.98 | 30%-31% |
| Tuatara | Sphenodon | - | 3.06E-04 | 251.80 | - | - | -13.62 | 0%-1% |
| Cat gecko | Aeluroscalabotes felinus | - | 1.19E-03 | 116.00 | - | - | -11.49 | 0%-1% |
| - | Dibamidae | - | 2.15E-03 | 201.00 | - | - | -11.45 | 0%-1% |
| - | Altiphylax | - | 2.37E-03 | 110.67 | - | - | -10.75 | 1%-2% |
| - | Microgecko | - | 2.37E-03 | 108.00 | - | - | -10.73 | 1%-2% |
| Mammals | Mammalia | - | 3.54E-01 | 311.90 | - | - | -6.78 | 22%-23% |
| Egg-laying mammals | Monotremata | 0.97 | 5.37E-04 | 166.20 | 80.13 | -5.15 | -12.64 | 0%-1% |
| Mountain beaver | Aplodontia rufa | - | 5.34E-04 | 58.70 | 58.82 | - | -11.61 | 0%-1% |
| Springhare | Pedetes capensis | 0.85 | 5.34E-04 | 56.90 | 59.83 | -4.20 | -11.58 | 0%-1% |
| Flying lemurs | Cynocephalidae | - | 1.10E-03 | 91.30 | 52.18 | - | -11.33 | 1%-2% |
| Beavers | Castor | 0.91 | 1.07E-03 | 71.60 | 41.88 | -4.37 | -11.11 | 1%-2% |
| Multicelled animals | Metazoa | - | 3.39E+00 | 998.10 | - | - | -5.68 | 34%-35% |
| - | Limnognathia maerski | - | 5.77E-05 | 662.00 | - | - | -16.26 | 0%-1% |
| Placozoans | Trichoplax | - | 8.74E-05 | 951.80 | - | - | -16.20 | 0%-1% |
| Mesozoans | Mesozoa | - | 1.10E-04 | 951.80 | - | - | -15.97 | 0%-1% |
| Jaw worms | Gnathostomulida | - | 1.36E-04 | 745.60 | - | - | -15.51 | 0%-1% |
| Comb jellies | Ctenophora | - | 2.18E-04 | 824.00 | - | - | -15.15 | 0%-1% |
| Vertebrates | Vertebrata | - | 1.27E+02 | 680.20 | - | - | -1.68 | 93%-94% |
| Coelacanth | Latimeria | - | 7.06E-05 | 413.00 | - | - | -15.58 | 0%-1% |
| Lungfishes | Ceratodontimorpha | - | 4.23E-04 | 413.00 | - | - | -13.79 | 0%-1% |
| Bichirs | Polypteridae | - | 7.66E-04 | 386.30 | - | - | -13.13 | 0%-1% |
| Jawless vertebrates | Cyclostomata | - | 2.20E-03 | 615.00 | - | - | -12.54 | 0%-1% |
| Crocodiles | Crocodylia | - | 2.93E-03 | 236.50 | - | - | -11.30 | 1%-2% |
| Actinopterians | Actinopteria | - | 2.32E+03 | 314.70 | - | - | 2.00 | 99%-100% |
| Salamanderfish | Lepidogalaxias salamandroides | - | 8.32E-05 | 209.40 | - | - | -14.74 | 0%-1% |
| - | Holostei | - | 4.32E-04 | 314.70 | - | - | -13.50 | 0%-1% |
| Beardfish | Polymixia | - | 5.31E-04 | 148.00 | - | - | -12.54 | 0%-1% |
| Convict/engineer blenny/goby | Pholidichthys leucotaenia | - | 4.49E-04 | 93.00 | - | - | -12.24 | 0%-1% |
| Jellynose fish | Ateleopodidae | - | 8.33E-04 | 166.90 | - | - | -12.21 | 0%-1% |
TABLE 2. Top living fossils according to EPI and their associated statistics for birds (B) and mammals (M) for which the change variable could be calculated.
| Common name | Scientific name | B/M | Change | Success | Time | ED | EPI | pEPI |
| Egg-laying mammals | Monotremata | M | 0.97 | 5.37E-04 | 166.20 | 80.13 | -5.15 | -12.64 |
| Marsupials | Metatheria | M | 1.00 | 6.68E-02 | 147.70 | 18.28 | -4.93 | -7.70 |
| Ratites and Tinamous | Palaeognathae | B | 1.01 | 6.24E-03 | 116.75 | 25.58 | -4.74 | -9.84 |
| Anteaters, sloths and armadillos | Xenarthra | M | 0.99 | 6.92E-03 | 101.10 | 25.48 | -4.62 | -9.59 |
| Afrotherians | Afrotheria | M | 0.98 | 2.08E-02 | 101.30 | 30.44 | -4.62 | -8.49 |
| Fowl | Galloanserae | B | 0.97 | 5.52E-02 | 103.54 | 7.23 | -4.61 | -7.54 |
| Aardvark | Orycteropus afer | M | 0.92 | 9.43E-03 | 93.20 | 93.34 | -4.61 | -9.20 |
| Odd-toed ungulates | Perissodactyla | M | 0.86 | 1.20E-02 | 87.30 | 29.38 | -4.61 | -8.89 |
| Hoatzin | Opisthocomus hoazin | B | 0.76 | 1.13E-04 | 72.45 | 72.69 | -4.56 | -13.37 |
| New Zealand wrens | Acanthisittidae | B | 0.77 | 3.72E-04 | 73.10 | 41.68 | -4.55 | -12.19 |
| Trogons | Trogonidae | B | 0.82 | 4.45E-03 | 77.23 | 12.35 | -4.54 | -9.76 |
| Oilbird | Steatornis caripensis | B | 0.83 | 1.10E-02 | 79.12 | 79.17 | -4.54 | -8.88 |
| Mouse birds | Coliidae | B | 0.87 | 6.81E-04 | 81.59 | 38.97 | -4.54 | -11.69 |
| Pangolins | Manis | M | 0.91 | 6.40E-03 | 84.90 | 25.73 | -4.53 | -9.49 |
| Seriemas | Cariamidae | B | 0.89 | 1.26E-02 | 82.20 | 48.49 | -4.51 | -8.78 |
| Solenodons | Solenodon | M | 0.94 | 4.72E-03 | 84.20 | 62.54 | -4.49 | -9.79 |
| Rabbits and hares | Lagomorpha | M | 0.98 | 4.64E-02 | 91.80 | 12.99 | -4.49 | -7.59 |
| Dormice | Gliridae | M | 0.85 | 9.16E-03 | 76.30 | 24.13 | -4.49 | -9.03 |
| Tree shrews | Tupaiidae | M | 1.05 | 9.95E-03 | 94.30 | 28.62 | -4.49 | -9.16 |
| Divers/Loons | Gavia | B | 0.75 | 5.68E-04 | 64.98 | 30.23 | -4.46 | -11.65 |
| Shorebirds | Charadriiformes | B | 0.97 | 3.56E-02 | 85.18 | 12.14 | -4.44 | -7.78 |
| Mesites | Mesitornithidae | B | 0.93 | 1.26E-02 | 77.54 | 36.09 | -4.41 | -8.73 |
| Owls | Strigiformes | B | 0.97 | 1.78E-02 | 80.44 | 10.57 | -4.40 | -8.42 |
| Falcons and caracaras | Falconiformes | B | 0.96 | 3.33E-02 | 80.68 | 11.15 | -4.40 | -7.79 |
| Parrots | Psittaciformes | B | 0.96 | 4.00E-02 | 80.48 | 8.76 | -4.39 | -7.61 |
TABLE 3. Number of species counted from NCBI taxonomy and number of expected for each taxonomic grouping. Metazoan estimate is based on the sum of descendent clades.
| Group | Spp. Count | Expected Count | % | Reference | |
| Amphibia | 6,936 | 7,571 | 92 | (AmphibiaWeb, 2016) | |
| Arthropoda | 166,900 | 7,500,000 | * | 2 | (Ødegaard, 2000) |
| Aves | 8,867 | 10,050 | 88 | (Gill and Wright, 2006) | |
| Embryophyta | 131,987 | 350,669 | 38 | (The Plant List, 2006) | |
| Lepidosauria | 6,539 | 9,000 | * | 73 | (Uetz, 2010) |
| Mammalia | 5,593 | 5,416 | 103 | (Wilson and Reeder, 2005) | |
| Metazoa | 265,332 | 7,980,706 | 3 | - | |
| Vertebrata | 50,498 | 64,000 | 79 | (Baillie et al. 2004) | |
| Actinopetrians | 20,847 | 34,000 | * | 61 | (Froese and Pauly, 2017) |
| Mean % | 60 | ||||
| *Author estimates based on description | |||||
Quantifying the living fossil concept
Plain Language Abstract
“Living fossil” is a term used in common parlance to describe an ancient organism that may have survived for millions of years with little change. Among palaeontologists, however, the term is controversial as, being so broad, multiple interpretations are possible. How much change is little change? How old is ancient? And what even constitutes a “change”? Recently, many have argued that the term should be abandoned because of its lack of clarity. In this paper, we instead propose a quantitative definition for the living fossil based around measurable variables most often associated with the term. We combine these variables into a single metric that we term the Evolutionary Performance Index (EPI). We calculated the EPI scores for over 24,000 different groups across all multi-cellular life. Among the most “living-fossil” clades were the coelacanths, tuatara and the gingko (the maidenhair tree). With this open, large, objective listing of living fossils, we hope to enable future researchers to better test what might be the potential causes for some organisms to experience less evolutionary change than others.
Resumen en Español
Cuantificando el concepto de fósil viviente
"Fósil viviente" es una expresión polémica, a menudo utilizada para identificar clados que han experimentado un cambio evolutivo particularmente poco intenso. Muchos de los problemas asociados con la expresión se deben a la falta de una definición clara. Hasta la fecha, la mayoría del trabajo realizado sobre este fenómeno ha sido principalmente cualitativo, lo que ha conducido a una lista de fósiles vivientes en la que cada uno ha sido seleccionado por razones diferentes. Esta falta de uniformidad en la identificación de los fósiles vivientes dificulta la evaluación de la ubicuidad, la claridad y las posibles causas del fenómeno. Un enfoque alternativo es usar una métrica cuantitativa que coincida con las interpretaciones más comunes de "fósil viviente" para generar un listado menos subjetivo. Aquí presentamos el Índice de Expresión Evolutiva (EPI en inglés); este índice se puede calcular a lo largo de todo el árbol de la vida y permite comparaciones adecuadas entre grupos taxonómicos. Con este índice, hemos calculado una expresión cuantitativa del cambio para más de 24.000 clados dentro de Metazoa y Embryophyta. Muchos fósiles vivientes bien conocidos figuran entre los clados de expresión más baja, por ejemplo, los celacantos, los ginkgos, los tuátaras, así como grupos que previamente se han pasado por alto. Al basar la definición dentro de un marco estrictamente cuantitativo, los futuros investigadores estarán en mejores condiciones de probar las causas y la relevancia del fenómeno.
Palabras clave: fósil viviente; distinción evolutiva; expresión evolutiva; índice de expresión evolutiva
Traducción: Enrique Peñalver (Sociedad Española de Paleontología)
Résumé en Français
Quantifier le concept de fossile vivant
« Fossile vivant » est un terme controversé fréquemment utilisé pour identifier des clades qui ont expérimenté particulièrement peu de changements évolutifs. Les nombreux problèmes associés avec le terme sont généralement dus à un manque de définition claire. À ce jour, la majorité des travaux sur ce phénomène ont été principalement qualitatifs, résultant en une liste de fossiles vivants tous sélectionnés en se basant sur des raisons différentes. Cette non-uniformité dans l’identification des fossiles vivants rend l’ubiquité, la clarté, et les causes potentielles du phénomène difficiles à évaluer. Afin de générer une liste moins subjective, une approche alternative est d’utiliser une métrique quantitative qui correspond aux interprétations les plus communes des « fossiles vivants ». Dans cet article, nous présentons l’Indice de Performance Évolutive (IPE). Cette métrique est calculable sur l’ensemble de l’arbre de la vie et permet des comparaisons pertinentes entre les groupes taxinomiques. Avec cet indice, nous avons quantifié les performances évolutives de plus de 24000 clades au sein des Metazoa et Embryophyta. De nombreux fossiles vivants bien connus sont parmi les clades avec les performances les plus basses, e.g., les cœlacanthes, les gingkos, les sphénodons, ainsi que des groupes qui avaient précédemment été négligés. En ancrant la définition dans un cadre purement quantitatif, les chercheurs seront à l’avenir capables de mieux tester les causes et la pertinence du phénomène.
Mots-clés : fossile vivant ; disparité évolutive ; performance évolutive ; index de performance évolutive
Translator: Antoine Souron
Deutsche Zusammenfassung
Quantifizierung des lebende Fossilien Konzepts
“Lebende Fossilien” ist eine kontroverse Bezeichnung, mit der oft Kladen identifiziert werden, die sich evolutionär besonders wenig verändert haben. Viele der mit dieser Bezeichnung assoziierten Probleme lassen sich auf das Fehlen einer klaren Definition zurückführen. Bislang waren die meisten Arbeiten über dieses Phänomen qualitativ, was zu einer Liste von Fossilien geführt hat, von denen jedes aus verschiedenen Sorten von Gründen ausgewählt wurde. Diese Uneinheitlichkeit bei der Identifikation lebender Fossilien erschwert es Ubiquität, Klarheit und potentielle Gründe zu bewerten. Der alternative Ansatz nutzt eine quantitative Kennzahl, die mit der geläufigsten Interpretation des „lebenden Fossils“ übereinstimmt um eine weniger subjektive Liste zu erstellen. Hier präsentieren wir den Evolutionären Performance Index (EPI); diese Metrik ist über den gesamten Stammbaum kalkulierbar und erlaubt einen angemessenen Vergleich zwischen den taxonomischen Gruppen. Mit diesem Index berechneten wir die Performance-Werte für über 24 000 Taxa innerhalb der Metazoa und Embryophyta. Viele bekannte lebende Fossilien rangierten unter den sich wenig verändernden Kladen wie Coelacanthier, Gingkos oder Tuataras aber auch Gruppen die bisher übersehen wurden. Indem die Definition in einen strengen quantitativen Rahmen gesetzt wurde, werden künftige Forscher besser Ursache und Bedeutung des Phänomens testen können.
Schlüsselwörter: lebendes Fossil; evolutionäre Eindeutigkeit; evolutionäre Performance; evolutionärer Performance Index
Translator: Eva Gebauer
Arabic
Translator: Ashraf M.T. Elewa
-
-
PE: An influential journal
 Palaeontologia Electronica among the most influential palaeontological journals
Article number: 27.2.2E
July 2024

 A Review of Handbook of Paleoichthyology Volume 8a: Actinopterygii I, Palaeoniscimorpha, Stem Neopterygii, Chondrostei