


FIGURE 1. Hoploscaphites spedeni from the Late Cretaceous (Maastrichtian) Western Interior exhibiting intraspecific variation in both dimorphs. Scale bars indicate 1 cm. 1.1, Compressed macroconch (YPM 27162) with subdued ribs and exhibiting only the umbilicolateral and ventrolateral tubercles. 1.2, Typical macroconch (YPM 27160) with better defined ribs, stronger umbilicolateral and ventrolateral tubercles, and numerous randomly distributed tubercles on the recurved hook. 1.3, Rotund macroconch (YPM 23122) with broad ribs, three to four rows of flank tubercles on phragmocone, and randomly distributed tubercles on the recurved hook. 1.4, Compressed microconch (YPM 23199) with broad ribs on the phragmocone, strong umbilicolateral tubercles, and broad ventrolateral tubercles. 1.5, Typical microconch (YPM 23732) with subdued umbilicolateral tubercles, stouter body chamber, and reduced ventrolateral tubercles on recurved hook. 1.6, Ornate microconch (YPM 23699) exhibiting mid-flank row of body chamber tubercles, closely spaced umbilicolaterals, and closely spaced phragmocone ribs. Asterisk (*) indicates the base of the adult body chamber. Modified from Landman and Waage (1993).
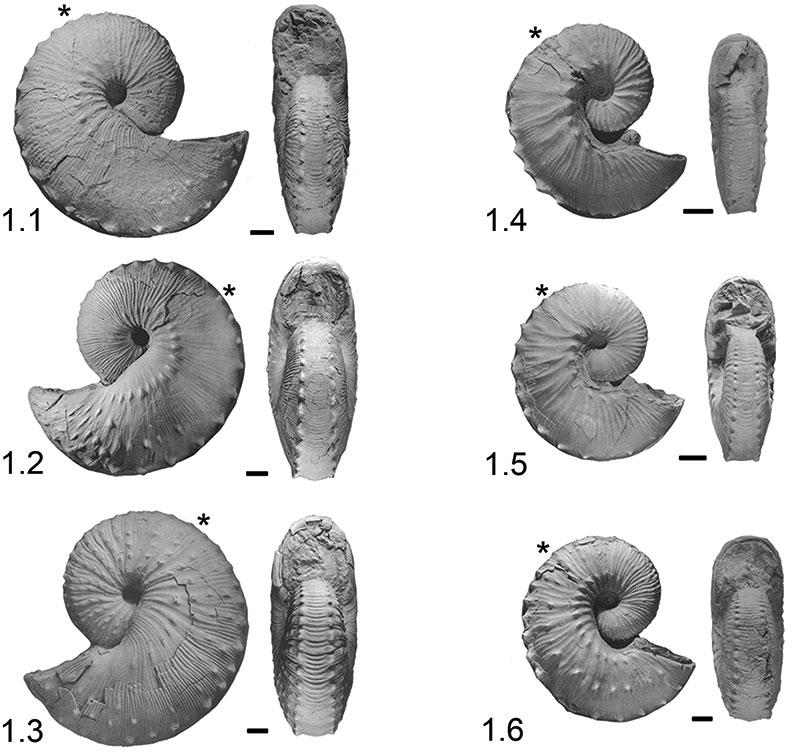
FIGURE 2. Hoploscaphites nebrascensis, presumed descendant and sister taxon to H. spedeni, from the Late Cretaceous (Maastrichtian) Western Interior. Scale bars indicate 1 cm. 2.1, 2.2 and 2.3, Macroconchs (YPM 23146, YPM 23145 and YPM 23147, respectively) exhibit a relatively less variable morphology with five to seven rows of flank tubercles from phragmocone through body chamber, a compressed shell, and high whorl height. 2.4, 2.5 and 2.6, Microconchs (YPM 23198, YPM 23687 and YPM 23697, respectively) are consistently compressed like their respective macroconchs, but lack ventrolateral tubercles on the recurved hook, are more variable in the degree of tuberculation ranging from multiple rows of flank tubercles to none, and sometimes contain two rows of closely approximated umbilicolateral tubercles. Asterisk (*) indicates the base of the adult body chamber. Modified from Landman and Waage (1993).
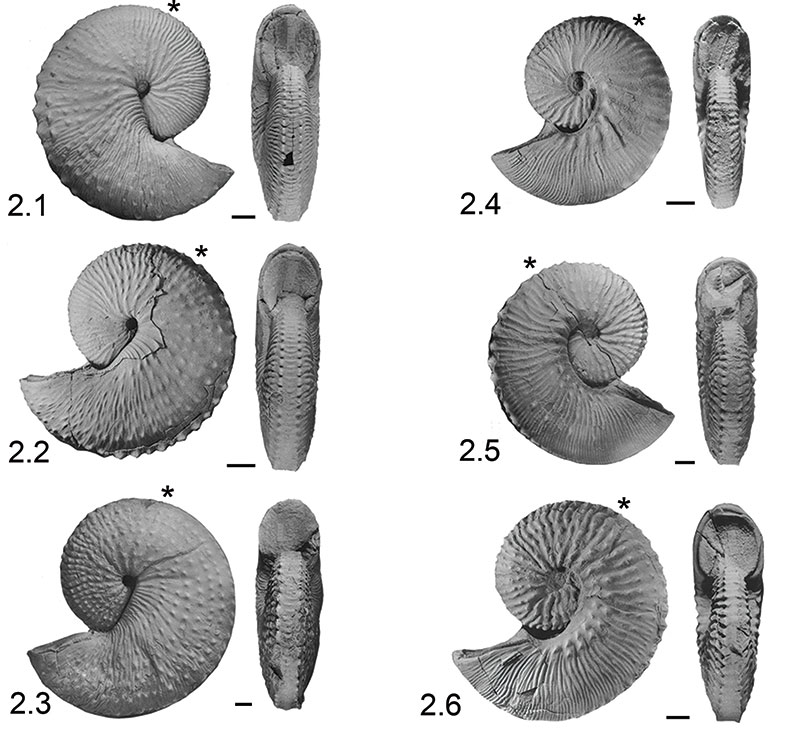
FIGURE 3. Sample photographs used in the creation of 3D digital models (here, a rotund Hoploscaphites spedeni macroconch, YPM 23122). After positioning the specimen and verifying that the dorso-ventral plane was parallel to the table, 140 to 200 photographs were collected at various heights every 10° around the specimen (using angles marked off along the rim of the pan as a guide), to ensure full coverage around each ammonoid.
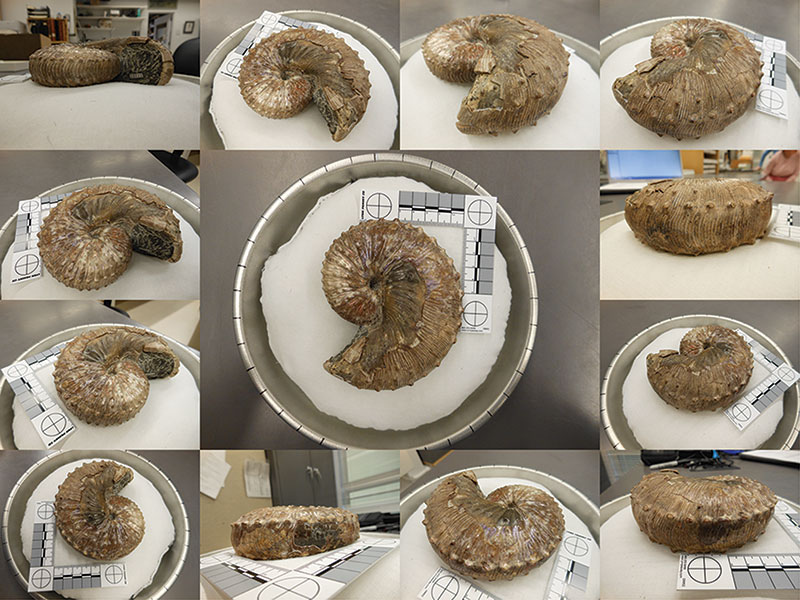
FIGURE 4. Various orientations of a triangular irregular network (TIN) 3D model for specimen YPM 23122 generated within ArcGIS 10 (ESRI, Inc., 2011) after post-modeling processing within the free, open-source software package, MeshLab (Cignoni et al., 2011). After models were created in 123D Catch (Autodesk, Inc., 2013), they were imported into MeshLab to remove extraneous background scatter (see Appendix 1) and to cut the specimen along the dorso-ventral plane. The XYZ points were exported from MeshLab and then imported into ArcGIS 10, where a TIN surface, like that shown here, was generated for each ammonoid specimen. Note that the accuracy of the digital model was not significantly reduced; however, slight differences are present between the original model made by 123D Catch and the TIN surface generated by ArcGIS 10 from the XYZ points, particularly in the shape of the surficial features (i.e., tubercles) of the phragmocone.
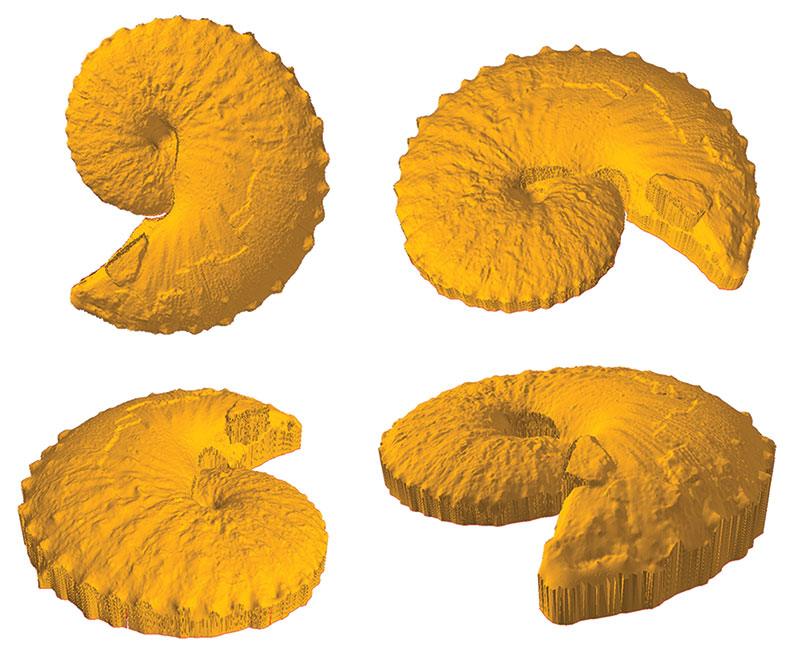
FIGURE 5. Examples of triangular irregular network (TIN) models exhibiting aspect (slope direction) used to generate Orientation Patch Count (OPC) metric, or the number of discrete patches of different aspect classes (e.g., North, Northeast, East, etc.). The color wheel in the center illustrates the orientation of aspect observed on the ammonoids. A feature class containing the number of discrete aspect patches was extracted for each ammonoid, with the total number of patches representing the OPC value. Because the default class breaks for TIN surfaces within ArcGIS 10 contain two North classes (337.5° to 359.9° and 0° to 22.5°), the number of North patches is inherently inflated. Likewise, some specimens have small, seemingly randomly assigned patches around the shell margins, possibly from errors produced in generating the TIN surface. However, all specimens were equally subject to the same problems, suggesting no bias was present to influence the results. 5.1, Hoploscaphites spedeni macroconch (YPM 23122). 5.2, H. spedeni microconch (YPM 23199). 5.3, H. nebrascensis macroconch (YPM 23144). 5.4, H. nebrascensis microconch (YPM 23195).
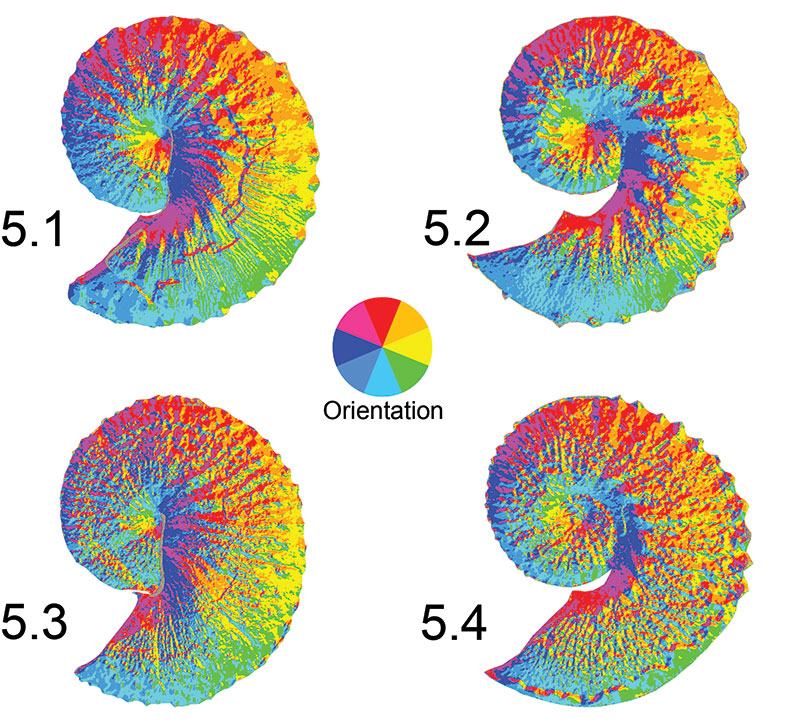
FIGURE 6. Examples of raster models showing the surface-to-planimetric (3D to 2D) area ratio. The legend in the center indicates high values (very steep slope) to low values (near horizontal slope). The mean and median cell values of each raster were extracted and used in comparisons. Rasterization was necessary to conduct map algebra in ArcGIS 10 (ESRI, Inc., 2011). While rasterization does result in reduced resolution of fine features (e.g., ornamentation), the resolution of flank convexity was maintained. 6.1, Hoploscaphites spedeni macroconch (YPM 23122). 6.2, H. spedeni microconch (YPM 23199). 6.3, H. nebrascensis macroconch (YPM 23144). 6.4, H. nebrascensis microconch (YPM 23195).
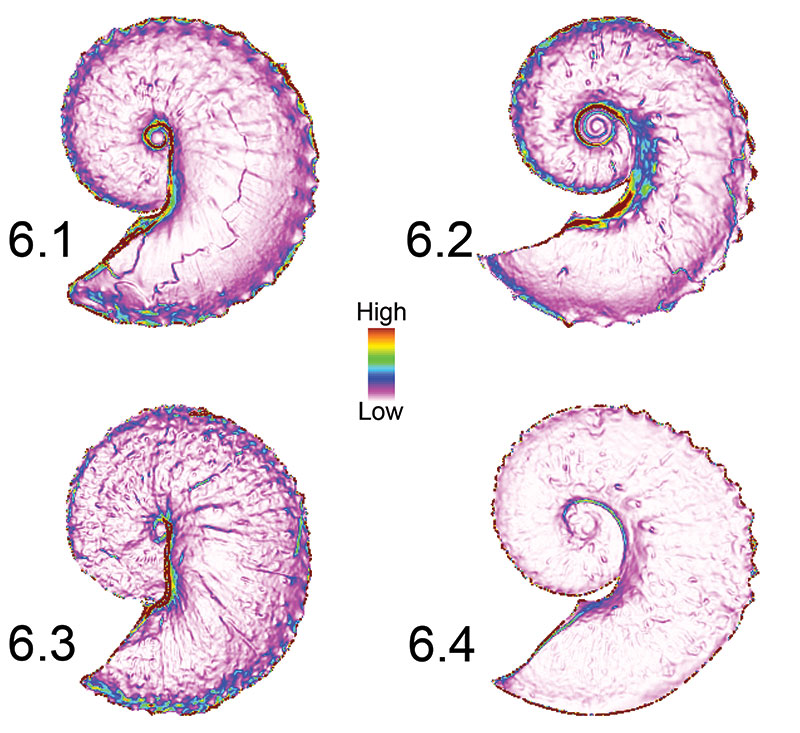
FIGURE 7. Surface aspect maps. The color wheel in the center illustrates the orientation of aspect observed on the ammonoids. Plotting surface aspect (slope direction) allows visualization of ornamentation across the lateral surface of Hoploscaphites. 7.1, H. nebrascensis macroconch (YPM 23147). A section (black box) of the lateral surface of the shell near the base of the body chamber is magnified to demonstrate that tubercles (topographically, a round hill) can show nearly all aspect classes. Note the circled tubercle within the box; it exhibits all aspect classes. Therefore, ammonoids with many tubercles should have higher OPC values. The H. nebrascensis specimen shown here has an OPC value of 57,759 patches. 7.2, H. spedeni macroconch (YPM 44402). A section (black box) of the lateral surface of the shell at the point of recurvature on the body chamber is magnified to demonstrate that ribs (topographically, an extended ridge) show alternating aspect classes. Therefore, ammonoids with few tubercles (i.e., rib dominated) should have lower OPC values. The H. spedeni specimen shown here has an OPC value of 35,678 patches.
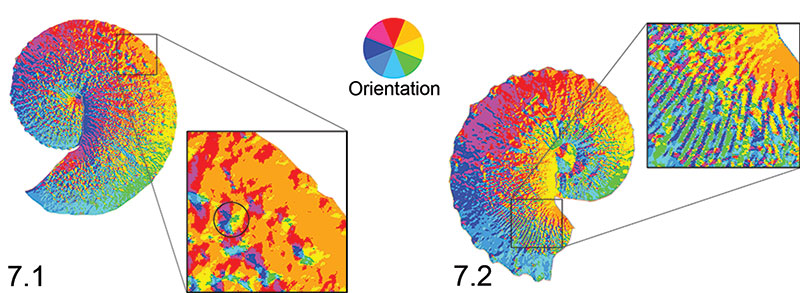
FIGURE 8. Reduced major axis regression of Orientation Patch Count (OPC) vs. maximum shell length (LMAX, mm). OPC values are positively correlated with maximum shell length, indicating that the largest specimens, which tend to be the most tuberculate, have the largest OPC values.
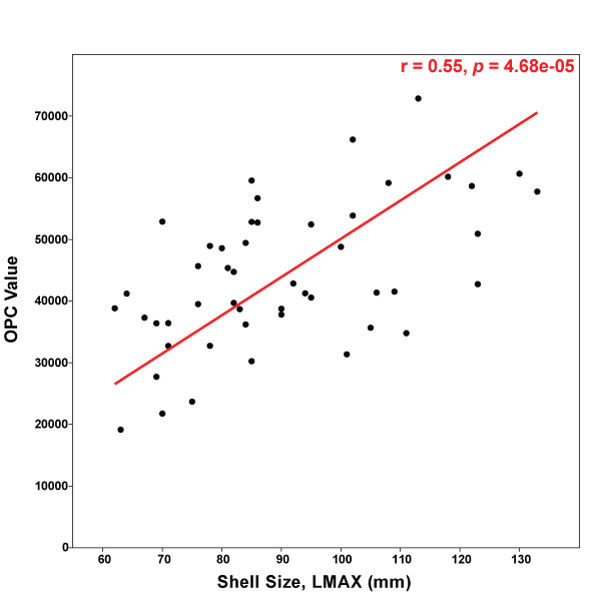
FIGURE 9. Frequency histograms of OPC value for whole shells, body chambers and phragmocones, comparing two dimorphs. Macroconchs (gray bars, blue normality curve) and microconchs (black bars, red normality curve) were compared for both Hoploscaphites spedeni and H. nebrascensis separately. Student's t and F tests were applied to compare the distributions of these data. 9.1, Frequency histogram of OPC value for H. spedeni whole shells. Macroconchs had a significantly larger mean OPC than microconchs at 95% confidence. 9.2, Frequency histogram of OPC value for H. spedeni body chambers; no statistically significant differences between dimorphs. 9.3, Frequency histogram of OPC value for H. spedeni phragmocones; no significant differences between dimorphs. 9.4, Frequency histogram of OPC value for H. nebrascensis whole shells; no significant differences between dimorphs. 9.5, Frequency histogram of OPC value for H. nebrascensis body chambers; no significant difference between dimorphs. 9.6, Frequency histogram of OPC value for H. nebrascensis phragmocones; no significant difference between dimorphs.
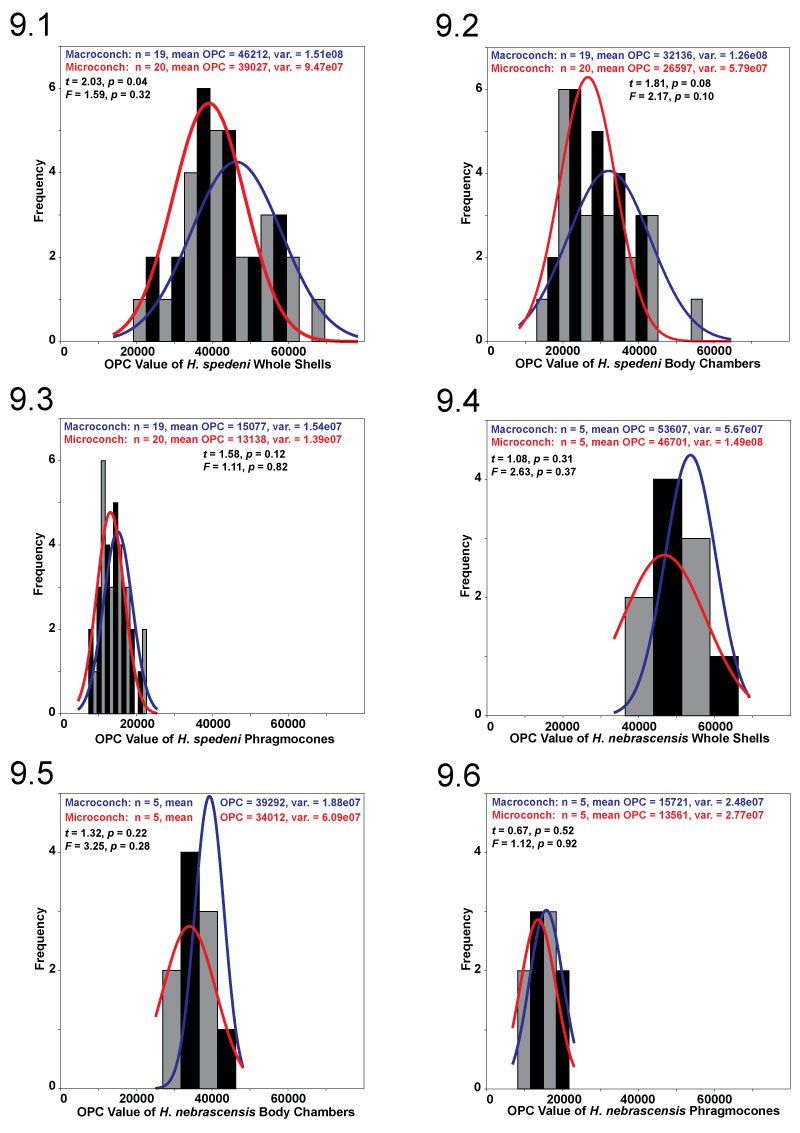
FIGURE 10. Frequency histograms of OPC value for whole shells, body chambers, and phragmocones, comparing two Hoploscaphites species. Macroconchs for both Hoploscaphites spedeni (gray bars, blue normality curve) and H. nebrascensis (black bars, red normality curve) were compared to each other separately from microconchs of H. spedeni (gray bars, blue normality curve) and H. nebrascensis (black bars, red normality curve). Student's t and F tests were applied to compare the distributions of these data. No statistically significant differences were determined at 95% confidence in all comparisons. 10.1, Frequency histogram of OPC value for H. spedeni and H. nebrascensis macroconch whole shells. 10.2, Frequency histogram of OPC value for H. spedeni and H. nebrascensis macroconch body chambers. 10.3, Frequency histogram of OPC value for H. spedeni and H. nebrascensis macroconch phragmocones. 10.4, Frequency histogram of OPC value for H. spedeni and H. nebrascensis microconch whole shells. 10.5, Frequency histogram of OPC value for H. spedeni and H. nebrascensis microconch body chambers. 10.6, Frequency histogram of OPC value for H. spedeni and H. nebrascensis microconch phragmocones.
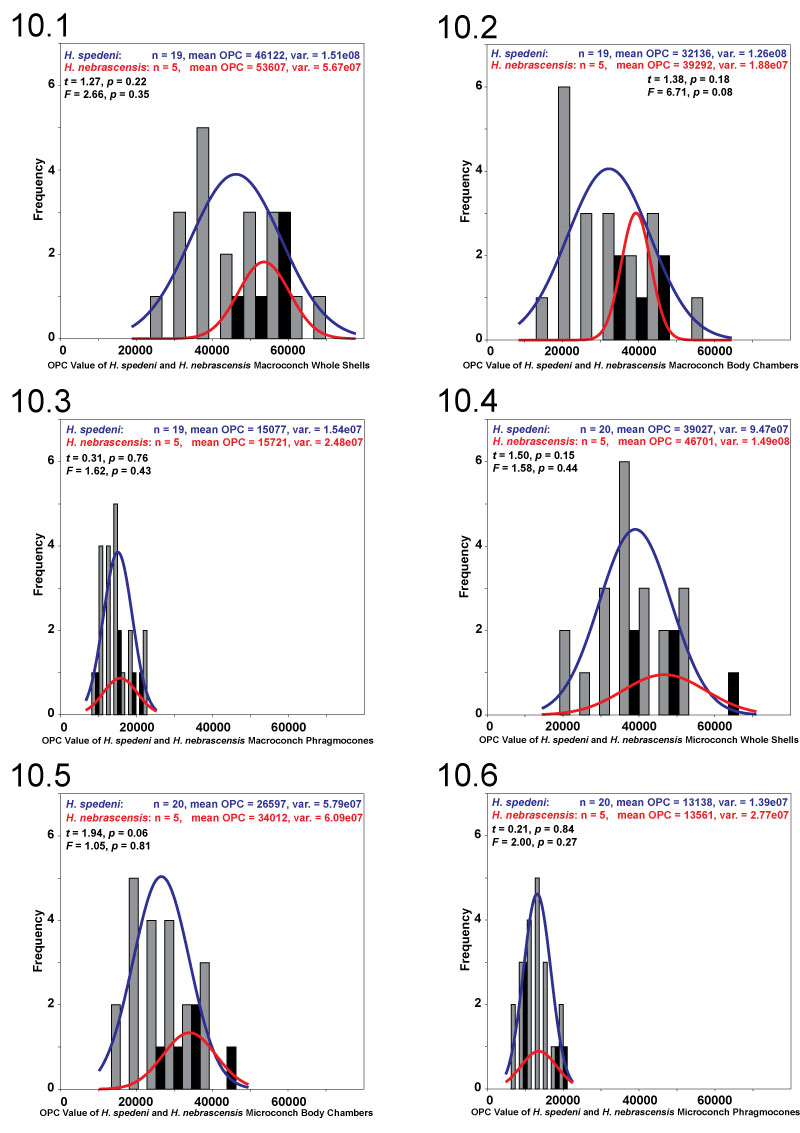
FIGURE 11. Surface-to-planimetric (3D to 2D) area ratio. Large-scale topographic features are most likely being quantified by this metric. These features may include the degree of shell compression or flank convexity, the size and overall shape of the ventrolateral tubercles around the margins of the shell, some combination of both, or some other shell feature(s). 11.1, Hoploscaphites spedeni macroconch (YPM 23124) with the typical morphotype exhibiting flank convexity or depression (more "High" 3D to 2D area ratio coloration around the margins). 11.2, H. nebrascensis macroconch (YPM 23145) exhibiting the relatively compressed, or flattened, flank shape (less "High" 3D to 2D area ratio coloration around the margins and uniformity in overall coloration).
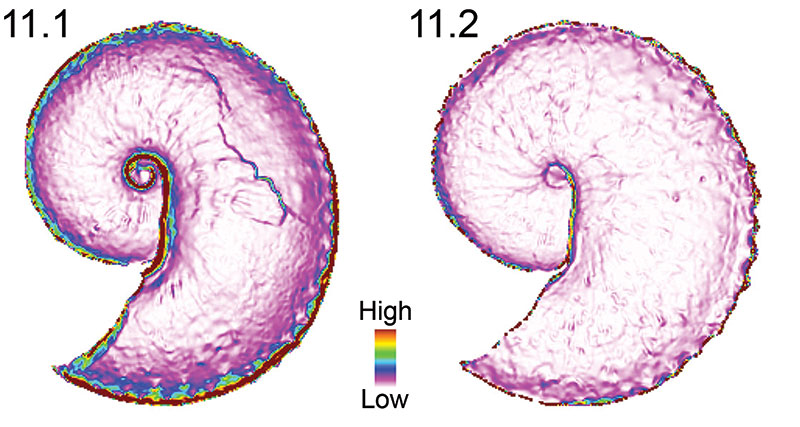
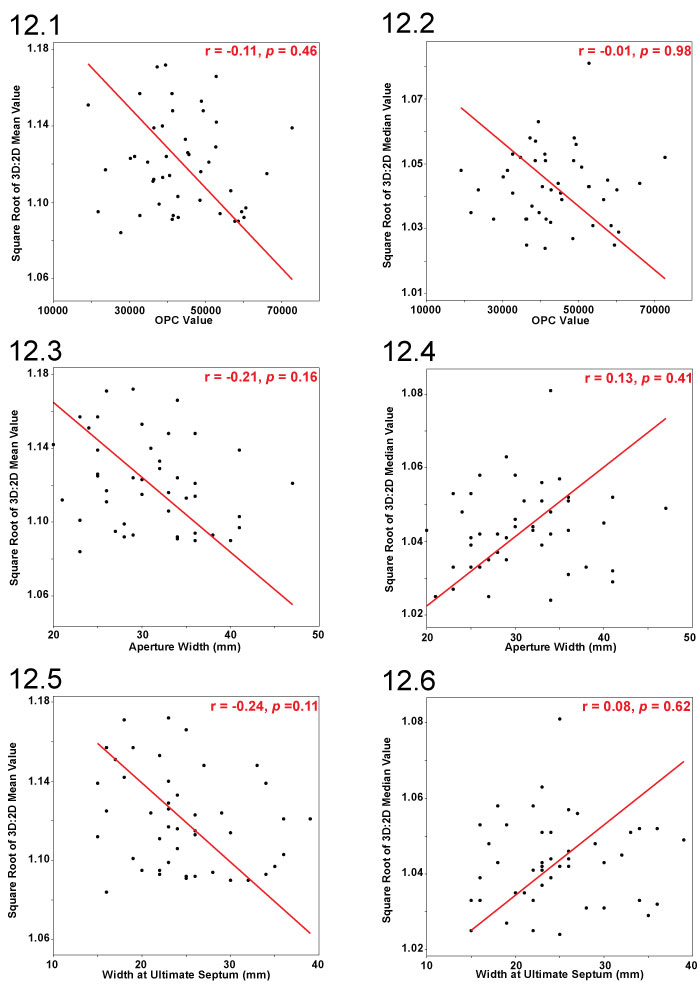
FIGURE 12. Reduced major axis regression of the square root of the surface-to-planimetric (3D to 2D) area ratio mean and median cell values versus different morphometric variables. 12.1, No statistically significant linear correlation between the square root of the mean area ratios and OPC values. 12.2, No statistically significant linear correlation between the square root of the median area ratios and OPC values. The lack of correlation between these two independent surface ruggedness indices indicates that these two metrics are measuring two different shell characters or aspects of shell characters. 12.3, No statistically significant linear correlation between the square root of the mean area ratios and aperture width (mm). 12.4, No statistically significant linear correlation between the square root of the median area ratios and aperture width (mm). 12.5, No statistically significant linear correlation between the square root of the mean area ratios and width of the shell at the ultimate septum (mm). 12.6, No statistically significant correlation between the square root of the median area ratios and width of the shell at the ultimate septum (mm).

 A Review of Handbook of Paleoichthyology Volume 8a: Actinopterygii I, Palaeoniscimorpha, Stem Neopterygii, Chondrostei
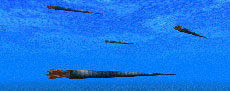 Palaeontologia Electronica among the most influential palaeontological journals