

Volume 28.2
May–August 2025
Full table of contents
ISSN: 1094-8074, web version;
1935-3952, print version
Recent Research Articles
See all articles in 28.2 May-August 2025
See all articles in 28.1 January-April 2025
See all articles in 27.3 September-December 2024
See all articles in 27.2 May-August 2024
Interested in submitting a paper to Palaeontologia Electronica?
Click here to register and submit.
 |
||||
 |
||||
Article Search
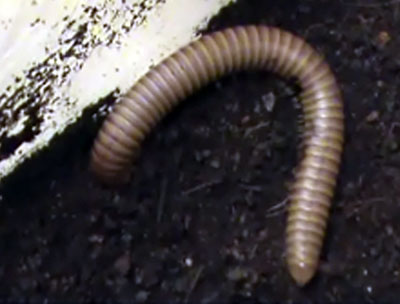
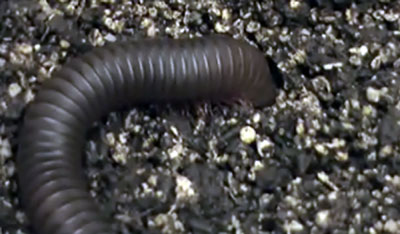
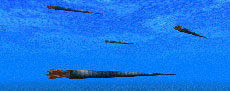
FIGURE 1. Millipede morphology and distribution. 1. Diagram of Narceus americanus showing the head, first five segments, and three diplosegments. 2. Distribution map of N. americanus after Shelley et al. (2006). Inset map shows the distribution of Floridobolus penneri in central Florida. 3. Coiled N. americanus individual used in this study. 4. Narceus americanus from the Smoky Mountains, Tennessee. 5. A F. penneri individual used in this study. Scale bar equals 1 cm.
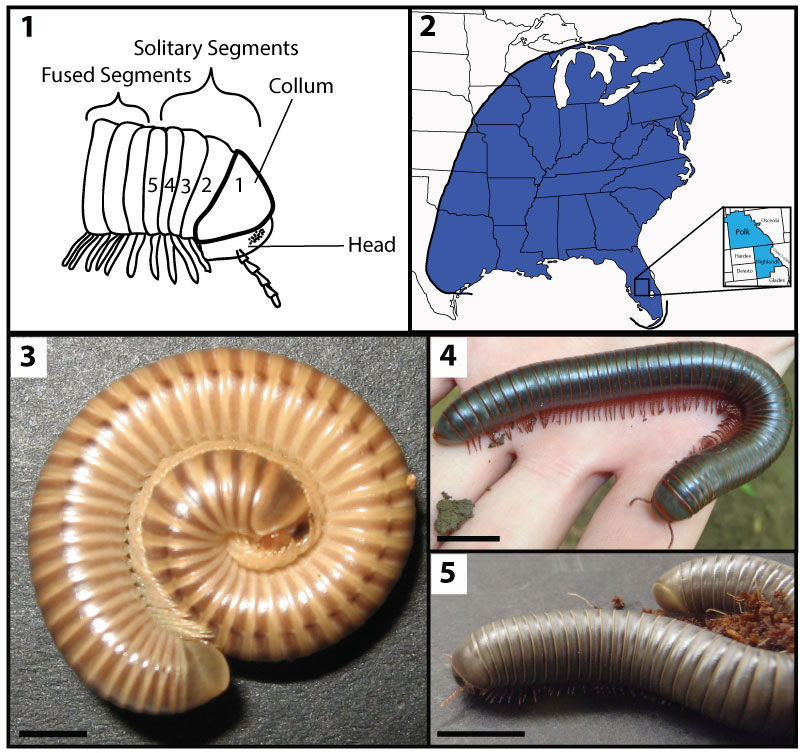
FIGURE 2. Diagrams of quantitative burrow measurements. 1. Burrows were described using the mean of the angle at which they entered the subsurface (a) and the angle at which they shift below the surface (a1), total length (L), branching angle (BA), maximum depth below the surface (D), shaft and chamber width (w), height (h), and circumference (c). 2. The complexity of a burrow system is the sum of the number of entrances (e), segments (s), and chambers (ch). 3. The tortuosity of a burrow system is the mean sinuosity of all burrow segments in the system. A single segment's tortuosity is the total length of the segment (u) divided by the straight line distance (v).
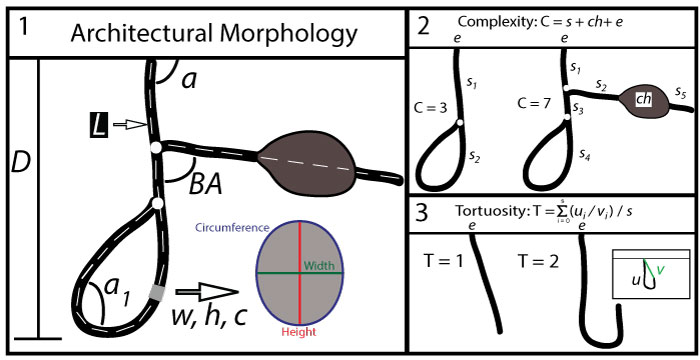
FIGURE 3. Dominant burrow architectures and modifications produced by Narceus americanus and Floridobolus penneri. Percents given include burrows produced by both N. americanus and F. penneri. Complexity (C) and tortuosity (T) are the average values for each burrow type. 1. Dominant architectures produced by the millipedes. 2. Modifications to dominant architectures that affect the quantitative properties. Black portions of the illustration represent the modifying structures while gray portions represent the modified dominant architecture.
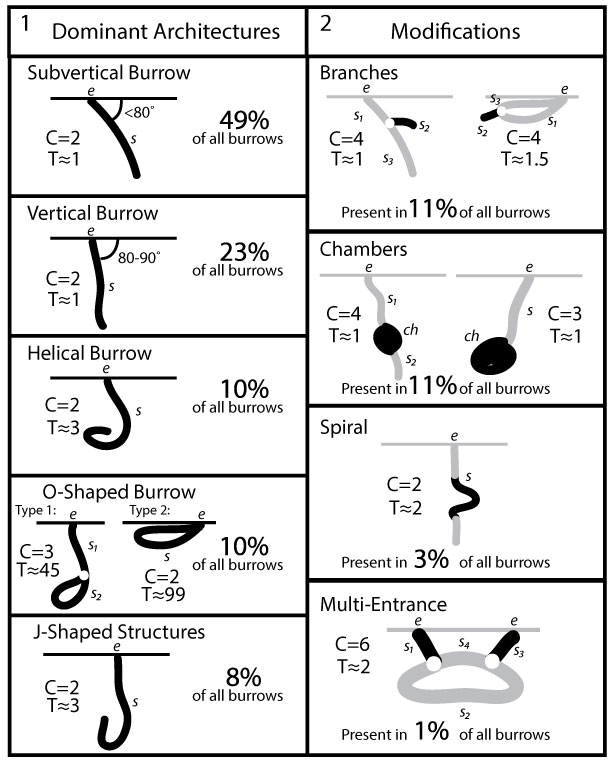
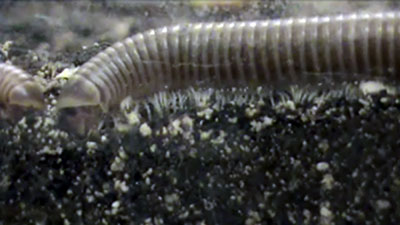
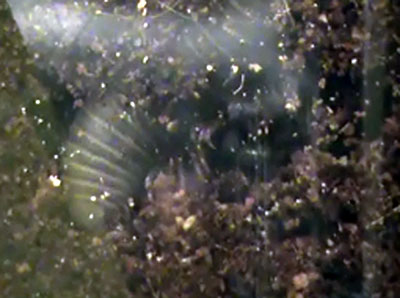
FIGURE 4. Time lapse photographs of Narceus americanus burrowing in 50O/50S sediment with 35% moisture content. The photos are taken at approximately two minute intervals.
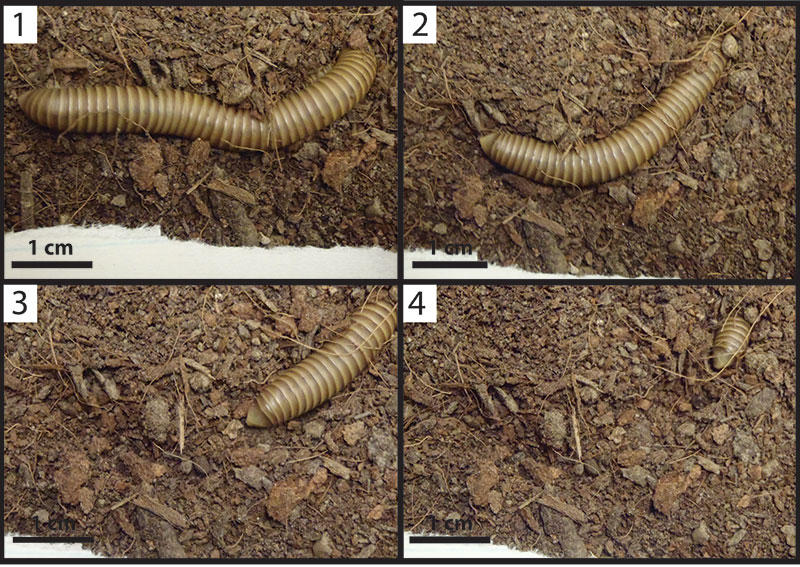
FIGURE 5. Behaviors exhibited by Floridobolus penneri. 1. Experiment with 50O/50S sediment, 49% moisture content with five individuals in a 65 gallon terrarium. Two millipedes are in chambers against the glass. Inset: Large chamber with a coiled millipede; molting was later observed in this chamber. 2. Molting individual at the sediment surface. 3. Millipede excavated from 5 cm below the surface of a 50Sa/50S, 70% moisture content experiment; the white line indicates the sediment surface.
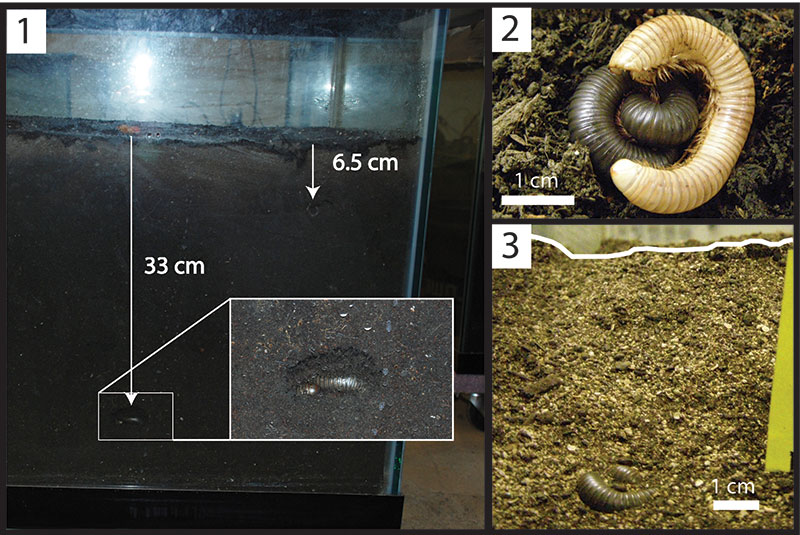
FIGURE 6. Surface traces produced by Narceus americanus and Floridobolus penneri. 1. Surface furrowing and a shallow burrow produced by N. americanus in 50O/50S sediment with 35% moisture content. 2. Surface furrowing (at arrows) produced by F. penneri in 25Sa/75S sediment with 50% moisture content. 3. Trails (at arrows) produced around the edges of a terrarium. 4. Close-up of a trail (at arrows) along the terrarium edge outlined by large grains in 50O/50S sediment. 5. Burrow entrance produced by F. penneri in 50Sa/50S sediment. 6. Burrow entrance produced by N. americanus in 50O/50S sediment.
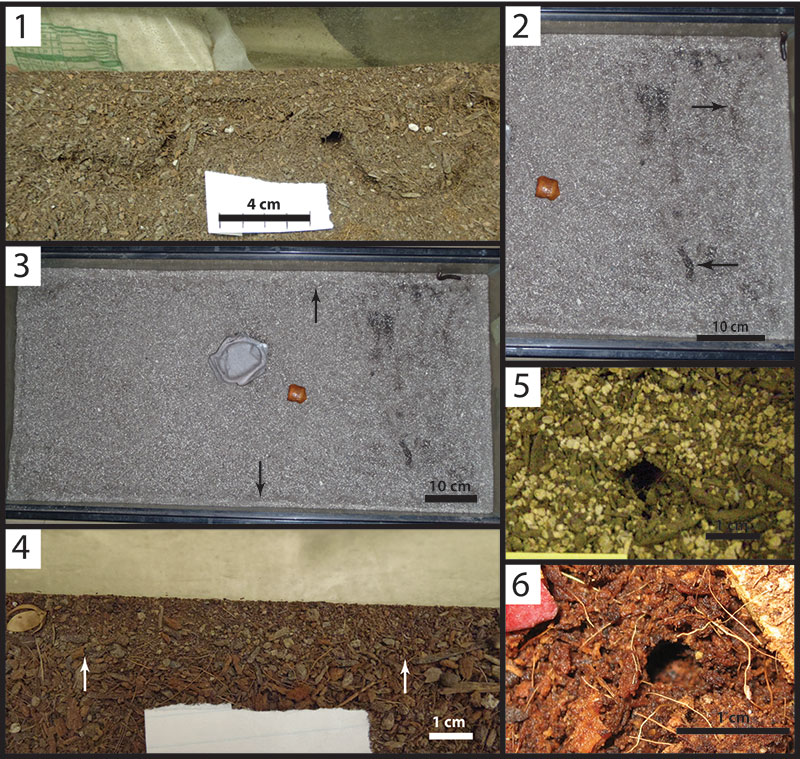
FIGURE 7. Surficial features. 1. Vertically oriented, wedge-shaped indent at the end of NA21F. Photograph taken from below the burrow cast at an oblique angle. 2. Vertically oriented, wedge-shaped indent at the end of NA26A. Photograph taken from below the burrow cast at an oblique angle. 3–5. Fecal pellets in the walls, floors, endpoints, and chambers of three Floridobolus penneri burrows (FP7H, FP7F, FP7G).
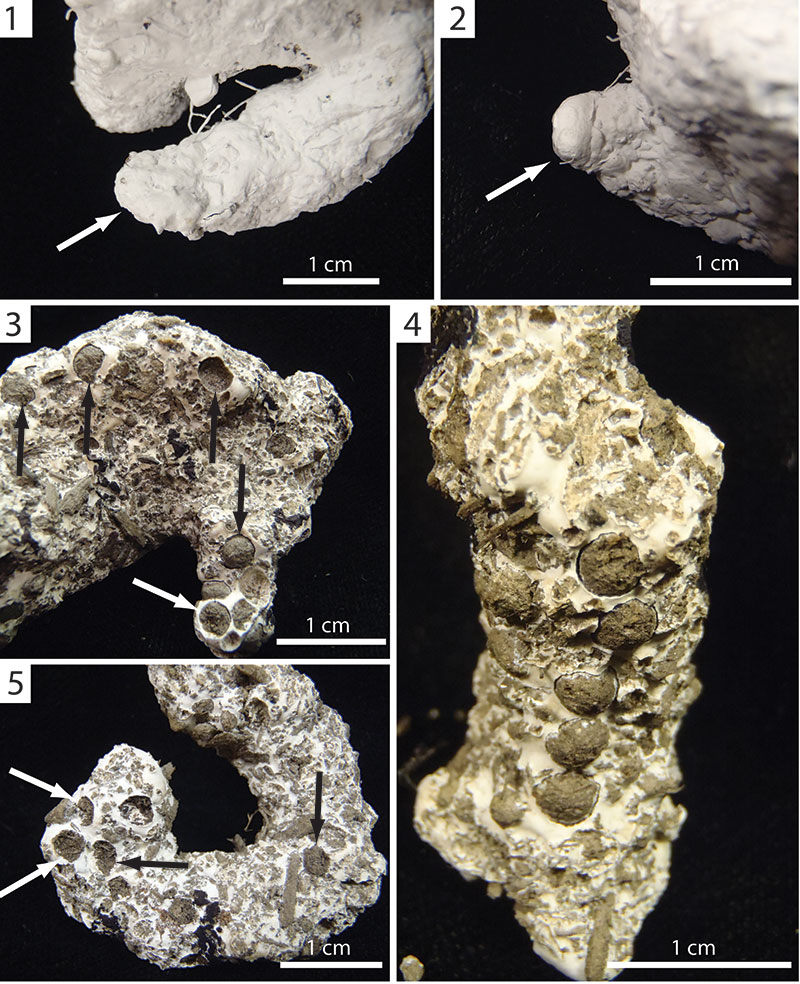
FIGURE 8. Vertical burrows produced by Narceus americanus (1–3) and Floridobolus penneri (4–6). 1, 2. Side views of two simple, vertical burrows (NA30A, NA33A). 3. Oblique view of a vertical burrow with a terminal helical structure (NA30F). 4, 5. Side views of two simple, vertical burrows (FP2A, FP2B). 6. Side view of a vertical burrow with an intermediate helical modification (FP7D).
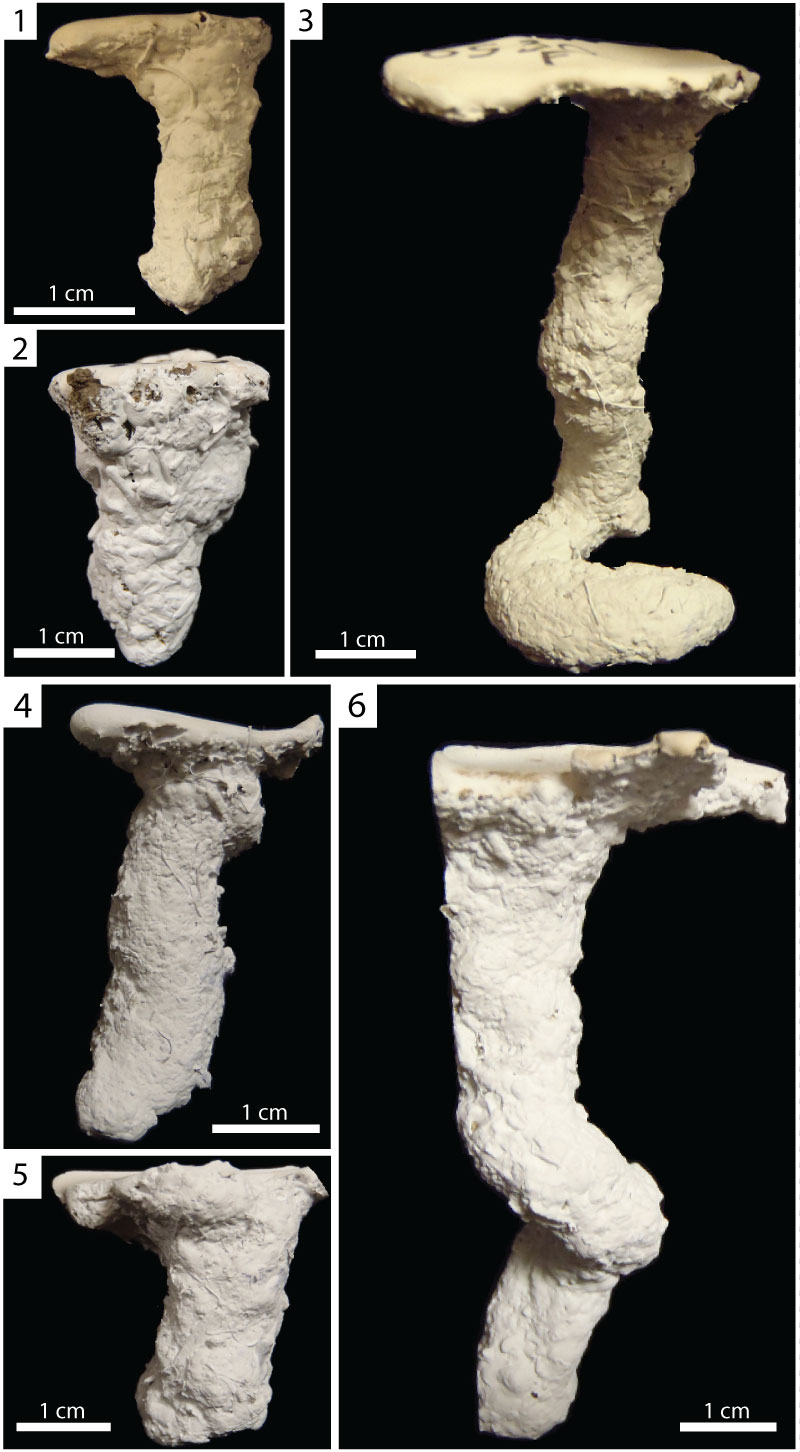
FIGURE 9. Subvertical burrows produced by Narceus americanus. 1. Side view of a simple, subvertical burrow (NA21C). 2. Side view of a simple, subvertical burrow (NA30D). 3. Front view of a subvertical burrow with a small branch near the entrance (NA21D). 4. Front view of a subvertical burrow with a small intermediate chamber (NA21E). 5. Side view of a subvertical burrow with a terminal chamber (NA26A) and a wedge-shaped indent (at arrow).
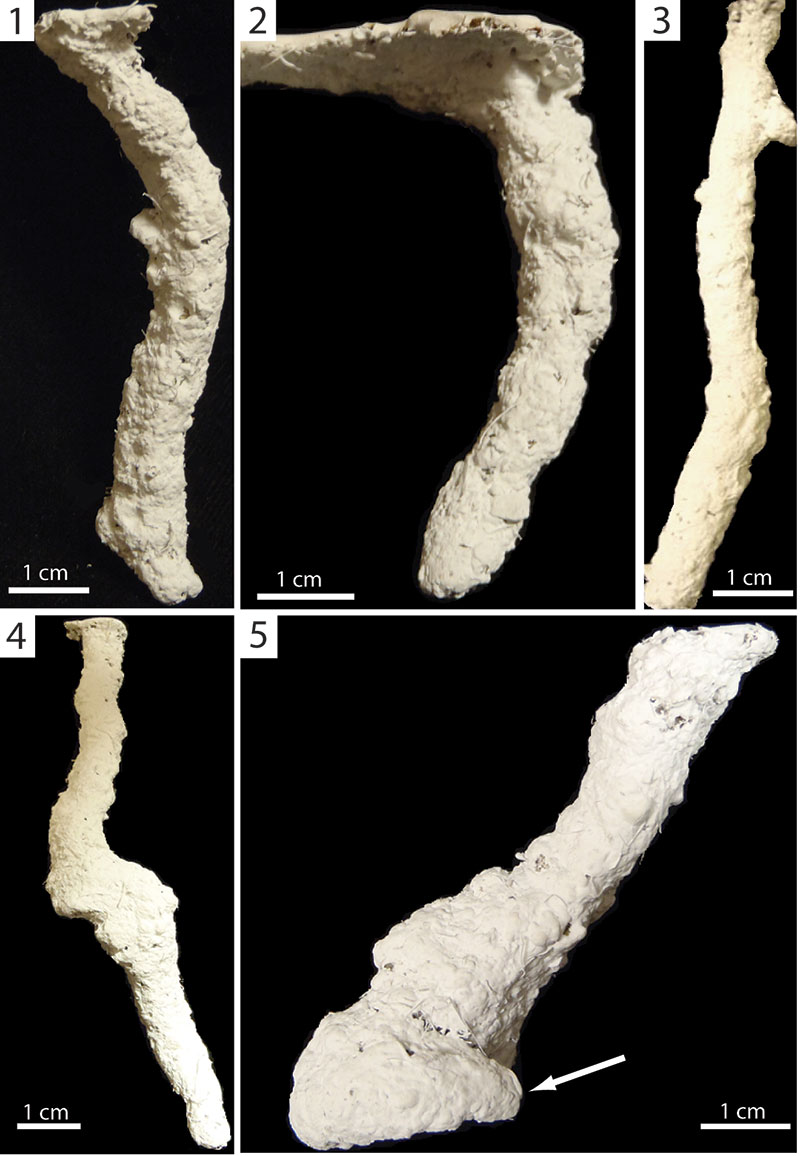
FIGURE 10. Subvertical burrows produced by Floridobolus penneri. 1. Front view of a simple, sinuous, subvertical burrow (FP2F). 2. Side view of a simple, subvertical burrow (FP2E). 3. Side view of a subvertical burrow with a small branch near the entrance (FP7F). 4. Side view of a subvertical burrow with a terminal chamber (FP5E). 5. Side view of a subvertical burrow with a large chamber and small branch (FP7H).
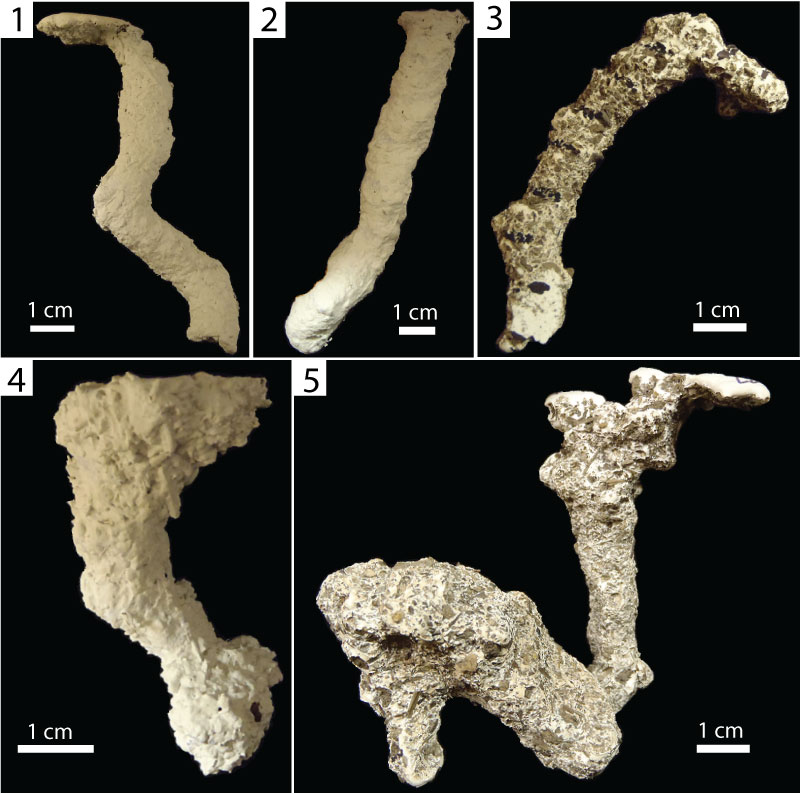
FIGURE 11. Helical burrows produced by Narceus americanus (1–3) and Floridobolus penneri (4–5). 1. Side view of a simple, helical burrow (NA25B). 2. Side view of a helical burrow with a small branch (NA29B). 3. Oblique view of a helical burrow with a chamber in the midsection of the burrow (NA21F) bearing a wedge-shaped indent (at arrow). 4. Side view of a simple, helical burrow (FP4B). 5. Oblique view of a helical burrow with two small branches (FP1).
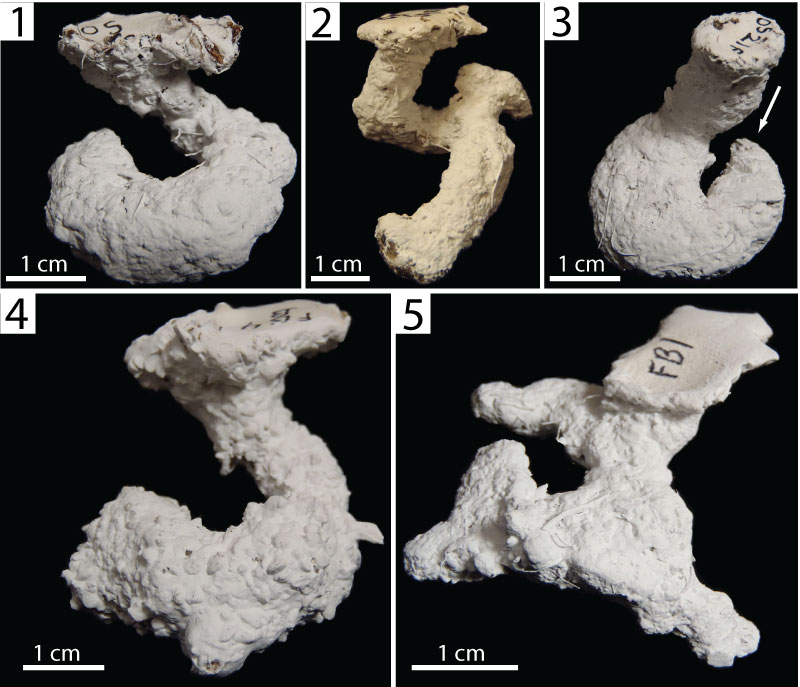
FIGURE 12. O-shaped burrows produced by Narceus americanus (1–4) and Floridobolus penneri (5–7). 1. Front oblique view of a horizontally oriented, Type 1 O-shaped burrow (NA29A). 2. Side view of a vertically oriented, Type 1 O-shaped burrow (NA26B). 3. Oblique view of the underside of a horizontally oriented, Type 2 O-shaped burrow with two surface openings (NA31A). 4. Side view of a Type 2 O-shaped burrow (NA31B). 5. Side view of a vertically oriented, Type 1 O-shaped burrow with two short branches (FP5F). 6. Front view of a vertically oriented, Type 1 O-shaped burrow with a chamber on one side of the O-shaped tunnel (FP6B). 7. Oblique side view of a Type 2 O-shaped burrow with a branch (FP5G).
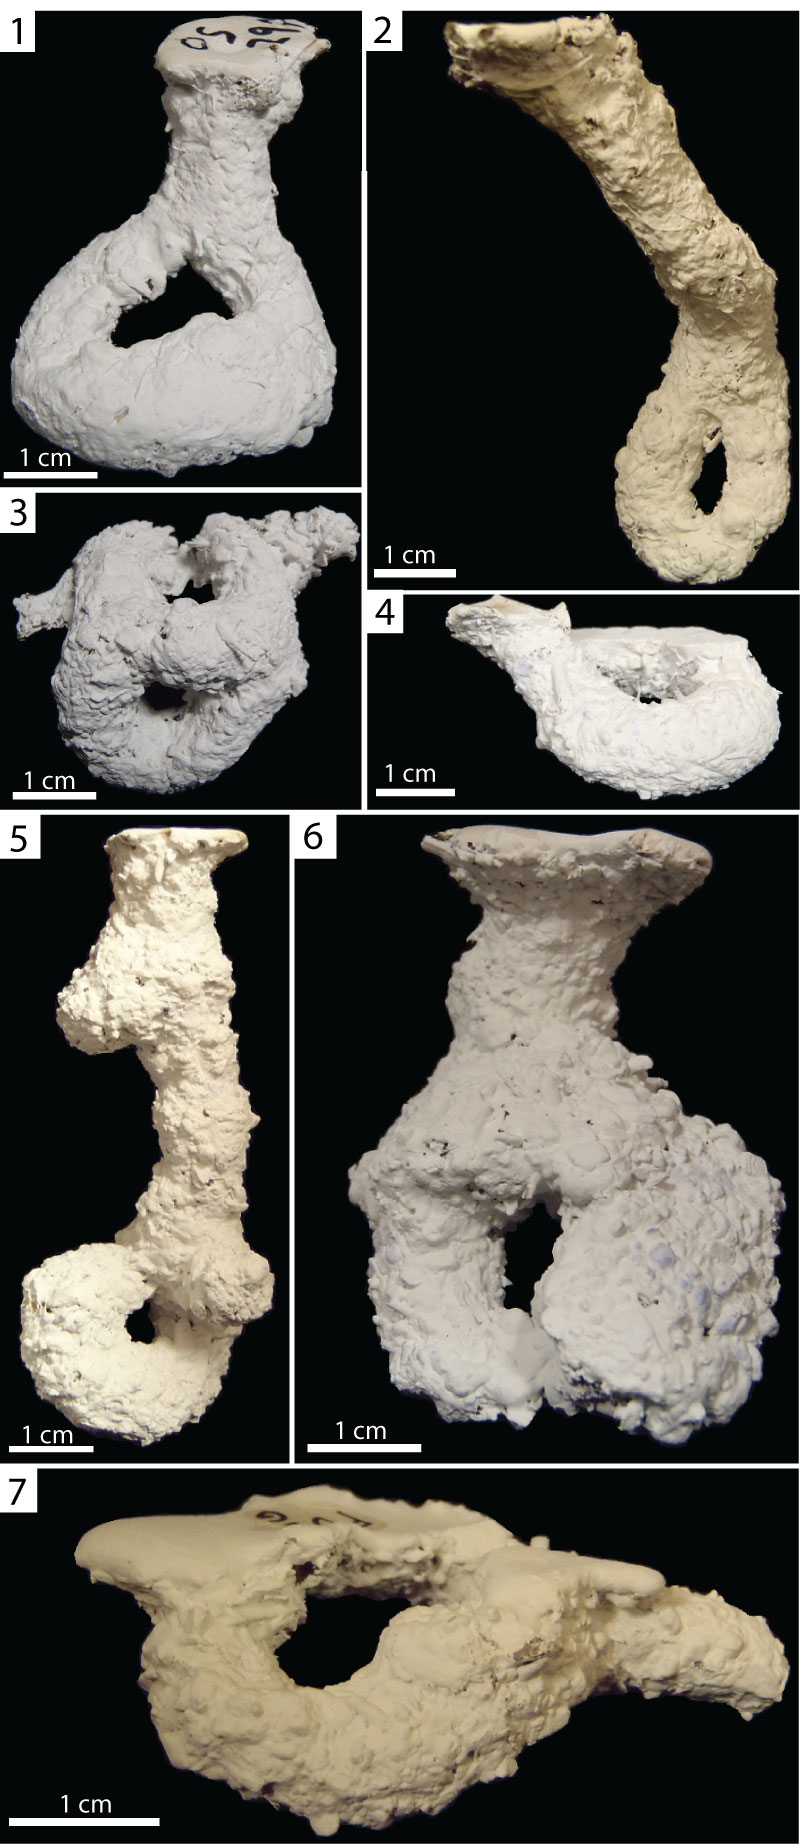
FIGURE 13. J-shaped burrows produced by Floridobolus penneri. 1. Front view of a simple, J-shaped burrow (FP2J). 2. Front view of a simple, J-shaped burrow (FP2I). 3. J-shaped burrow with a branch near the entrance (FP2H).
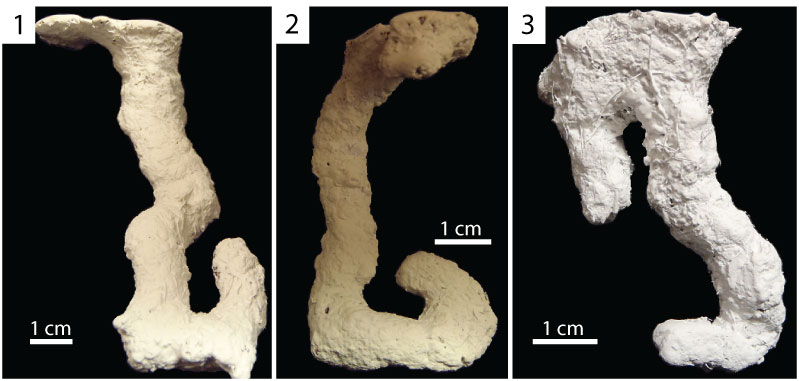
FIGURE 14. Summary of Bray Curtis similarity test results for the burrows of the four millipede species. Values are arithmetic means of the similarity values produced when burrows of similar or different architectures are compared. Total Avg columns represent the mean value of similarity when all burrows produced by one species are compared to those produced by itself or another species. Values of 0.9–0.8 indicate high similarity, 0.7–0.6 indicate moderate similarity, and values of 0.5 or less indicate dissimilarity. Values of 1.0 indicate that there was only one burrow produced of that architecture by that species.
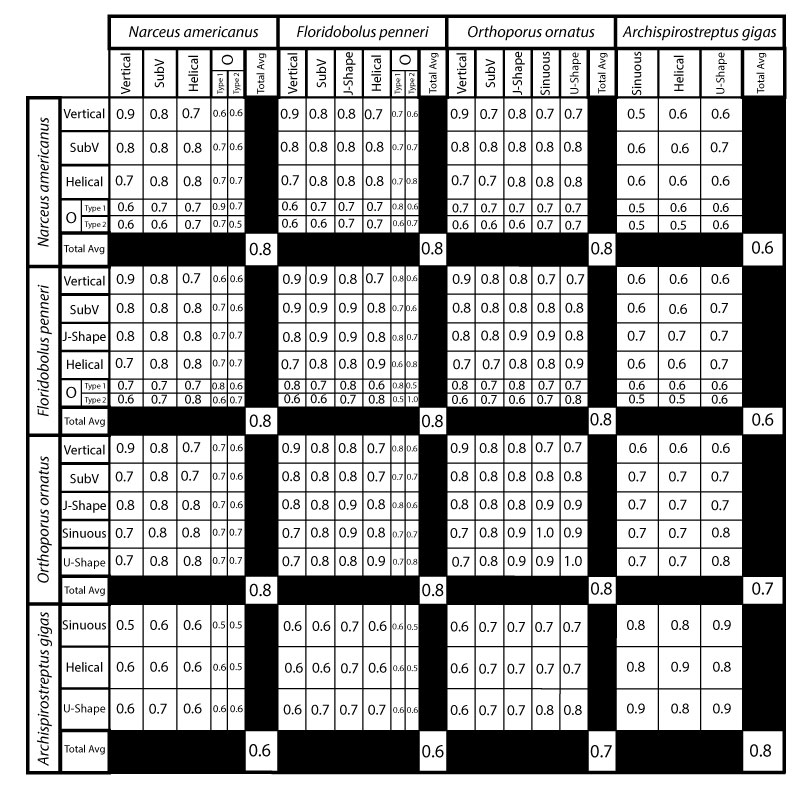
FIGURE 15. Bray Curtis cluster diagram comparing the 29 burrow casts produced by Narceus americanus. Burrow cast ID numbers are color coded by architecture: red = subvertical burrow; blue = vertical burrow; orange = helical burrow; purple = O-shaped burrow. Branch points near the top of the diagram indicate higher levels of similarity. Key branch points are marked with their similarity value (at arrows). Values > 0.80 indicate high similarity, 0.79–0.60 indicate moderate similarity, and values of 0.59 or less indicate dissimilarity. Groups of burrow casts found to be most similar are marked with brackets and their level of similarity.
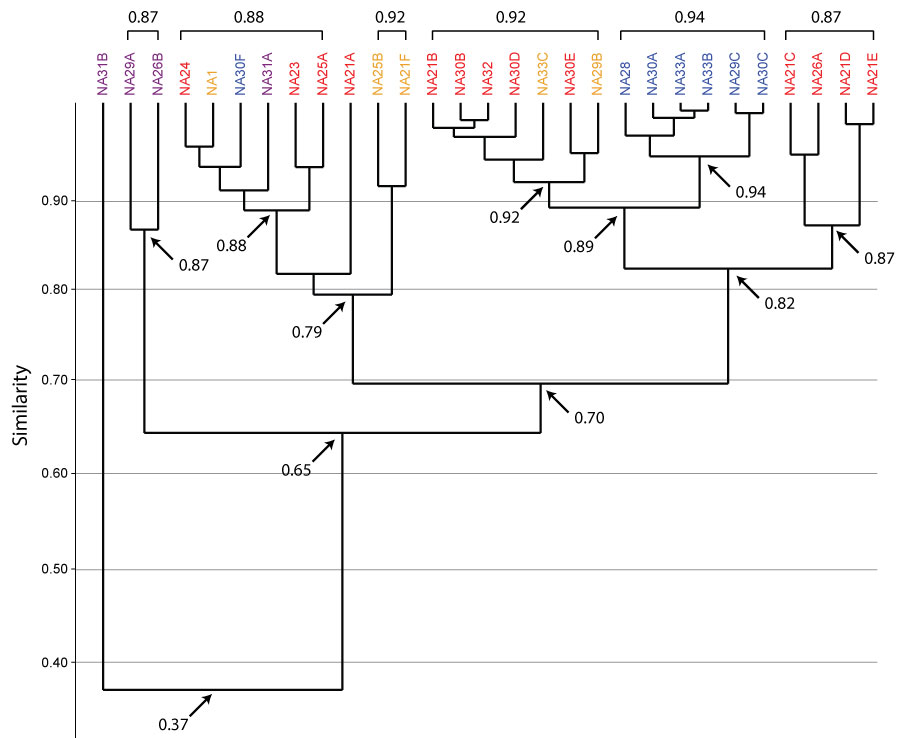
FIGURE 16. Bray Curtis cluster diagram comparing the 42 burrow casts produced by Floridobolus penneri. Burrow cast ID numbers are color coded by architecture: red = subvertical burrow; blue = vertical burrow; orange = helical burrow; purple = O-shaped burrow; green = J-shaped burrow. Branch points near the top of the diagram indicate higher levels of similarity. Key branch points are marked with their similarity value (at arrows). Values > 0.80 indicate high similarity, 0.79–0.60 indicate moderate similarity, and values of 0.59 or less indicate dissimilarity. Groups of burrow casts found to be most similar are marked with brackets and their level of similarity.
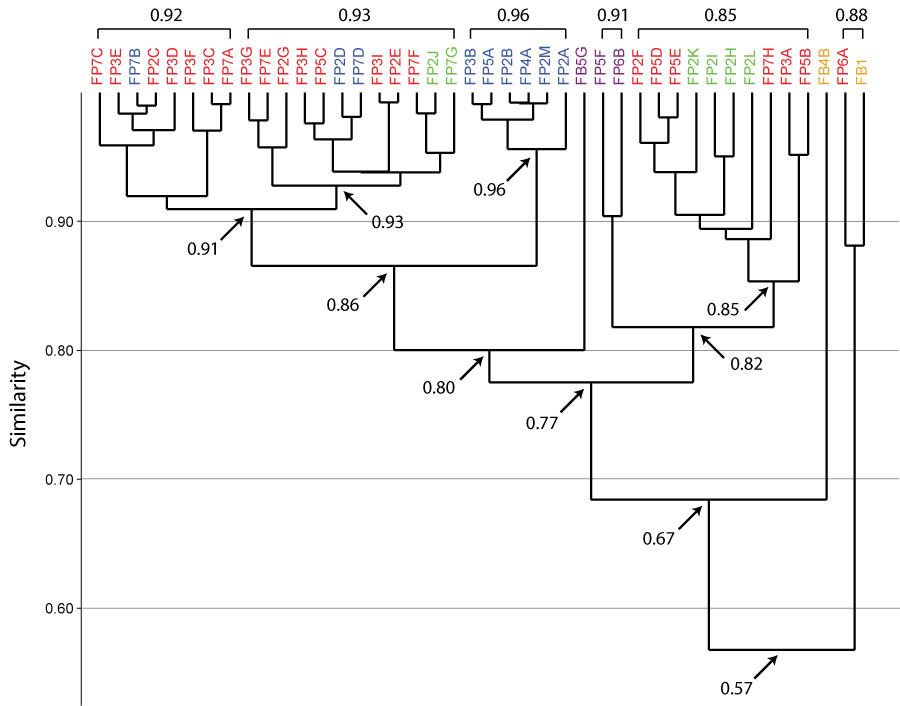
FIGURE 17. Bray Curtis cluster diagram comparing the 71 burrow casts produced by Narceus americanus (NA) and Floridobolus penneri (FP; shaded gray). Burrow cast ID numbers are color coded by architecture: red = subvertical burrow; blue = vertical burrow; orange = helical burrow; purple = O-shaped burrow; green = J-shaped burrow. Branch points near the top of the diagram indicate higher levels of similarity. Key branch points are marked with their similarity value (at arrows). Values > 0.80 indicate high similarity, 0.79–0.60 indicate moderate similarity, and values of 0.59 or less indicate dissimilarity. Groups of burrow casts found to be most similar are marked with brackets and their level of similarity.
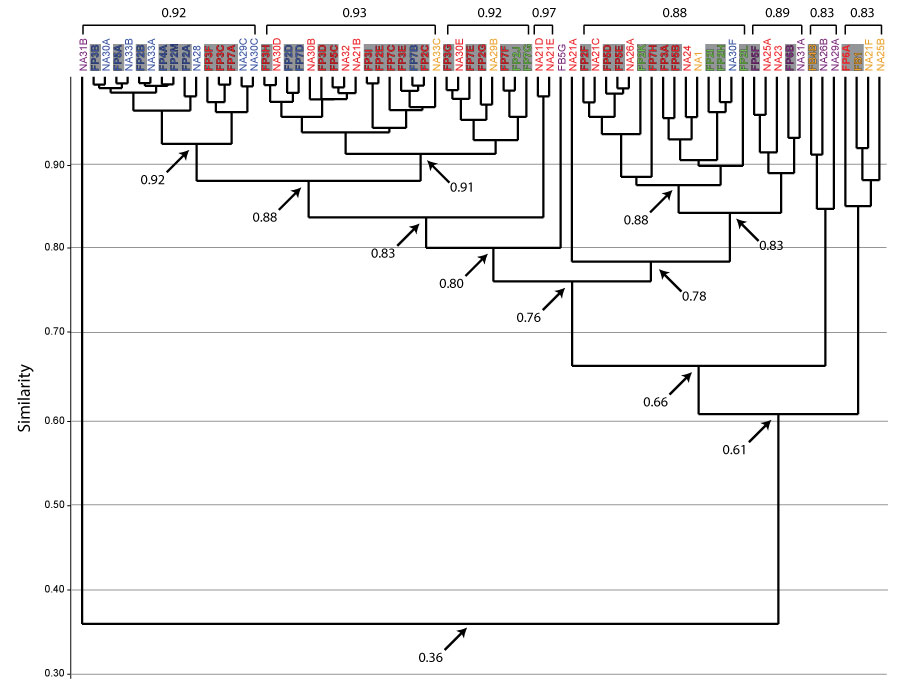
FIGURE 18. Bray Curtis cluster diagram comparing the 71 burrow casts produced by Narceus americanus (NA) and Floridobolus penneri (FP) with 13 burrow casts produced by Orthoporus ornatus (OO; shaded gray) from Hembree (2009). Burrow cast ID numbers are color coded by architecture: red = subvertical burrow; blue = vertical burrow; orange = helical burrow; purple = O-shaped burrow; green = J-shaped burrow. Branch points near the top of the diagram indicate higher levels of similarity. Key branch points are marked with their similarity value (at arrows). Values > 0.80 indicate high similarity, 0.79–0.60 indicate moderate similarity, and values of 0.59 or less indicate dissimilarity. Groups of burrow casts found to be most similar are marked with brackets and their level of similarity.
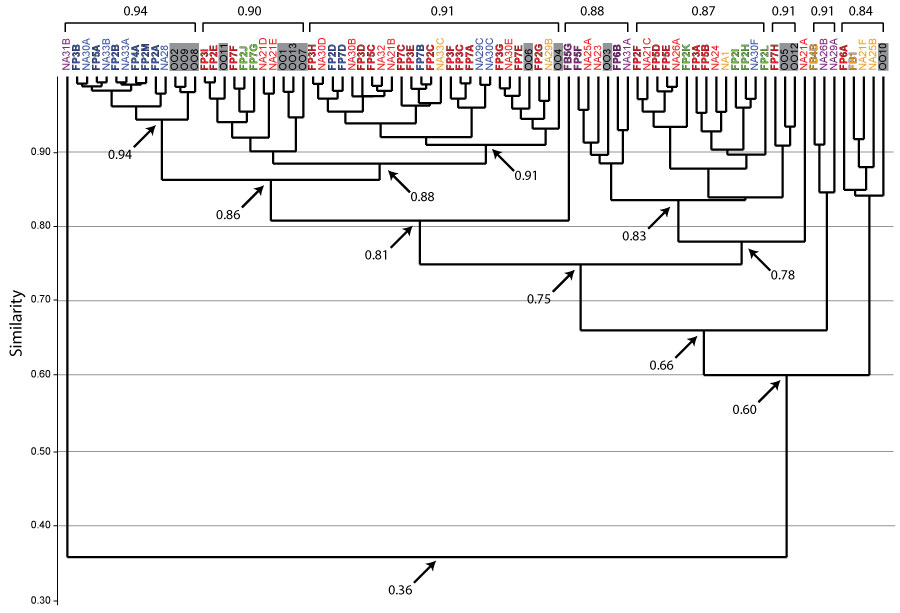
FIGURE 19. Bray Curtis cluster diagram comparing the 71 burrow casts produced by Narceus americanus (NA) and Floridobolus penneri (FP) with 8 burrow casts produced by Archispirostreptus gigas (AG; shaded gray) from Hembree (2009). Burrow cast ID numbers are color coded by architecture: red = subvertical burrow; blue = vertical burrow; orange = helical burrow; purple = O-shaped burrow; green = J-shaped burrow. Branch points near the top of the diagram indicate higher levels of similarity. Key branch points are marked with their similarity value (at arrows). Values > 0.80 indicate high similarity, 0.79–0.60 indicate moderate similarity, and values of 0.59 or less indicate dissimilarity. Groups of burrow casts found to be most similar are marked with brackets and their level of similarity.
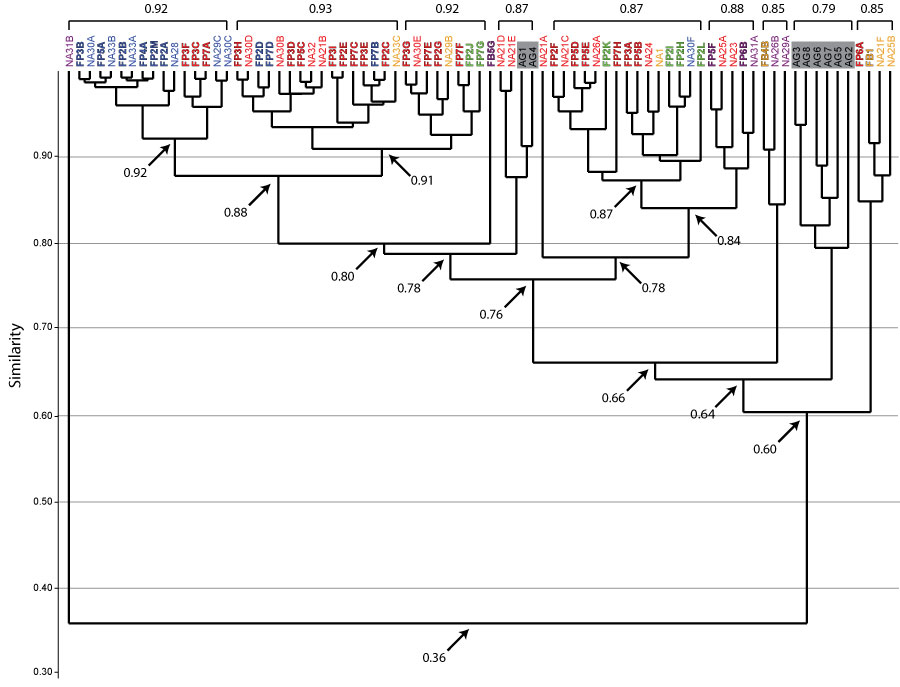
FIGURE 20. Bray Curtis cluster diagram comparing the 21 burrow casts produced by Orthoporus ornatus (OO) and Archispirostreptus gigas (AG). Branch points near the top of the diagram indicate higher levels of similarity. Key branch points are marked with their similarity value (at arrows). Values > 0.80 indicate high similarity, 0.79–0.60 indicate moderate similarity, and values of 0.59 or less indicate dissimilarity. Groups of burrow casts found to be most similar are marked with brackets and their level of similarity.
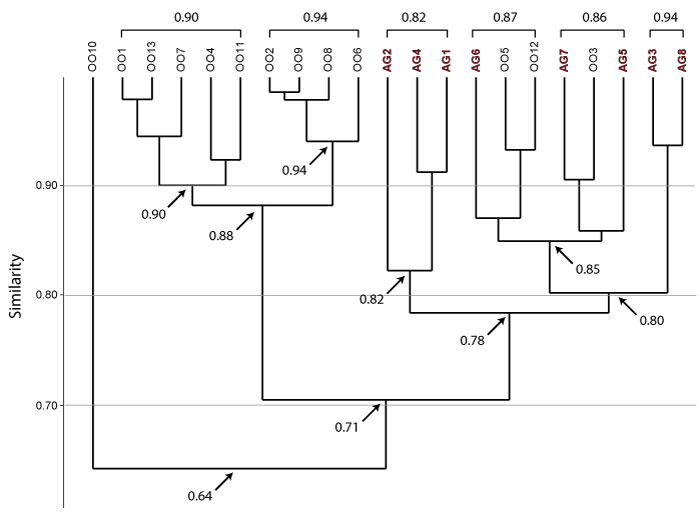
TABLE 1. Experimental parameters and associated burrow architectures. Terrarium sizes are in gallons. Sediment indicates the relative percentage of O = organic (coconut fiber), S = soil (clay loam), and Sa = fine- to medium-grained carbonate sand. Depth is the total depth of the sediment in centimeters. % Moisture is the mean moisture content of the sediment. Duration is split into two categories: expected time to completion of trial and the actual trial duration (in parentheses). Key to burrow architectures and modifications: V = vertical burrow, SV = subvertical burrow, H = helical burrow, J = J-shaped burrow, O = O-shaped burrow (T1=Type 1, T2=Type 2), c = chamber(s), b = branch(es), m = multiple entrances.
|
Experiment 1: Basic Morphology |
||||||||
|
Species |
Specimens |
Terrarium |
Sediment |
Depth |
% Moisture |
Duration |
Burrow #s |
Burrow Architectures |
|
N. americanus |
5 |
30 |
50/50 (O/S) |
20 |
37% |
7 (12) |
NA26 A-B |
SV, O (T1) |
|
N. americanus |
5 |
65 |
50/50 (O/S) |
45 |
32% |
7 (12) |
NA23 |
SV |
|
N. americanus |
1 |
30 |
50/50 (O/S) |
20 |
35% |
7 (8) |
No Burrow |
None |
|
N. americanus |
1 |
30 |
50/50 (O/S) |
20 |
30% |
7 (8) |
NA24 |
SVc |
|
N. americanus |
1 |
65 |
50/50 (O/S) |
45 |
40% |
7 (7) |
NA28 |
V |
|
N. americanus |
5 |
30 |
50/50 (O/S) |
20 |
35% |
14 (21) |
NA25 A-B |
SV, H |
|
N. americanus |
5 |
65 |
50/50 (O/S) |
43 |
37% |
14 (14) |
NA21 A-F |
SV, SVb, SVc, Hc |
|
N. americanus |
1 |
30 |
50/50 (O/S) |
20 |
35% |
14 (14) |
NA1 |
H |
|
N. americanus |
1 |
65 |
50/50 (O/S) |
45 |
35% |
14 (19) |
No Burrow |
None |
|
Experiment 2: Sediment Composition |
||||||||
|
Species |
Specimens |
Tank Size |
Sediment |
Depth |
% Moisture |
Duration |
Burrow #s |
Burrow Architectures |
|
F. penneri |
5 |
30 |
50/50 (Sa/S) |
16 |
50% |
14 (94) |
FP6 A-E |
SV, OC (T1) |
|
F. penneri |
5 |
65 |
100 (S) |
39 |
54% |
7 (8) |
FP7 A-H |
V, Vh, SV,SVb, SVcb, J |
|
F. penneri |
4 |
30 |
50/50 (Sa/S) |
19 |
70% |
14 (54) |
No Burrow |
None |
|
F. penneri |
5 |
30 |
25/75 (Sa/S) |
20 |
50% |
14 (14) |
FP5 A-G |
V, SV, SVc, O (T1), O (T2), Ob (T2) |
|
F. penneri |
1 |
30 |
50/50 (Sa/S) |
19 |
58% |
14 (19) |
FP4 A-B |
V, H |
|
F. penneri |
1 |
30 |
25/75 (Sa/S) |
20 |
52% |
14 (41) |
No Burrow |
None |
|
N. americanus |
5 |
30 |
25/75 (Sa/S) |
20 |
51% |
14 (23) |
NA32 |
SV |
|
N. americanus |
1 |
30 |
25/75 (Sa/S) |
20 |
60% |
14 (14) |
NA31 A-B |
O (T2), Om (T2) |
|
N. americanus |
1 |
65 |
100 (S) |
39 |
60% |
14 (51) |
NA33 A-C |
V, H |
|
Experiment 3: Sediment Moisture |
||||||||
|
Species |
Specimens |
Tank Size |
Sediment |
Depth |
% Moisture |
Duration |
Burrow #s |
Burrow Architectures |
|
F. penneri |
5 |
65 |
50/50 (O/S) |
45 |
49% |
14 (63) |
FP2 A-M |
V, SV, J, Jb |
|
F. penneri |
1 |
65 |
50/50 (O/S) |
45 |
50% |
14 (13) |
FP3 A-I |
V, SV |
|
F. penneri |
1 |
65 |
50/50 (O/S) |
45 |
50% |
14 (14) |
FP1 |
Hb |
|
N. americanus |
5 |
65 |
50/50 (O/S) |
48 |
50% |
14 (22) |
NA29 A-C |
V, H, O (T1) |
|
N. americanus |
1 |
65 |
50/50 (O/S) |
50 |
50% |
14 (21) |
NA30 A-F |
V, Vh, SV, SVc |
TABLE 2. Quantitative measurements of burrow casts produced by Narceus americanus.
|
NA32 |
NA23 |
NA25A |
NA21A |
NA21B |
NA21C |
NA30B |
NA30D |
NA21D |
NA24 |
NA21E |
NA26A |
NA30E |
|
|
Architecture |
SV |
SV |
SV |
SV |
SV |
SV |
SV |
SV |
SVb |
SVc |
SVc |
SVc |
SVc |
|
Surface Openings |
1 |
1 |
1 |
1 |
1 |
1 |
1 |
1 |
1 |
1 |
1 |
1 |
1 |
|
Maximum Depth (cm) |
4.1 |
6.7 |
3.0 |
1.9 |
4.0 |
7.1 |
2.6 |
5.9 |
11.9 |
4.0 |
13.4 |
5.8 |
6.6 |
|
Total Length (cm) |
4.3 |
8.2 |
9.4 |
2.3 |
4.3 |
8.0 |
3.1 |
6.8 |
13.8 |
7.2 |
15.7 |
6.8 |
7.5 |
|
Maximum Width (mm) |
9.3 |
16.9 |
11.7 |
13.0 |
14.5 |
11.5 |
9.6 |
10.8 |
11.7 |
17.6 |
16.8 |
26.2 |
16.5 |
|
Minimum Width (mm) |
8.5 |
8.0 |
7.8 |
10.5 |
11.0 |
8.8 |
9.5 |
7.5 |
8.6 |
7.1 |
7.2 |
11.2 |
6.0 |
|
Average Width (mm) |
8.8 |
10.4 |
10.2 |
11.8 |
12.4 |
9.3 |
9.6 |
9.3 |
10.2 |
10.9 |
10.5 |
15.6 |
11.4 |
|
Maximum Height (mm) |
9.8 |
9.5 |
10.1 |
12.5 |
12.3 |
8.8 |
9.8 |
10.9 |
11.6 |
9.7 |
10.4 |
16.4 |
10.0 |
|
Minimum Height (mm) |
8.6 |
7.3 |
5.7 |
11.8 |
10.5 |
7.4 |
8.2 |
8.1 |
6.3 |
6.0 |
5.8 |
8.9 |
7.0 |
|
Average Height (mm) |
9.2 |
8.3 |
7.9 |
12.2 |
11.4 |
8.1 |
9.0 |
9.4 |
9.3 |
8.0 |
9.1 |
11.6 |
8.4 |
|
Average W/H Ratio |
1.0 |
1.3 |
1.3 |
1.0 |
1.1 |
1.1 |
1.1 |
1.0 |
1.1 |
1.3 |
1.2 |
1.4 |
1.3 |
|
Maximum Circumference (cm) |
3 |
4.1 |
3.7 |
4.2 |
4.3 |
3.1 |
2.9 |
3.5 |
3.6 |
4.6 |
4.3 |
8.4 |
4.7 |
|
Minimum Circumference (cm) |
2.7 |
2.7 |
2.5 |
3.5 |
3.3 |
2.2 |
2.8 |
2.7 |
2.6 |
2.5 |
2.3 |
3.3 |
2.5 |
|
Average Circumference (cm) |
2.8 |
3.1 |
3.1 |
3.9 |
3.7 |
2.7 |
2.9 |
3.1 |
3.1 |
3.3 |
3.2 |
4.9 |
3.5 |
|
Maximum Slope (Degrees) |
70 |
65 |
45 |
33 |
73 |
90 |
70 |
80 |
90 |
67 |
81 |
55 |
90 |
|
Minimum Slope (Degrees) |
70 |
50 |
25 |
33 |
70 |
25 |
70 |
60 |
40 |
20 |
55 |
55 |
65 |
|
Average Slope (Degrees) |
70 |
38 |
35 |
33 |
72 |
57 |
70 |
70 |
63 |
44 |
64 |
55 |
78 |
|
Branching Angle (Degrees) |
n/a |
n/a |
n/a |
n/a |
n/a |
n/a |
n/a |
n/a |
60 |
n/a |
n/a |
n/a |
n/a |
|
Complexity |
2.0 |
2.0 |
2.0 |
2.0 |
2.0 |
2.0 |
2.0 |
2.0 |
4.0 |
3.0 |
4.0 |
3.0 |
4.0 |
|
Tortuosity |
1.0 |
1.2 |
1.7 |
1.0 |
1.1 |
1.1 |
1.2 |
1.2 |
1.1 |
1.5 |
1.1 |
1.1 |
1.1 |
TABLE 2 (continued).
|
NA28 |
NA29C |
NA30A |
NA30C |
NA33A |
NA33B |
NA30F |
NA1 |
NA25B |
NA33C |
NA29B |
NA21F |
||
|
Architecture |
V |
V |
V |
V |
V |
V |
Vh |
H |
H |
H |
Hb |
Hc |
|
|
Surface Openings |
1 |
1 |
1 |
1 |
1 |
1 |
1 |
1 |
1 |
1 |
1 |
1 |
|
|
Maximum Depth (cm) |
2.4 |
1.9 |
2.5 |
2.3 |
3.1 |
2.2 |
5.9 |
2.8 |
2.5 |
3.0 |
3.4 |
2.9 |
|
|
Total Length (cm) |
3.0 |
1.9 |
2.5 |
2.6 |
3.1 |
3.0 |
11.8 |
7.0 |
8.4 |
6.8 |
10.7 |
10.0 |
|
|
Maximum Width (mm) |
14.0 |
11.7 |
9.3 |
10.4 |
12.0 |
13.8 |
10.4 |
10.2 |
11.0 |
11.8 |
10.6 |
16.5 |
|
|
Minimum Width (mm) |
14.0 |
11.7 |
7.0 |
9.3 |
10.4 |
13.0 |
7.2 |
7.4 |
9.0 |
7.0 |
7.4 |
6.8 |
|
|
Average Width (mm) |
14.0 |
11.7 |
8.2 |
9.9 |
11.2 |
13.4 |
9.1 |
8.9 |
10.1 |
9.6 |
8.4 |
11.6 |
|
|
Maximum Height (mm) |
13.8 |
9.0 |
8.8 |
9.3 |
14.7 |
14.1 |
9.6 |
9.8 |
9.1 |
11.7 |
9.2 |
11.5 |
|
|
Minimum Height (mm) |
9.5 |
9.0 |
7.7 |
8.0 |
11.1 |
10.6 |
6.7 |
6.3 |
5.8 |
8.5 |
6.1 |
8.0 |
|
|
Average Height (mm) |
11.7 |
9.0 |
8.3 |
8.7 |
12.9 |
12.4 |
8.3 |
8.3 |
8.0 |
9.8 |
7.8 |
9.7 |
|
|
Average W/H Ratio |
1.2 |
1.3 |
1.0 |
1.1 |
0.9 |
1.1 |
1.1 |
1.1 |
1.3 |
1.0 |
1.1 |
1.2 |
|
|
Maximum Circumference (cm) |
5 |
3.5 |
2.8 |
3.1 |
4.3 |
4.4 |
3.2 |
3.2 |
3.3 |
4.3 |
3 |
4.3 |
|
|
Minimum Circumference (cm) |
3.7 |
3.5 |
2.4 |
2.8 |
3.5 |
3.9 |
2.1 |
2.2 |
3 |
2.3 |
2.5 |
2.3 |
|
|
Average Circumference (cm) |
4.4 |
3.5 |
2.6 |
3.0 |
3.9 |
4.2 |
2.8 |
2.8 |
3.2 |
3.1 |
2.7 |
3.4 |
|
|
Maximum Slope (Degrees) |
85 |
80 |
90 |
80 |
90 |
90 |
90 |
60 |
50 |
80 |
60 |
55 |
|
|
Minimum Slope (Degrees) |
85 |
80 |
90 |
80 |
90 |
90 |
0 |
15 |
0 |
50 |
60 |
0 |
|
|
Average Slope (Degrees) |
85 |
80 |
90 |
80 |
90 |
90 |
45 |
45 |
25 |
65 |
75 |
25 |
|
|
Branching Angle (Degrees) |
n/a |
n/a |
n/a |
n/a |
n/a |
n/a |
n/a |
n/a |
n/a |
n/a |
90 |
n/a |
|
|
Complexity |
2.0 |
2.0 |
2.0 |
2.0 |
2.0 |
2.0 |
2.0 |
2.0 |
2.0 |
2.0 |
4.0 |
4.0 |
|
|
Tortuosity |
1.3 |
1.0 |
1.0 |
1.1 |
1.0 |
1.0 |
2.0 |
3.5 |
5.6 |
2.3 |
1.5 |
1.2 |
TABLE 2 (continued).
|
NA29A |
NA26B |
NA31A |
NA31B |
Total Mean |
||
|
Architecture |
O (T1) |
O (T1) |
O (T2) |
O (T2) |
||
|
Surface Openings |
1 |
1 |
2 |
1 |
1 |
|
|
Maximum Depth (cm) |
3.4 |
6.9 |
2.5 |
1.9 |
4.4 |
|
|
Total Length (cm) |
10.6 |
12.5 |
12.3 |
10.0 |
7.4 |
|
|
Maximum Width (mm) |
12.9 |
18.0 |
13.4 |
10.9 |
13.2 |
|
|
Minimum Width (mm) |
8.3 |
7.4 |
8.7 |
9.1 |
8.8 |
|
|
Average Width (mm) |
10.5 |
10.9 |
10.4 |
10.1 |
10.6 |
|
|
Maximum Height (mm) |
9.6 |
11.3 |
12.7 |
11.7 |
11.0 |
|
|
Minimum Height (mm) |
6.0 |
6.7 |
9.3 |
8.9 |
7.9 |
|
|
Average Height (mm) |
8.2 |
9.3 |
10.4 |
9.9 |
9.5 |
|
|
Average W/H Ratio |
1.3 |
1.2 |
1.0 |
1.0 |
1.1 |
|
|
Maximum Circumference (cm) |
3.5 |
4.8 |
3.9 |
3.6 |
4.0 |
|
|
Minimum Circumference (cm) |
2.7 |
2.3 |
2.9 |
3.1 |
2.8 |
|
|
Average Circumference (cm) |
3.1 |
3.4 |
3.5 |
3.3 |
3.3 |
|
|
Maximum Slope (Degrees) |
60 |
60 |
90 |
20 |
71 |
|
|
Minimum Slope (Degrees) |
15 |
60 |
0 |
20 |
47 |
|
|
Average Slope (Degrees) |
38 |
60 |
43 |
20 |
59 |
|
|
Branching Angle (Degrees) |
n/a |
n/a |
n/a |
n/a |
75 |
|
|
Complexity |
3.0 |
3.0 |
6.0 |
2.0 |
2.6 |
|
|
Tortuosity |
43.0 |
39.0 |
1.8 |
99.0 |
7.6 |
TABLE 3. Quantitative measurements of burrow casts produced by Floridobolus penneri.
|
FP2C |
FP3C |
FP3D |
FP3E |
FP3F |
FP3G |
FP3H |
FP3I |
FP2E |
FP2F |
FP2G |
FP6A |
|
|
Architecture |
SV |
SV |
SV |
SV |
SV |
SV |
SV |
SV |
SV |
SV |
SV |
SV |
|
Surface Openings |
1 |
1 |
1 |
1 |
1 |
1 |
1 |
1 |
1 |
1 |
1 |
1 |
|
Maximum Depth (cm) |
3.5 |
1.7 |
3.3 |
3.3 |
3.6 |
6.8 |
6.5 |
8.2 |
7.9 |
6.9 |
4.4 |
1.8 |
|
Total Length (cm) |
4.0 |
1.7 |
4.2 |
3.3 |
4.2 |
7.4 |
6.8 |
8.6 |
9.6 |
9.5 |
10.0 |
4.3 |
|
Maximum Width (mm) |
13.1 |
9.4 |
14.0 |
14.1 |
14.2 |
10.8 |
12.8 |
12.8 |
12.5 |
12.2 |
6.5 |
17.0 |
|
Minimum Width (mm) |
11.0 |
9.4 |
9.6 |
13.2 |
12.4 |
8.8 |
10.2 |
10.3 |
9.2 |
9.7 |
0.9 |
10.0 |
|
Average Width (mm) |
12.1 |
9.4 |
11.1 |
13.7 |
13.2 |
10.1 |
11.4 |
11.4 |
11.0 |
10.8 |
4.0 |
13.7 |
|
Maximum Height (mm) |
14.3 |
10.6 |
11.6 |
12.0 |
11.1 |
12.0 |
12.4 |
12.5 |
13.3 |
11.4 |
7.8 |
10.7 |
|
Minimum Height (mm) |
10.0 |
10.6 |
8.6 |
8.3 |
9.2 |
8.7 |
10.8 |
8.5 |
8.1 |
8.7 |
3.4 |
10.0 |
|
Average Height (mm) |
12.8 |
10.6 |
10.0 |
10.2 |
10.4 |
10.5 |
11.5 |
10.5 |
10.9 |
10.1 |
5.8 |
10.3 |
|
Average W/H Ratio |
1.0 |
0.9 |
1.1 |
1.4 |
1.3 |
1.0 |
1.0 |
1.1 |
1.0 |
1.1 |
0.7 |
1.3 |
|
Maximum Circumference (cm) |
4.4 |
3.2 |
4 |
4.4 |
4 |
3.7 |
4 |
4.1 |
3.9 |
3.7 |
3.7 |
4.5 |
|
Minimum Circumference (cm) |
3.4 |
3.2 |
3.1 |
3.7 |
3.8 |
2.9 |
3.1 |
3.2 |
3.2 |
2.9 |
2.4 |
2.8 |
|
Average Circumference (cm) |
4.0 |
3.2 |
3.4 |
4.1 |
3.9 |
3.3 |
3.6 |
3.6 |
3.6 |
3.4 |
3.2 |
3.7 |
|
Maximum Slope (Degrees) |
65 |
75 |
68 |
65 |
75 |
78 |
70 |
65 |
65 |
55 |
78 |
20 |
|
Minimum Slope (Degrees) |
65 |
75 |
68 |
65 |
75 |
78 |
70 |
65 |
65 |
55 |
78 |
20 |
|
Average Slope (Degrees) |
65 |
75 |
68 |
65 |
75 |
78 |
70 |
65 |
65 |
55 |
78 |
20 |
|
Branching Angle (Degrees) |
n/a |
n/a |
n/a |
n/a |
n/a |
n/a |
n/a |
n/a |
n/a |
n/a |
n/a |
n/a |
|
Complexity |
2.0 |
2.0 |
2.0 |
2.0 |
2.0 |
2.0 |
2.0 |
2.0 |
2.0 |
2.0 |
4.0 |
2.0 |
|
Tortuosity |
1.0 |
1.0 |
1.2 |
1.0 |
1.2 |
1.1 |
1.0 |
1.1 |
1.1 |
1.2 |
1.1 |
1.4 |
TABLE 3 (continued).
|
FP3A |
FP5B |
FP5C |
FP5D |
FP7A |
FP7C |
FP7E |
FP7F |
FP7H |
FP5E |
|
|
Architecture |
SV |
SV |
SV |
SV |
SV |
SV |
SV |
SVb |
SVcb |
SVc |
|
Surface Openings |
1 |
1 |
1 |
1 |
1 |
1 |
1 |
1 |
1 |
1 |
|
Maximum Depth (cm) |
1.5 |
2.8 |
4.2 |
5.7 |
2.1 |
4.1 |
8.7 |
8.0 |
7.4 |
5.2 |
|
Total Length (cm) |
3.3 |
3.4 |
4.9 |
7.7 |
2.4 |
5.5 |
9.2 |
12.4 |
18.6 |
6.8 |
|
Maximum Width (mm) |
8.2 |
15.9 |
12.9 |
16.3 |
11.3 |
16.0 |
15.0 |
18.3 |
30.1 |
16.4 |
|
Minimum Width (mm) |
7.3 |
14.5 |
8.0 |
12.7 |
10.3 |
9.1 |
9.0 |
10.1 |
8.7 |
10.4 |
|
Average Width (mm) |
7.8 |
15.2 |
11.0 |
13.9 |
10.8 |
12.8 |
12.3 |
13.6 |
16.8 |
12.7 |
|
Maximum Height (mm) |
8.5 |
19.6 |
11.8 |
16.3 |
12.0 |
14.0 |
na |
12.8 |
19.0 |
24.7 |
|
Minimum Height (mm) |
7.6 |
13.3 |
10.9 |
11.8 |
10.8 |
10.7 |
na |
10.3 |
8.7 |
11.5 |
|
Average Height (mm) |
8.1 |
16.5 |
11.5 |
13.9 |
11.4 |
12.7 |
10.0 |
11.3 |
13.4 |
15.6 |
|
Average W/H Ratio |
1.0 |
1.0 |
1.0 |
1.0 |
0.9 |
0.9 |
1.2 |
1.2 |
1.3 |
0.9 |
|
Maximum Circumference (cm) |
2.7 |
5.7 |
4.1 |
5.2 |
3.6 |
4.5 |
3.9 |
4.5 |
8.1 |
6.2 |
|
Minimum Circumference (cm) |
2.6 |
4.6 |
3.2 |
3.3 |
3.1 |
3 |
2.9 |
3.1 |
2.6 |
3.3 |
|
Average Circumference (cm) |
2.7 |
5.2 |
3.7 |
4.5 |
3.4 |
3.9 |
3.6 |
4.0 |
5.0 |
4.7 |
|
Maximum Slope (Degrees) |
45 |
45 |
70 |
55 |
75 |
75 |
90 |
90 |
90 |
65 |
|
Minimum Slope (Degrees) |
45 |
45 |
70 |
55 |
75 |
50 |
65 |
50 |
20 |
45 |
|
Average Slope (Degrees) |
45 |
45 |
70 |
55 |
75 |
62 |
78 |
70 |
50 |
55 |
|
Branching Angle (Degrees) |
n/a |
n/a |
n/a |
n/a |
n/a |
n/a |
n/a |
20 |
55 |
n/a |
|
Complexity |
2.0 |
2.0 |
2.0 |
2.0 |
2.0 |
2.0 |
2.0 |
3.0 |
4.0 |
3.0 |
|
Tortuosity |
1.6 |
1.1 |
1.1 |
1.2 |
1.1 |
1.3 |
1.1 |
1.1 |
1.5 |
1.3 |
TABLE 3 (continued).
|
FP3B |
FP2A |
FP2B |
FP2D |
FP4A |
FP5A |
FP7B |
FP2M |
FP7D |
|
|
Architecture |
V |
V |
V |
V |
V |
V |
V |
V |
Vh |
|
Surface Openings |
1 |
1 |
1 |
1 |
1 |
1 |
1 |
1 |
1 |
|
Maximum Depth (cm) |
2.2 |
4.1 |
3.1 |
6.0 |
3.3 |
2.1 |
3.6 |
3.6 |
6.9 |
|
Total Length (cm) |
2.2 |
4.1 |
3.1 |
6.7 |
3.6 |
2.1 |
4.7 |
3.6 |
8.4 |
|
Maximum Width (mm) |
12.6 |
10.6 |
15.0 |
15.6 |
16.5 |
16.9 |
14.5 |
23.3 |
14.4 |
|
Minimum Width (mm) |
9.8 |
9.2 |
13.6 |
8.6 |
12.3 |
10.3 |
7.6 |
12.1 |
10.3 |
|
Average Width (mm) |
11.2 |
9.9 |
14.3 |
13.2 |
14.7 |
13.6 |
12.0 |
16.6 |
12.1 |
|
Maximum Height (mm) |
9.7 |
11.9 |
15.8 |
13.3 |
13.4 |
15.4 |
13.7 |
23.0 |
11.3 |
|
Minimum Height (mm) |
9.1 |
10.0 |
14.0 |
9.6 |
10.5 |
12.0 |
11.6 |
12.7 |
9.8 |
|
Average Height (mm) |
9.4 |
11.1 |
14.9 |
11.5 |
12.2 |
13.7 |
12.7 |
16.7 |
11.0 |
|
Average W/H Ratio |
1.2 |
0.9 |
1.0 |
1.1 |
1.2 |
1.0 |
0.7 |
1.0 |
1.1 |
|
Maximum Circumference (cm) |
3.6 |
3.8 |
5.2 |
5.6 |
5.5 |
4.6 |
4 |
6.5 |
3.8 |
|
Minimum Circumference (cm) |
3 |
3.4 |
4.6 |
2.6 |
3.5 |
3.4 |
3.2 |
3.8 |
3.3 |
|
Average Circumference (cm) |
3.3 |
3.6 |
4.9 |
4.4 |
4.6 |
4.0 |
3.6 |
5.2 |
3.6 |
|
Maximum Slope (Degrees) |
90 |
85 |
90 |
85 |
90 |
90 |
90 |
90 |
90 |
|
Minimum Slope (Degrees) |
90 |
85 |
90 |
60 |
90 |
90 |
40 |
90 |
55 |
|
Average Slope (Degrees) |
90 |
85 |
90 |
73 |
90 |
90 |
65 |
90 |
73 |
|
Branching Angle (Degrees) |
n/a |
n/a |
n/a |
n/a |
n/a |
n/a |
n/a |
n/a |
n/a |
|
Complexity |
2.0 |
2.0 |
2.0 |
2.0 |
2.0 |
2.0 |
2.0 |
2.0 |
2.0 |
|
Tortuosity |
1.0 |
1.0 |
1.0 |
1.1 |
1.1 |
1.0 |
1.2 |
1.0 |
1.2 |
TABLE 3 (continued).
|
FP2I |
FP2J |
FP2K |
FP2L |
FP7G |
FP2H |
FP4B |
FP1 |
FP5F |
FP6B |
FP5G |
Total Mean |
||||
|
Architecture |
J |
J |
J |
J |
J |
Jb |
H |
Hb |
Ob (T1) |
Oc (T1) |
Ob (T2) |
||||
|
Surface Openings |
1 |
1 |
1 |
1 |
1 |
1 |
1 |
1 |
1 |
1 |
1 |
1 |
|||
|
Maximum Depth (cm) |
6.5 |
7.8 |
8.1 |
2.9 |
8.4 |
5.8 |
3.1 |
2.8 |
7.7 |
4.4 |
1.1 |
4.8 |
|||
|
Total Length (cm) |
10.7 |
11.9 |
11.8 |
7.5 |
14.7 |
13.0 |
11.1 |
11.1 |
17.5 |
13.0 |
10.1 |
7.6 |
|||
|
Maximum Width (mm) |
11.5 |
16.6 |
12.4 |
11.4 |
13.0 |
13.0 |
13.6 |
13.5 |
12.5 |
24.8 |
11.9 |
14.4 |
|||
|
Minimum Width (mm) |
8.4 |
9.3 |
9.5 |
7.9 |
9.0 |
7.2 |
10.0 |
7.5 |
9.1 |
10.0 |
9.0 |
9.7 |
|||
|
Average Width (mm) |
9.9 |
12.0 |
11.0 |
9.4 |
11.3 |
10.8 |
11.6 |
9.8 |
10.8 |
17.7 |
10.2 |
11.9 |
|||
|
Maximum Height (mm) |
13.0 |
16.5 |
14.8 |
12.1 |
15.7 |
14.7 |
11.4 |
7.0 |
13.7 |
16.0 |
11.2 |
13.5 |
|||
|
Minimum Height (mm) |
9.2 |
9.2 |
10.3 |
7.4 |
10.4 |
7.7 |
7.5 |
5.1 |
10.0 |
7.7 |
6.2 |
9.5 |
|||
|
Average Height (mm) |
10.7 |
11.8 |
13.0 |
9.5 |
12.4 |
11.0 |
10.0 |
6.1 |
12.2 |
12.1 |
8.3 |
11.4 |
|||
|
Average W/H Ratio |
0.9 |
1.0 |
0.9 |
1.0 |
0.9 |
1.0 |
1.2 |
1.6 |
0.9 |
1.5 |
1.3 |
1.1 |
|||
|
Maximum Circumference (cm) |
3.7 |
5.3 |
4.2 |
3.5 |
4.2 |
6.4 |
4.3 |
3.4 |
4.1 |
6.1 |
3.5 |
4.5 |
|||
|
Minimum Circumference (cm) |
2.9 |
2.8 |
3 |
2.6 |
3.1 |
2.4 |
3.1 |
2.2 |
3.2 |
2.6 |
2.7 |
3.1 |
|||
|
Average Circumference (cm) |
3.2 |
3.8 |
3.8 |
3.1 |
3.9 |
3.7 |
3.6 |
2.7 |
3.7 |
4.4 |
3.1 |
3.8 |
|||
|
Maximum Slope (Degrees) |
80 |
90 |
55 |
55 |
75 |
65 |
70 |
50 |
85 |
90 |
20 |
72 |
|||
|
Minimum Slope (Degrees) |
15 |
50 |
50 |
45 |
75 |
25 |
0 |
25 |
85 |
40 |
20 |
58 |
|||
|
Average Slope (Degrees) |
47 |
70 |
53 |
50 |
75 |
45 |
35 |
38 |
85 |
65 |
20 |
65 |
|||
|
Branching Angle (Degrees) |
n/a |
n/a |
n/a |
n/a |
n/a |
70 |
n/a |
10,45 |
12, 25 |
n/a |
10 |
31 |
|||
|
Complexity |
2.0 |
2.0 |
2.0 |
2.0 |
2.0 |
3.0 |
2.0 |
6.0 |
6.0 |
4.0 |
4.0 |
2.5 |
|||
|
Tortuosity |
2.2 |
2.0 |
2.0 |
5.8 |
2.4 |
1.4 |
4.3 |
1.1 |
17.6 |
53.0 |
1.4 |
3.1 |
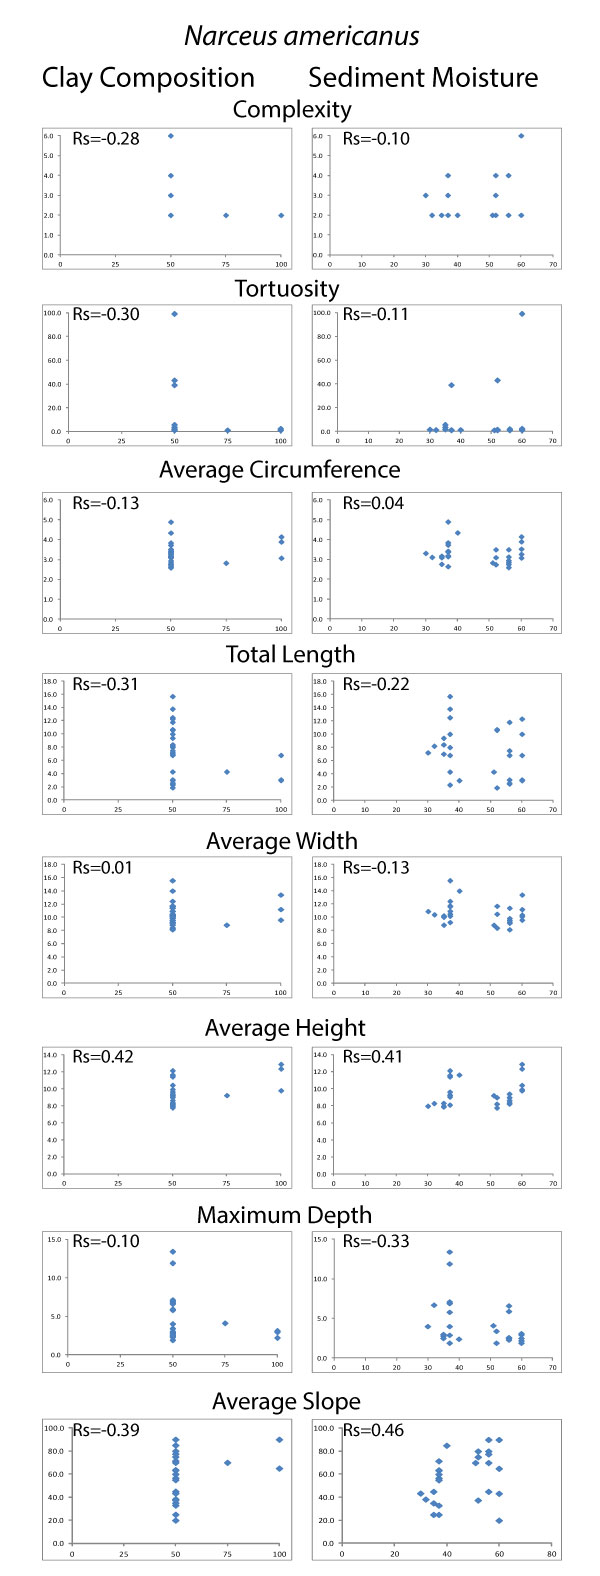
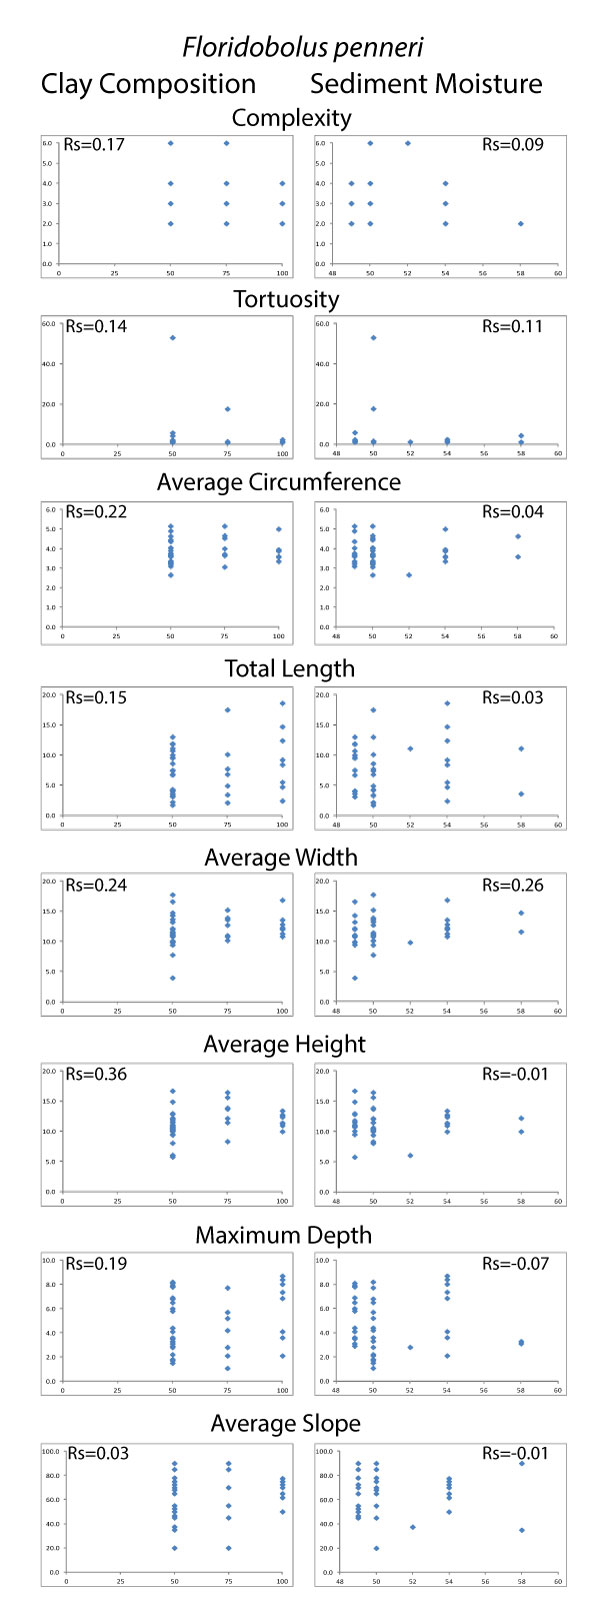
TABLE 4. Rs values of the Spearman's rank correlation tests between sediment clay and moisture content and quantitative burrow properties. The number of burrow openings rarely varied between burrow casts and were, therefore, excluded from the analysis.
|
Narceus americanus |
||||||||
|
Length |
Depth |
Width |
Height |
Circum. |
Slope |
Complexity |
Tortuosity |
|
|
Clay |
-0.31 |
-0.10 |
0.01 |
0.42 |
-0.13 |
-0.39 |
-0.28 |
-0.30 |
|
Moisture |
-0.22 |
-0.33 |
-0.13 |
0.41 |
0.04 |
0.46 |
-0.10 |
-0.11 |
|
Floridobolus penneri |
||||||||
|
Length |
Depth |
Width |
Height |
Circum. |
Slope |
Complexity |
Tortuosity |
|
|
Clay |
0.15 |
0.19 |
0.24 |
0.36 |
0.22 |
0.03 |
-0.17 |
0.14 |
|
Moisture |
0.03 |
-0.07 |
0.26 |
-0.01 |
0.04 |
-0.01 |
0.09 |
0.11 |
APPENDIX 1. Video of Narceus americanus using a compaction burrowing technique in 50O/50S sediment.
APPENDIX 2. Video of Narceus americanus using an excavation burrowing technique in 50Sa/50S sediment.
APPENDIX 3. Video of Floridobolus penneri using a compaction burrowing technique in 50Sa/50S sediment.
APPENDIX 4. Video of Floridobolus penneri in the subsurface using an excavation burrowing technique to widen a burrow in 100O sediment.
Appendixes 5-13 are presented in PDF format.
APPENDIX 5. Bray Curtis similarity matrix comparing all burrow casts produced in this study. From top-down and left-right; 29 Narceus americanus burrows (NA), 42 Floridobolus penneri burrows (FP), 13 Orthoporus ornatus burrows (OO prefix), and 8 Archispirostreptus gigas burrows (AG). Color bars along the sides and top indicate primary burrow architectures: Black = subvertical burrow, gray = vertical burrow, tan = J-shaped burrow, brown = helical burrow, magenta = O-shaped burrow, dark green = sinuous burrow, yellow = U-shaped burrow. Colors inside the matrix indicate the level of similarity: green cells indicate identical burrows; blue cells indicate highly similar burrows; orange cells indicate moderately similar burrows; red cells indicate dissimilar burrows. Appendixes 5-13 are presented in PDF format.
APPENDIX 6. Bray Curtis similarity matrices comparing the burrow architectures of Narceus americanus. 1) Comparison matrix of subvertical burrows. 2) Comparison matrix of vertical burrows. 3) Comparison matrix of helical burrows. 4) Comparison matrix of Type 1 and Type 2 O-shaped burrows. Colors inside the matrix indicate the level of similarity: green cells indicate identical burrows; blue cells indicate highly similar burrows; orange cells indicate moderately similar burrows; red cells indicate dissimilar burrows. Appendixes 5-13 are presented in PDF format.
APPENDIX 7. Bray Curtis similarity matrices comparing the burrow architectures of Floridobolus penneri. 1) Comparison matrix of subvertical burrows. 2) Comparison matrix of vertical burrows. 3) Comparison matrix of J-shaped burrows. 4) Comparison matrix of Type 1 and Type 2 O-shaped burrows. 5) Comparison matrix of helical burrows. Colors inside the matrix indicate the level of similarity: green cells indicate identical burrows; blue cells indicate highly similar burrows; orange cells indicate moderately similar burrows; red cells indicate dissimilar burrows. Appendixes 5-13 are presented in PDF format.
APPENDIX 8. Bray Curtis similarity matrices comparing the similar burrow architectures produced by Narceus americanus (NA) and Floridobolus penneri (FP). 1) Comparison matrix of subvertical burrows. 2) Comparison matrix of vertical burrows. 3) Comparison matrix of helical burrows. 4) Comparison matrix of O-shaped burrows. Colors inside the matrix indicate the level of similarity: green cells indicate identical burrows; blue cells indicate highly similar burrows; orange cells indicate moderately similar burrows; red cells indicate dissimilar burrows. Appendixes 5-13 are presented in PDF format.
APPENDIX 9. Bray Curtis similarity matrix comparing burrows produced by Narceus americanus (NA) to burrows produced by Orthoporus ornatus (OO). Cells outlined in thick black lines in the matrix indicate comparison of burrows with the same architecture. OO1, OO7, and OO10 are subvertical burrows. OO2, OO4, OO6, OO8, and OO9 are vertical burrows. OO5 is a sinuous burrow. OO3 is a U-shaped burrow. OO11–13 are J-shaped burrows. Colors inside the matrix indicate the level of similarity: blue cells indicate highly similar burrows; orange cells indicate moderately similar burrows; red cells indicate dissimilar burrows. Appendixes 5-13 are presented in PDF format.
APPENDIX 10. Bray Curtis similarity matrix comparing burrows produced by Floridobolus penneri (FP) to burrows produced by Orthoporus ornatus (OO). Cells outlined in thick black lines in the matrix indicate comparison of burrows with the same architecture. OO1, OO7, and OO10 are subvertical burrows. OO2, OO4, OO6, OO8, and OO9 are vertical burrows. OO5 is a sinuous burrow. OO3 is a U-shaped burrow. OO11–13 are J-shaped burrows. Colors inside the matrix indicate the level of similarity: green cells indicate identical burrows; blue cells indicate highly similar burrows; orange cells indicate moderately similar burrows; red cells indicate dissimilar burrows. Appendixes 5-13 are presented in PDF format.
APPENDIX 11. Bray Curtis similarity matrix comparing burrows produced by Narceus americanus (NA) to burrows produced by Archispirostreptus gigas (AG). Cells outlined in thick black lines in the matrix indicate comparison of burrows of the same architecture. AG2 and AG8 are sinuous burrows. AG1, AG3, AG4, and AG6 are helical burrows. AG7 and AG5 are U-shaped burrows. Colors inside the matrix indicate the level of similarity: blue cells indicate highly similar burrows; orange cells indicate moderately similar burrows; red cells indicate dissimilar burrows. Appendixes 5-13 are presented in PDF format.
APPENDIX 12. Bray Curtis similarity matrix comparing burrows produced by Floridobolus penneri (FP) to burrows produced by Archispirostreptus gigas (AG). Cells outlined in thick black lines in the matrix indicate comparison of burrows of the same architecture. AG2 and AG8 are sinuous burrows. AG1, AG3, AG4, and AG6 are helical burrows. AG7 and AG5 are U-shaped burrows. Colors inside the matrix indicate the level of similarity: blue cells indicate highly similar burrows; orange cells indicate moderately similar burrows; red cells indicate dissimilar burrows. Appendixes 5-13 are presented in PDF format.
APPENDIX 13. Bray Curtis similarity matrix comparing burrows produced by Orthoporus ornatus (OO) to burrows produced by Archispirostreptus gigas (AG). Cells outlined in thick black lines in the matrix indicate comparison of burrows of the same architecture. OO1, OO7, and OO10 are subvertical burrows. OO2, OO4, OO6, OO8, and OO9 are vertical burrows. OO5 is a sinuous burrow. OO3 is a U-shaped burrow. OO11–13 are J-shaped burrows. AG2 and AG8 are sinuous burrows. AG1, AG3, AG4, and AG6 are helical burrows. AG7 and AG5 are U-shaped burrows. Colors inside the matrix indicate the level of similarity: blue cells indicate highly similar burrows; orange cells indicate moderately similar burrows; red cells indicate dissimilar burrows. Appendixes 5-13 are presented in PDF format.
APPENDIX 14. Scatter plots of data used in Spearman's rank correlation tests of Narceus americanus burrows. The x-axis is the relative clay and moisture content in the sediment. The y-axis is the measured value of the burrow property. Rs values indicate no significant relationship between sediment clay and moisture content to any of the eight different quantitative burrow properties tested.
APPENDIX 15. Scatter plots of data used in Spearman's rank correlation tests of Floridobolus penneri burrows. The x-axis is the relative clay and moisture content in the sediment. The y-axis is the measured value of the burrow property. Rs values indicate no significant relationship between sediment clay and moisture content to any of the eight different quantitative burrow properties tested.
 Jared J. Bowen
Department of Geological Sciences
Ohio University
316 Clippinger Laboratories
Athens, Ohio 45701
USA
jb836611@ohio.edu
Jared Bowen completed his Masters degree in geology at Ohio University in 2013 after earning his BS with a major in geology and minors in biology and chemistry from the Western Michigan University. He currently works at Innova Exploration.

 Daniel I. Hembree
Department of Geological Sciences
Ohio University
316 Clippinger Laboratories
Athens, Ohio 45701
USA
hembree@ohio.edu
Daniel Hembree is an Associate Professor in the Department of Geological Sciences at Ohio University. His research interests primarily lie with animal-substrate interactions in ancient and modern continental environments. These interactions are preserved in the fossil record as trace fossils. Trace fossils provide an in situ record of ancient biodiversity, ecology, and environment. The study of trace fossils, therefore, provides vital information for accurate paleoenvironmental reconstructions. This involves not only the study of paleosols and continental trace fossils throughout geologic time, but also the experimental study of burrowing behaviors of extant terrestrial annelids, arthropods, amphibians, and reptiles. Current research projects involve the study of the influence of climate changes on ancient soils and soil ecosystems including those of the Pennsylvanian and Permian of southeast Ohio, Permian of eastern Kansas, and the Eocene to Miocene of Colorado and Wyoming.
Neoichnology of two spirobolid millipedes: improving the understanding of the burrows of soil detritivores
Plain Language Abstract
Burrowing animals like millipedes that consume decaying vegetation play an important role in soil formation but are seldom preserved as body fossils. Their burrows, however, are capable of being preserved as trace fossils but are poorly understood. To improve the recognition of millipede burrows and, therefore, the presence of millipedes in the fossil record, this study describes the burrowing behavior and resulting burrows of two species of spirobolid millipedes: Narceus americanus and Floridobolus penneri. Forty millipedes were placed in terraria filled with sediment composed of different amounts of organic matter, soil, and sand and different moisture levels for 7–94 days. At the end of the experiments, any open burrows were cast with plaster and described. Both N. americanus and F. penneri produced vertical, subvertical, helical, and O-shaped burrows. Floridobolus penneri also produced J-shaped burrows. The burrow casts were compared to each other and to the environmental conditions using nonparametric statistics. Burrows of two spirostreptid millipede species, Orthoporus ornatus and Archispirostreptus gigas, were also included in the comparisons. Burrows of N. americanus, F. penneri, and O. ornatus were found to be similar, and their morphology was unaffected by sediment properties. Burrows produced by A. gigas, the largest species, were the least similar to other species even after removing the size-dependent burrow properties such as tunnel height and width from the analysis. Differences and similarities in burrow morphology were instead attributed to the behavioral function of the burrow, such as dwelling vs. feeding. Despite their differences, all millipede burrows had a mean width-to-height ratio of 1.0–1.14. These results show that millipedes produce burrows with unique morphologies that may be used to differentiate their burrows from those of other soil animals. The presence of millipedes in ancient soils may, therefore, be interpreted based on trace fossils.
Resumen en Español
Neoicnología de dos milípedos espirobólidos: avanzando en el conocimiento de las madrigueras de detritívoros del suelo
Los detritívoros que producen madrigueras, tales como milípedos o milpiés, juegan un papel importante en la formación del suelo. Con el fin de avanzar en el reconocimiento de las madrigueras de los milípedos y, por lo tanto, de la presencia de milípedos macrodetritívoros en el registro fósil, el presente estudio describe el comportamiento de realización de madrigueras y las morfologías resultantes de las madrigueras de dos especies de milpiés espirobólidos: Narceus americanus y Floridobolus penneri. Los milípedos se colocaron en terrarios llenos de sedimentos de composiciones variadas y niveles de humedad controlados durante 7-94 días. Se abrieron las madrigueras y se rellenaron con yeso, luego se excavaron, para posteriormente describirlas tanto cualitativa como cuantitativamente. Tanto N. americanus como F. penneri produjeron madrigueras helicoidales, verticales, subverticales y en forma de O. Floridobolus penneri también produjo madrigueras en forma de J. Se observó que las morfologías de las madrigueras de ambas especies eran similares y no estaban afectadas por las propiedades de los sedimentos de acuerdo con los tests de similitud de Bray Curtis y rangos de correlación de Spearman, respectivamente. Las madrigueras de otras dos especies de milípedos del Orden Spirostreptida, Orthoporus ornatus y Archispirostreptus gigas, producidas en un estudio anterior, también se compararon con las madrigueras de espirobólidos. Mientras que las madrigueras de O. ornatus fueron similares, las madrigueras producidas por A. gigas, la mayor de las cuatro especies, fueron las menos similares, incluso después de que se eliminasen del análisis las propiedades de la madriguera dependientes del tamaño. Las diferencias y las similitudes en la morfología de las madrigueras fueron en cambio atribuidas a la función del comportamiento de formar una madriguera, es decir, si la función era la de refugio o la de alimentación. A pesar de algunas diferencias, todos los ejes y galerías de las madrigueras de los milípedos tenían una proporción media entre anchura y altura de 1,0 a 1,14. Estos resultados muestran que los milípedos juliformes producen madrigueras con morfologías únicas que pueden utilizarse para diferenciar sus madrigueras particulares de las producidas por otros organismos del suelo.
Palabras clave: icnofósiles; trazas fósiles; bioturbación; continental; artrópodo; paleosuelo
Traducción: Enrique Peñalver
Résumé en Français
Neoichnologie de deux mille-pattes spirobolide: amélioration de la compréhension des terriers de détritivores du sol
Les détritivores fouisseurs tels que les mille-pattes jouent un rôle important dans la formation des sols. Afin d'améliorer la reconnaissance des terriers de mille-pattes et, par conséquent, la présence de mille-pattes macrodétritivores dans le registre fossile, cette étude décrit le comportement fouisseur et les morphologies résultantes des terriers de deux espèces de mille-pattes spirobolide: Narceus americanus et Floridobolus penneri. Des mille-pattes ont été placés dans des terrariums remplis de sédiments de compositions variées et des teneurs en humidité contrôlées pendant 7 à 94 jours. Les terriers ouverts ont été coulés avec du plâtre, déterrés, et décrits à la fois qualitativement et quantitativement. N. americanus et F. penneri ont tous deux produits des terriers verticaux, subverticaux, hélicoïdales, et en forme de 'O'. Floridobolus penneri a également produit des terriers en forme de 'J'. Les morphologies des terriers des deux espèces ont été jugés similaires et non affecté par les propriétés des sédiments à l'aide de la similarité de Bray Curtis et des tests de corrélation de rang de Spearman, respectivement. Les terriers de deux autres espèces de mille-pattes de l'Ordre Spirostreptida, Orthoporus ornatus, et Archispirostreptus gigas, produit dans une étude précédente ont été également comparés aux terriers spirobolides. Alors que les terriers d'O. ornatus étaient similaires, les terriers produits par A. gigas, le plus grand des quatre espèces, étaient les moins similaire, même après avoir retiré de l'analyse les propriétés des terriers dépendant de la taille. Les différences et similitudes dans la morphologie des terriers ont été à la place attribuée à la fonction du comportement du terrier, du refuge, ou de l'alimentation. Malgré quelques différences, tous les tubes et tunnels de terrier de mille-pattes avaient une moyenne de rapport largeur à hauteur entre 1,0 à 1,14. Ces résultats montrent que les mille-pattes juliformes produisent des terriers avec des morphologies uniques qui peuvent être utilisées pour différencier leurs terriers à ceux produits par d'autres organismes du sol.
Mots-clés: ichnofossiles; fossiles traces; bioturbation; continental; arthropodes; paléosol
Translator: Kenny J. Travouillon
Deutsche Zusammenfassung
Neoichnologie von zwei spiroboliden Tausendfüßern: Verbessertes Verständnis der Grabgänge von Boden-Detritivoren
Grabende Detritivoren wie Tausendfüßer spielen eine wichtige Rolle bei der Bodenbildung. Um das Erkennen von Tausendfüßer-Grabgängen zu verbessern und somit die Präsenz von millipeden Makrodetritivoren im Fossilbericht zu erhöhen, beschreibt diese Arbeit das Grabverhalten und die daraus resultierenden Grabgang-Morphologien von zwei Arten spirobolider Tausendfüßer: Narceus americanus und Floridobolus penneri. Sieben bis 94 Tage lang wurden Tausendfüßer in Terrarien mit kontrollierten Feuchtigkeitsgehalten gesetzt, die mit Sediment verschiedenster Zusammensetzung gefüllt waren. Offene Gänge wurden mit Gips abgeformt, ausgegraben und sowohl qualitativ als auch quantitativ beschrieben. Sowohl N. americanus als auch F. penneri fertigten vertikale, subvertikale, helicale und o-förmige Grabgänge an. Floridobolus penneri erzeugte zudem j-förmige Grabgänge. Die Grabgang-Morphologien beider Arten wurden unbeeinträchtigt von Sedimenteigenschaften als ähnlich befunden, indem die Bray Curtis Ähnlichkeit beziehungsweise der Spearman's Rank Korrelationstest angewendet wurde. Grabgänge von zwei anderen Tausendfüßerarten der Ordnung Spirostreptida, Orthoporus ornatus und Archispirostreptus gigas, die während einer vorangegangenen Studie erzeugt worden waren, wurden ebenfalls mit den spiroboliden Grabgängen verglichen. Während Grabgänge von O. ornatus ähnlich waren, waren die Gänge von A. gigas, der größten der vier Arten, am wenigsten ähnlich selbst nach Entfernung von größenabhängigen Grabgang-Eigenschaften aus der Analyse. Unterschiede und Ähnlichkeiten in der Grabgang-Morphologie waren stattdessen der Verhaltensfunktion des Grabgangs, Refugiums oder Ernährung zuzuschreiben. Trotz einiger Unterschiede hatten alle Schächte und Tunnel der Tausendfüßer-Grabgänge ein mittleres Verhältnis von Weite zu Breite von 1.0–1.14. Diese Ergebnisse zeigen, dass juliforme Tausendfüßer Grabgänge mit einzigartiger Morphologie produzieren, welche dazu genutzt werden können ihre Grabgänge von denen anderer Bodenorganismen zu unterscheiden.
Schlüsselwörter: Ichnofossilien; Spurenfossilien; Bioturbation; kontinental; Arthropode; Paläosol
Translator: Eva Gebauer
Arabic
Translator: Ashraf M.T. Elewa
-
-
PE: An influential journal
 Palaeontologia Electronica among the most influential palaeontological journals
Article number: 27.2.2E
July 2024

 A Review of Handbook of Paleoichthyology Volume 8a: Actinopterygii I, Palaeoniscimorpha, Stem Neopterygii, Chondrostei