

Volume 28.2
May–August 2025
Full table of contents
ISSN: 1094-8074, web version;
1935-3952, print version
Recent Research Articles
See all articles in 28.2 May-August 2025
See all articles in 28.1 January-April 2025
See all articles in 27.3 September-December 2024
See all articles in 27.2 May-August 2024
Interested in submitting a paper to Palaeontologia Electronica?
Click here to register and submit.
 |
||||
 |
||||
Article Search
 Melanie J. Hopkins. Division of Paleontology, American Museum of Natural History, Central Park West at 79th Street, New York, NY 10024, USA. mhopkins@amnh.org
Melanie Hopkins is Assistant Curator of Invertebrate Paleontology at the American Museum of Natural History. She completed her PhD at the University of Chicago in 2010, and was a postdoctoral researcher at the Field Museum of Natural History Chicago, the Museum für Naturkunde Berlin, and the University of Erlangen-Nürnberg before joining the AMNH curatorial staff in 2014. Her research focuses on patterns and rates of morphological evolution, primarily in Cambrian and Ordovician trilobites, but also in other living and fossil invertebrate groups.

 J. Kirk Pearson. Department of Geology, Oberlin College, Carnegie Building, 52 West Lorain Street, Oberlin, OH 44074, USA. kirkpear@gmail.com
Kirk Pearson is a geologist and programmer currently completing his studies at Oberlin College. Pearson has served as visiting researcher in Human-Computer Interaction at both Carnegie Mellon University and the University of Washington, and was a lab technician in the North American Archaeology Lab at the American Museum of Natural History. As a composer-scientist hybrid, his research interests often include creative and unexpected uses of electronic tools, such as modeling seismic data through audio processing algorithms.
TABLE 1. Results of model comparison for Cryptolithus tesselatus. Numbers in parentheses = set breakpoints for each threshold model; bolded values indicate best supported model. Better support is indicated by lower AICc values. AICc weights indicate the relative likelihood of each model; these are normalized to sum to 1 and may be interpreted as probabilities. See text for additional explanation of different models, and Figure 6 and Figure 9 for plots showing different model fits and slopes for the best supported model.
| 3D landmarks | 2D landmarks | |||
| AICc | AICc weights | AICc | AICc weights | |
| linear model | -114.9327 | 0.0010 | -120.283 | 0.0239 |
| threshold model 1 (early shift) | -128.2149 | 0.7439 | -126.9374 | 0.6663 |
| threshold model 2 (late shift) | -118.9646 | 0.0073 | -122.6766 | 0.0792 |
| threshold model 3 (two shifts) | -126.0163 | 0.2478 | -124.815 | 0.2306 |
TABLE 2. Results of model comparison for Marrolithus bureaui (data from Delabroye and Crônier, 2008). See Table 1 for explanation of AICc values, text for explanation of different models, and Figure 10.1 for plot showing linear model and best supported threshold model. Values in parentheses are the natural log of centroid size for breakpoints in each model.
| AICc | AICc weights | |
| linear model | -356.065 | 0.0008 |
| threshold model 1 (1.85) | -356.665 | 0.0010 |
| threshold model 2 (2.5) | -362.037 | 0.0153 |
| threshold model 3 (2.8) | -369.57 | 0.6618 |
| threshold model 4 (two shifts) | -368.123 | 0.3211 |
TABLE 3. Results of model comparison for seven additional species. See Table 1 for explanation of AICc values, text for explanation of different models, and Figure 10.2-8 for plots showing linear model and best supported threshold model, set breakpoints, and data sources.
| AICc | AICc weights | |||
| linear model | threshold model | linear model | threshold model | |
| Aulacopleura koninckii | -1678.252 | -1678.6962 | 0.4447 | 0.5553 |
| Triarthrus becki | -501.786 | -598.3558 | 0.0000 | 1.0000 |
| Zacanthopsis palmeri | -686.7376 | -760.1803 | 0.0000 | 1.0000 |
| Haniwa quadrata | -400.8708 | -440.5485 | 0.0000 | 1.0000 |
| Liostracina tangwangzhaiensis | -234.3299 | -239.6435 | 0.0656 | 0.9344 |
| Apatokephalus latilimbatus | -398.1783 | -396.8969 | 0.6549 | 0.3451 |
| Olenellus gilberti | -532.0049 | -553.5915 | 0.0000 | 1.0000 |
APPENDIX 1
Studies of trilobites using geometric morphometrics
Abe, F.R. and Lieberman, B.S. 2012. Quantifying morphological change during an evolutionary radiation of Devonian trilobites. Paleobiology , 38:292-307.
Adrain, J.M. 2005. Aulacopleurid trilobites from the Upper Ordovician of Virginia. Journal of Paleontology, 79:542-563.
Adrain, J.M. and Westrop, S.R. 2006. New earliest Ordovician trilobite genus Millardicurus : the oldest known hystricurid. Journal of Paleontology, 80:650-671.
Bignon, A. and Crônier, C. 2012. Evolutionary modifications of ontogeny of three Dechenella species (Proetidae), from the Middle Devonian of the Ardenne Massif (France). Journal of Paleontology, 86:558-566.
Crônier, C. and Fortey, R. 2006. Morphology and ontogeny of an Early Devonian phacopid trilobite with reduced sight from southern Thailand. Journal of Paleontology, 80:529-536.
Crônier, C., Auffray, J.C., and Courville, P. 2005. A quantitative comparison of the ontogeny of two closely‐related Upper Devonian phacopid trilobites. Lethaia, 38:123-135.
Cronier, C., Feist, R., and Auffray, J.C. 2004. Variation in the eye of Acuticryphops (Phacopina, Trilobita) and its evolutionary significance: a biometric and morphometric approach. Paleobiology , 30:471-481.
Delabroye, A. and Crônier, C. 2008. Ontogeny of an Ordovician trinucleid (Trilobita) from Armorica, France: a morphometric approach. Journal of Paleontology, 82:800-810.
Fusco, G., Hughes, N.C., Webster, M., and Minelli, A., 2004, Exploring developmental modes in a fossil arthropod: growth and trunk segmentation of the trilobite Aulacopleura koninckiAmerican Naturalist, 163:167-183.
Gendry, D., Courville, P., Saucède, T., Laffont, R., and Paris, F. 2013. Contribution of morphometrics to the systematics of the Ordovician genus Neseuretus (Calymenidae, Trilobita) from the Armorican Massif, France. Journal of Paleontology, 87:456-471.
Gerber, S. and Hopkins, M.J. 2011. Mosaic heterochrony and evolutionary modularity: the trilobite genus Zacanthopsis as a case study. Evolution, 65:3241-3252.
Hong, P.S., Hughes, N.C., and Sheets, H.D. 2014. Size, shape, and systematics of the Silurian trilobite Aulacopleura koninckii. Journal of Paleontology, 88:1120-1138.
Hopkins, M.J. 2011. How species longevity, intraspecific morphological variation, and geographic range size are related: a comparison using Late Cambrian trilobites. Evolution, 65:3252-3273.
Hopkins, M.J. 2013. Decoupling of taxonomic diversity and morphological disparity during decline of the Cambrian trilobite family Pterocephaliidae. Journal of Evolutionary Biology, 26:1665-1676.
Hopkins, M.J. and Webster, M. 2009. Ontogeny and geographic variation of a new species of the corynexochine trilobite Zacanthopsis (Dyeran, Cambrian). Journal of Paleontology, 83:524-547.
Hughes, N.C. and Chapman, R.E. 1995. Growth and variation in the Silurian proetide trilobite Aulacopleura konincki and its implications for trilobite palaeobiology. Lethaia, 28:333-353.
Hughes, N.C. and Chapman, R.E. 2001. Morphometry and phylogeny in the resolution of paleobiological problems--unlocking the evolutionary significance of an assemblage of Silurian trilobites, p. 29-54. In Adrain, J.M., Edgecombe, G.D., and Lieberman, B.S. (eds.), Fossils, Phylogeny, and Form. Springer.
Hunda, B.R. and Hughes, N.C. 2007. Evaluating paedomorphic heterochrony in trilobites: the case of the diminutive trilobite Flexicalymene retrosa minuens from the Cincinnatian series (Upper Ordovican), Cincinnati region. Evolution and Development, 9:483-498.
Kim, K., Sheets, H.D., Haney, R.A., and Mitchell, C.E. 2002. Morphometric analysis of ontogeny and allometry of the Middle Ordovician trilobite Triarthrus becki. Paleobiology, 28:364-377.
Kim, K., Sheets, H.D., and Mitchell, C.E. 2009. Geographic and stratigraphic change in the morphology of Triarthrus beckii (Green) (Trilobita): a test of the Plus ça change model of evolution. Lethaia, 42:108-125.
MacLeod, N. 2002. Phylogenetic signals in morphometric data, p. 100-138. In MacLeod, N. and Forey, P.L. (eds.), Morphology, Shape and Phylogeny. CRC Press.
McCormick, T. and Fortey, R.A. 1999. The most widely distributed trilobite species: Ordovician Carolinites genacinaca. Journal of Paleontology, 73:202-218.
McCormick, T. and Fortey, R.A. 2002. The Ordovician trilobite Carolinites, a test case for microevolution in a macrofossil lineage. Palaeontology, 45:229-257.
Park, T.-Y. and Choi, D.K. 2011. Ontogeny of the Furongian (late Cambrian) remopleuridioid trilobite Haniwa quadrata Kobayashi, 1933, from Korea: implications for trilobite taxonomy. Geological Magazine, 148:288-303.
Park, T.-Y.S. and Kihm, J.-H. 2015. Post-embryonic development of the Early Ordovician (ca. 480 Ma) trilobite Apatokephalus latilimbatus Peng, 1990 and the evolution of metamorphosis. Evolution & Development,17:289-301.
Park, T.-Y.S., Kihm, J.-H., Kang, I., and Choi, D.K. 2014. Ontogeny of a new species of the Cambrian Series 3 (Middle Cambrian) trilobite genus Liostracina Monke, 1903 from North China and the taxonomic position of the superfamily Trinucleoidea. Journal of Paleontology, 88:395-402.
Sheets, H.D., Kim, K., and Mitchell, C.E. 2004. A combined landmark and outline-based approach to ontogenetic shape change in the Ordovician trilobite Triarthrus becki, p. 67-82. In Elewa, A.M.T. (ed.), Morphometrics: Applications in Biology and Paleontology. Springer, Berlin.
Simpson, A.G., Hughes, N.C., Kopaska-Merkel, D.C., and Ludvigsen, R. 2005. Development of the caudal exoskeleton of the pliomerid trilobite Hintzeia plicamarginis new species. Evolution & Development , 7:528-541.
Smith, L.H. 1998. Asymmetry of Early Paleozoic trilobites. Lethaia, 31:99-112.
Smith, L.H. 1998. Species level phenotypic variation in lower Paleozoic trilobites. Paleobiology, 24:17-36.
Smith, L.H. and Lieberman, B.S. 1999. Disparity and constraint in olenelloid trilobites and the Cambrian radiation. Paleobiology, 25:459-470.
Webber, A.J. and Hunda, B.R. 2007. Quantitatively comparing morphological trends to environment in the fossil record (Cincinnatian Series, Upper Ordovician). Evolution, 61:1455-1465.
Webster, M. 2015. Ontogeny and intraspecific variation of the early Cambrian trilobite Olenellus gilberti, with implications for olenelline phylogeny and macroevolutionary trends in phenotypic canalization. Journal of Systematic Palaeontology, 13:1-74.
Webster, M. and Hughes, N.C. 1999. Compaction-related deformation in Cambrian olenelloid trilobites and its implications for fossil morphometry. Journal of Paleontology, 73:355-371.
Webster, M. and Zelditch, M.L. 2005. Evolutionary modifications of ontogeny: heterochrony and beyond. Paleobiology, 31:354-372.
Webster, M. and Zelditch, M.L. 2011. Evolutionary lability of integration in Cambrian ptychoparioid trilobites. Evolutionary Biology, 38:144-162.
Webster, M. and Zelditch, M.L. 2011. Modularity of a Cambrian ptychoparioid trilobite cranidium. Evolution and Development, 13:96-109.
APPENDIX 2
Description of 3D landmarks taken from each Cryptolithus tesselatus cephalon. All of the following orientations describe a specimen with the anterior margin facing upwards unless otherwise specified.
1. Anterior pit at edge tangent to axial furrow, right side
2. Anterior pit at edge tangent to axial furrow, left side
3. Anterior apodome at edge tangent to axial furrow, right side
4. Anterior apodome at edge tangent to axial furrow, left side
5. Posterior (occipital) apodome at edge tangent to axial furrow, right side
6. Posterior (occipital) apodome at edge tangent to axial furrow, left side
7. Apex of anterior pit (left side in ventral view)
8. Apex of anterior pit (right side in ventral view)
9. Apex of anterior apodome (left side in ventral view)
10. Apex of anterior apodome (right side in ventral view)
11. Apex of posterior (occipital) apodome (left side in ventral view)
12. Apex of posterior (occipital) apodome (right side in ventral view)
13. Node at junction between occipital lobe and posterior margin, right side
14. Node at junction between occipital lobe and posterior margin, left side
15. Fulcrum on posterior border, right side
16. Fulcrum on posterior border, left side
17. Median glabellar tubercle
18. Intersection of preglabellar furrow with sagittal axis
19. Intersection of suture between upper and lower lamellae and sagittal axis
20. Intersection of occipital furrow with sagittal axis
21. Lateral-most extent of furrow along posterior margin of genal lobe, right side. Usually just above interior-most F-pit.
22. Lateral-most extent of furrow along posterior margin of genal lobe, left side
23. Anchor point for semi-landmarks along first internal list, placed where list intersects with posterior margin, left side
24-41. Semi-landmarks along first internal list
42. Anchor point for semi-landmarks along first internal list, placed where list intersects with posterior margin, right side.
APPENDIX 3
Three-dimensional landmark data used in this study in TPS format. Fixed landmarks: 1-23, 42. Semi-landmarks along a curve: 24-41, numbered from left to right. Surface semi-landmarks: 43-67. Landmarks 1, 2, 17, and 18 are redundant with landmarks 63, 67, 55, and 65, respectively. See text and Appendix 2 for more details. Replicates are designated as “A” and “B” (available as txt file).
FIGURE 1. Cephalon of Cryptolithus tesselatus (AMNH FI-101479) showing morphological terms used in this paper, following Whittington (1968) and Hughes et al. (1975). Concentric arcs are labeled according to their placement relative to the girder (expressed on the ventral side): E = external; I = internal. “Fringe-pits” are circled in yellow; the “F-pits” represent a subset of these interior to the labeled concentric arcs. Specimen is 6.6 mm long.
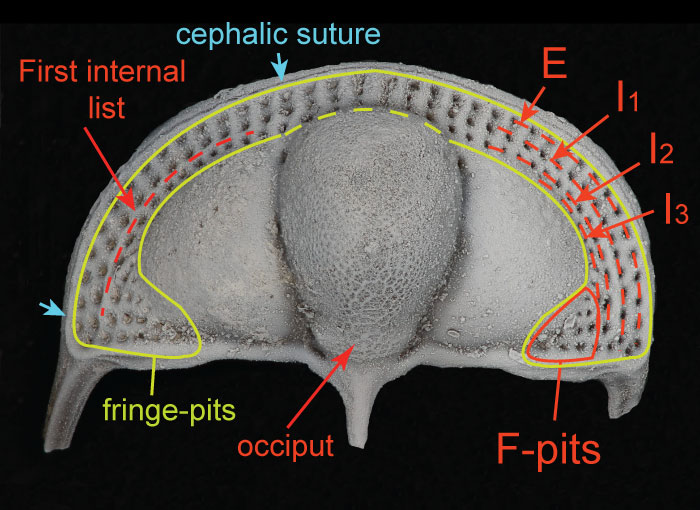
FIGURE 2. Different views of 3D surface model rendering of Cryptolithus tesselatus showing placement of fixed landmarks. All landmarks are indicated at least once, with the exception of 11 (paired with 12). Unpaired landmarks = 17-20; paired landmarks = 1-16, 21-23, 42; semi-landmarks along first internal list shown by dashed line and represented by landmarks 24-41. See Appendix 2 for full description of all landmarks. Surface reconstruction is of AMNH FI-101479.
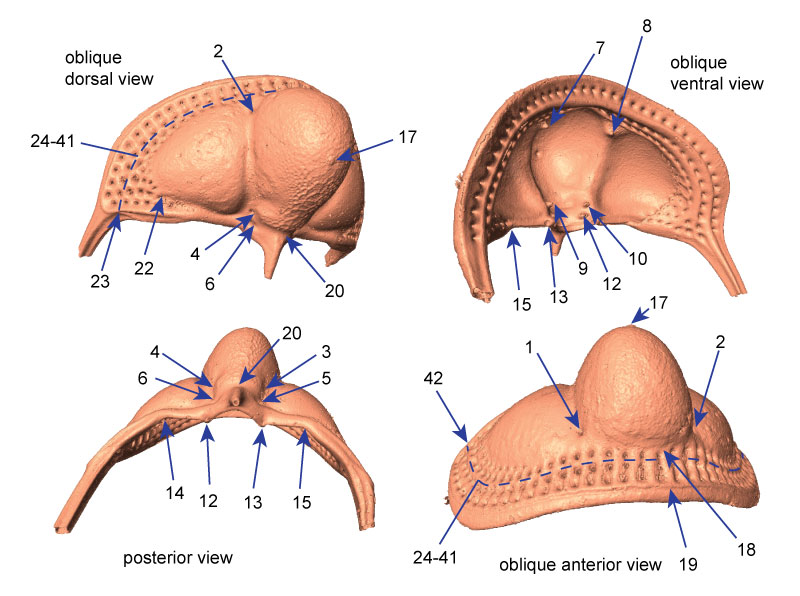
FIGURE 3. Placement of points defining patch on glabella. Points in red are redundant to fixed landmarks as described in the text and Appendix 2. After the surface landmarks were extracted using Landmark Editor, the redundant landmarks were removed from the final data file. Specimen shown is AMNH FI-101482; specimen is 7.1 mm long.
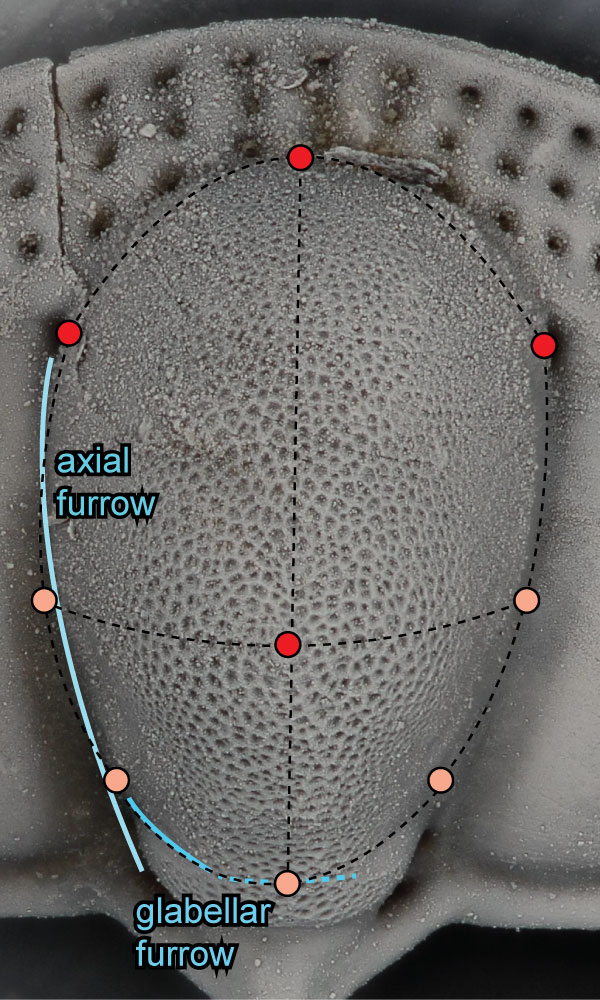
FIGURE 4. Slice through volume rendering of Cryptolithus tesselatus (AMNH FI-101479), shown in dorsal view in inset. Red line in inset shows the orientation of the slice across the specimen. Bright white area is sediment trapped within the bilaminar structure of the cephalon. Blue arrows point to suture between upper and lower lamellae; red arrows point to fringe-pits.
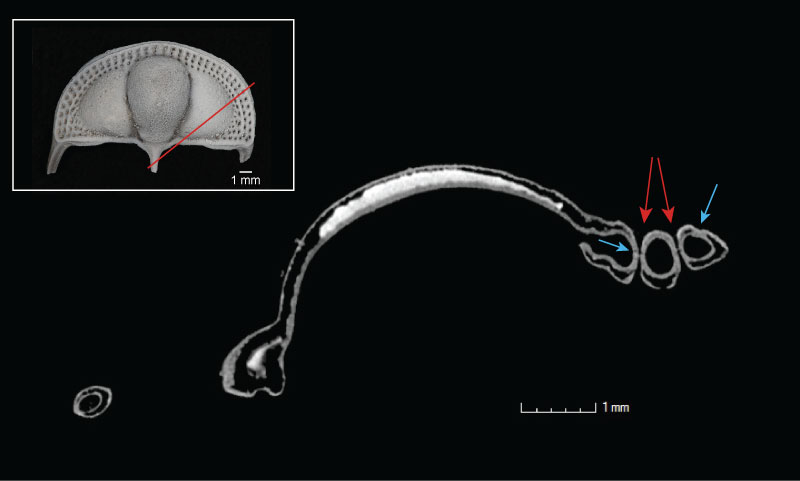
FIGURE 5. Principal components analysis of 3D fixed and semi landmarks. 1, PC 1 vs PC 2; point size represents relative centroid size of specimen. 2-4, Landmark configuration of shape represented by low PC 1 score, typical of largest specimens, in dorsal, anterior, and right lateral views, respectively. 5-7, Landmark configuration of shape represented by high PC 1 score, typical of smallest specimens, in dorsal, anterior, and right lateral views, respectively.
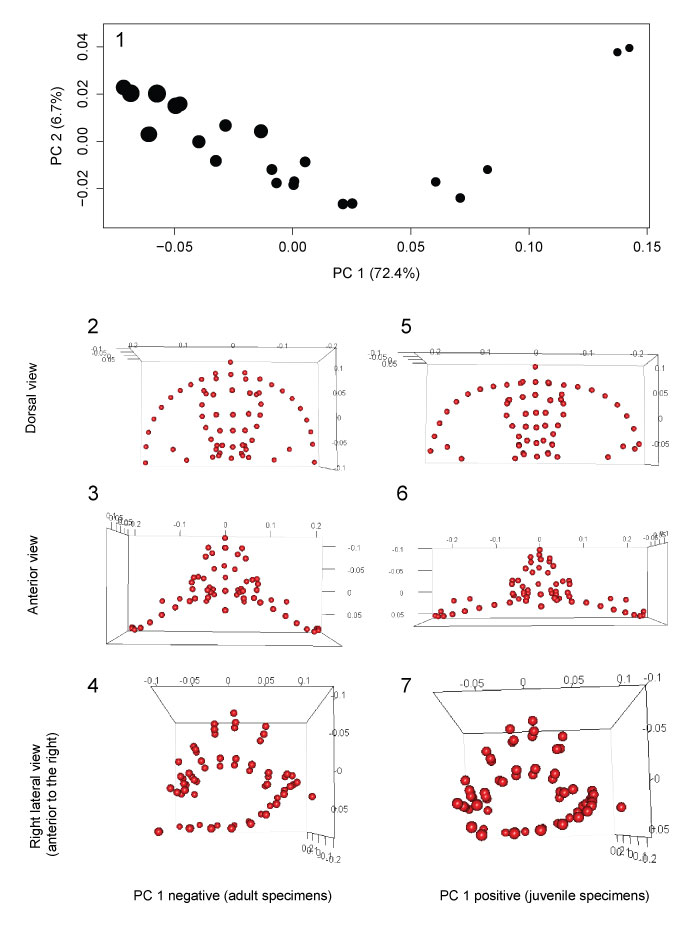
FIGURE 6. Allometric growth in Cryptolithus tesselatus. Size (x-axis) is represented by the natural log of centroid size. Change in shape (y-axis) is represented by the Procrustes distance between each specimen and the smallest specimen in the dataset; the Procrustes distances in this case represent the relative amount of change that specimens underwent during development. Red solid line = linear regression model; blue solid line = threshold model 1; thin black dashed line = threshold model 2; thick black dashed line = threshold model 3. Threshold model 1 is the best supported model.
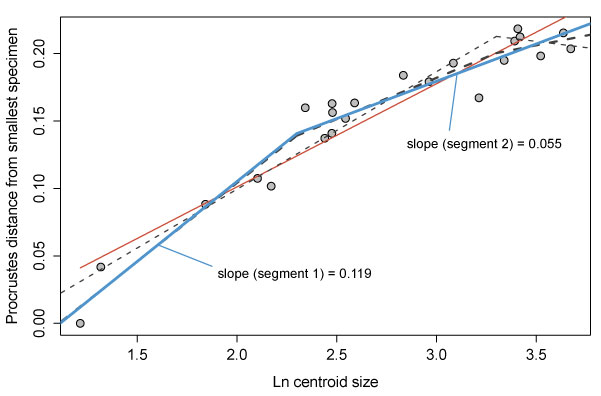
FIGURE 7. Additions of fringe-pits associated with early meraspid stages of ontogeny in Cryptolithus tesselatus. 1, meraspid stage 2 showing two concentric arcs of fringe-pits, AMNH FI-101498, x35. 2, meraspid stage 2 showing two concentric arcs of fringe-pits, AMNH FI-101499, x35. 3, merapid stage 3 showing three concentric arcs of fringe-pits and first few fringe-pits of I3, FI-101496, x20. 4, later meraspid stage showing complete set of fringe-pits, AMNH FI-101494, x15. Scale bars are 1 mm.
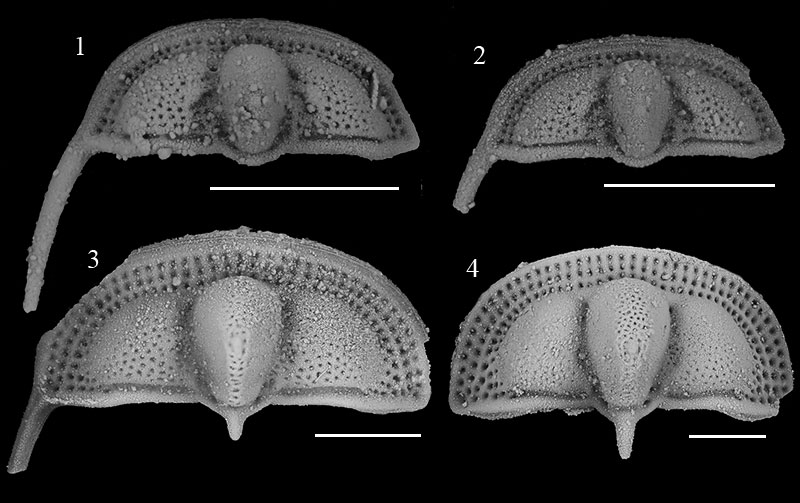
FIGURE 8. Length vs width of Cryptolithus tesselatus cephala, coded for the number of concentric arcs of fringe-pits expressed in each specimen. The first three concentric arcs (E, I1, and I2) are complete when first expressed. Based on clustering, I3 is likely completed over three molts, first by only 1-3 fringe-pits, then 8-10 fringe-pits, then 13-15 fringe-pits with the anteriormost in line with the 10th radial rows of fringe-pits in arcs E-I2. The dataset includes the 23 specimens, which were CT-scanned as well as 31 additional silicified specimens from the collection; specimens that were CT-scanned are outlined in red. Arrows indicate the specimens shown in Figure 1 and Figure 7. Inset in upper right corner is a magnified view of the specimens in the dashed box. The scaling component describing the relationship between length and width is 1.153 (1 = isometric growth).
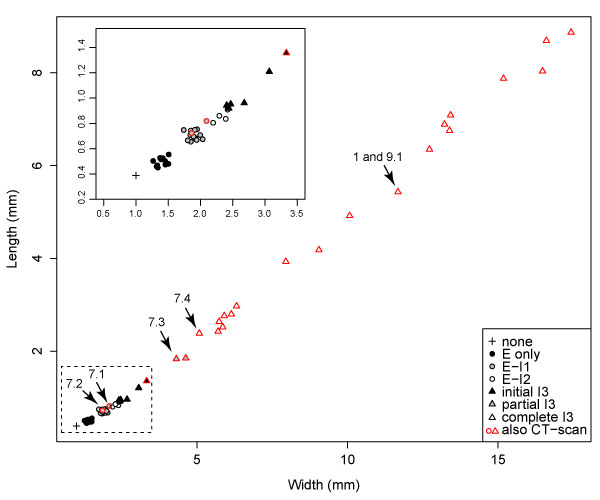
FIGURE 9. Ontogeny of Cryptolithus tesselatus based on 2D geometric morphometrics. 1, Fixed landmarks consistently recognizable in dorsal view. Red dashed line shows curve described by first internal list along which were placed 21 semi-landmarks. Specimen shown is AMNH FI-101479; specimen is 6.7 mm long. 2, Principal components analysis of 2D fixed- and semi-landmarks. Point size represents relative centroid size of specimen. Insets are deformation plots showing shapes represented by largest and smallest PC 1 values. 3, Allometric curve; amount of shape change represented by the Procrustes distance between each specimen and the smallest specimen. Red solid line = linear regression model; blue solid line = threshold model 1; thin black dashed line = threshold model 2; thick black dashed line = threshold model 3. Threshold model 1 is the best supported model (Table 1).
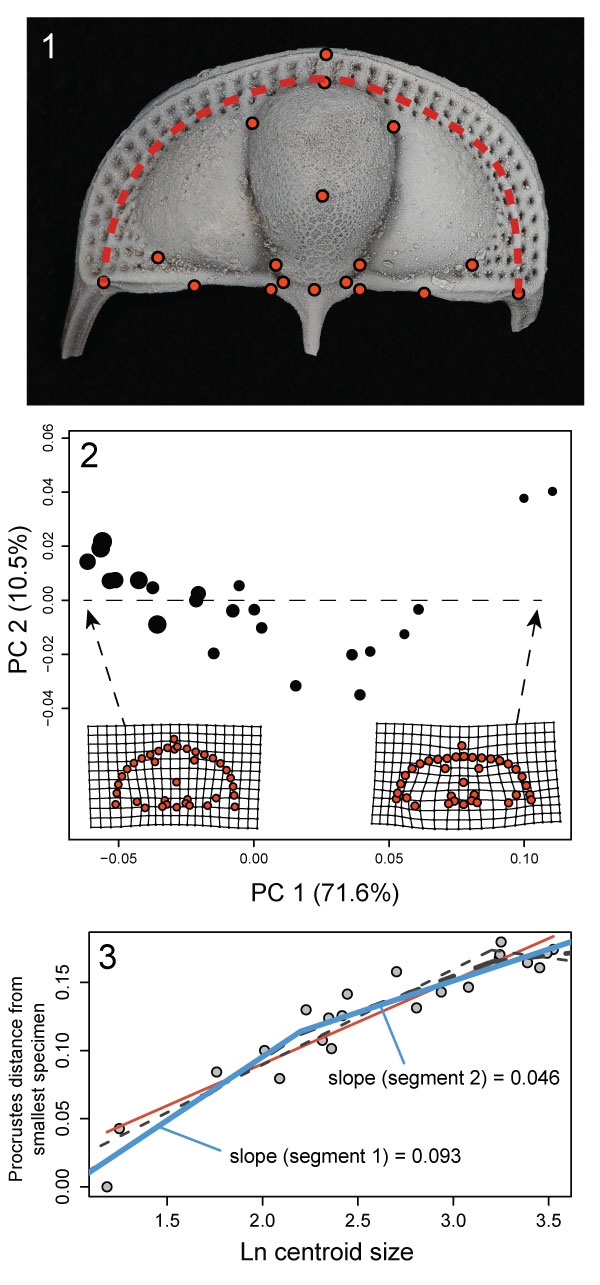
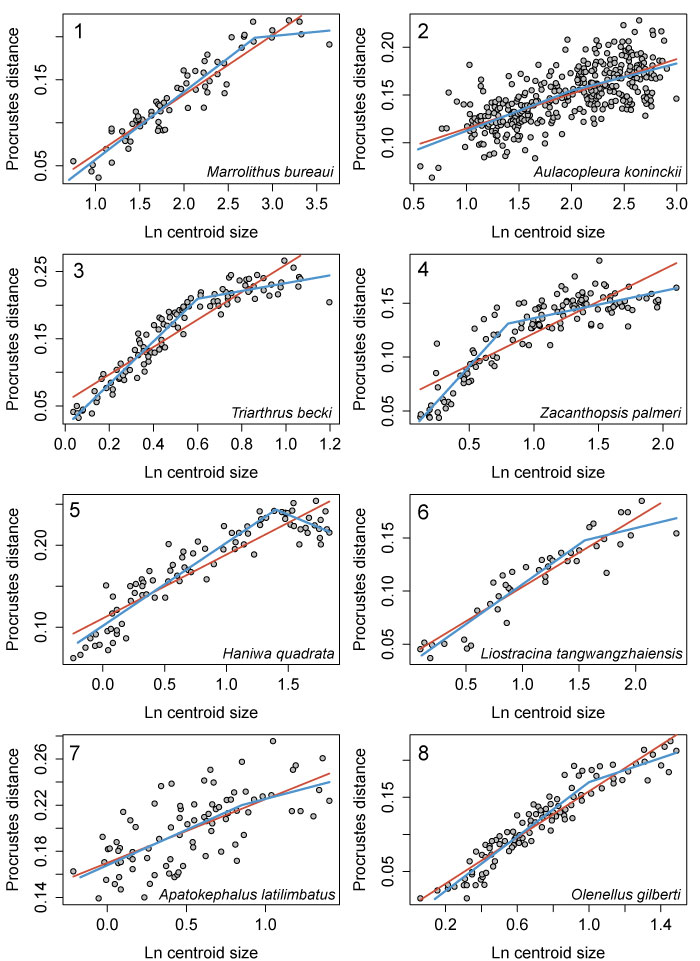
FIGURE 10. Allometry in the cranidia/cephala of other trilobite species as described by 2D geometric morphometrics. 1, Marrolithus bureaui, data from figure 5 of Delabroye and Crônier (2008), breakpoint shown is at 2.8, which was the best supported threshold model (Table 2). 2, Aulacopleura koninckii, data from figure 3 of Hong et al. (2014), breakpoint set at 2.0. 3, Triarthrus becki, data from figure 6 of Kim et al. (2002); breakpoint at 0.6. 4, Zacanthopsis palmeri, data from figure 13 of Hopkins and Webster (2009), breakpoint set at 0.8. 5, Haniwa quadrata, data from figure 5 of Park and Choi (2011b), breakpoint set at 1.4. 6, Liostracina tangwangzhaiensis, data from figure 3 of Park et al. (2014), breakpoint set at 1.55. 7, Apatokephalus latilimbatus, data from figure 4 of Park and Kihm (2015), breakpoint set at 0.85. 8, Olenellus gilberti, data from figure 23B of Webster (2015), breakpoint set at 1.0. Breakpoints are all in units of natural log of centroid size. Red lines = linear regression models; blue lines = threshold models.
Non-linear ontogenetic shape change in Cryptolithus tesselatus (Trilobita) using three-dimensional geometric morphometrics
Plain Language Abstract
Because trilobites molted throughout growth, it is possible to reconstruct shape change from larval to adult stages. Geometric morphometrics has been useful for describing this shape change quantitatively, but has been limited to just two-dimensions because of technological limitations in imaging the smallest specimens. Here we demonstrate that high-resolution scanning methods applied to specimens with a particular mode of preservation can be used to efficiently capture and quantify shape in three-dimensions, even for very small trilobite specimens. We use this dataset to show that rates of shape change shifted during development, at a stage earlier than typically supposed for other trilobite species. We also show that models that allow for a shift in rate of shape change are better at describing development in trilobites than linear models.
Resumen en Español
Cambio morfológico ontogenético no linear en Cryptolithus tesselatus (Trilobita) usando morfometría geométrica tridimensional
Para numerosas especies de trilobites se ha documentado un descenso en la tasa de cambio de forma cefálica tardíamente en la ontogenia, posiblemente en asociación con el cese de emisión de segmentos hacia el tórax. Descripciones cualitativas de la ontogenia de Cryptolithus tesselatus Green, 1832 sugieren que el cambio de forma en el céfalo estaba fuertemente influenciado por la acomodación progresiva de grandes perforaciones en forma de embudo ("fringe-pits") a lo largo de varias mudas. El número y arreglo de estas perforaciones era establecido tempranamente en la ontogenia, pero antes de que la emisión de segmentos torácicos estuviera completa. Debido a la forma inusual y sumamente convexa del céfalo, utilizamos morfometría geométrica tridimensional (3D) para cuantificar el cambio de forma en esta especie y determinar si existe un cambio en la tasa y en qué punto del desarrollo ocurría. La morfometría 3D fue posible extrayendo marcas (landmarks) fijas y semi-marcas de reconstrucciones de la superficie de C. tesselatus obtenidas mediante escaneos CT de especímenes silicificados. Los resultados muestran que la forma del céfalo continuaba cambiando al entrar en la adultez, pero que un modelo umbral con un cambio de tasa asociado al cese de nuevas perforaciones es mejor soportado. Las marcas 2D tomadas de la vista dorsal no captan el cambio dramático en la convexidad del céfalo durante el desarrollo, pero los resultados de la comparación de modelos son consistentes con aquellos basados en los datos de las marcas 3D, permitiendo la comparación de este aspecto de cambio ontogenético con otras especies. En base a estas comparaciones, pareciera que 1) las trayectorias son generalmente mejor caracterizadas por modelos umbral que por modelos de regresión linear simple; 2) la regulación temporal de los cambios puede no estar conservada filogenéticamente.
Palabras clave: trilobites; escaneo CT; silicificación; morfología funcional; ontogenia
Traducción: Diana Elizabeth Fernández
Résumé en Français
Changements de forme non linéaires au cours de l'ontogénie chez Cryptolithus tesselatus (Trilobita) caractérisés par la morphométrie géométrique tridimensionnelle
Une diminution du taux de changement de forme du céphalon au cours de l'ontogénie tardive a été documentée chez plusieurs espèces de trilobites, potentiellement associée avec l'arrêt de l'intégration des segments du pygidium dans le thorax. Les descriptions qualitatives de l'ontogénie de Cryptolithus tesselatus Green, 1832, suggèrent que le changement de forme du céphalon était fortement influencé par la mise en place progressive de grosses perforations en forme d'entonnoirs (« fringe-pits ») au cours des mues successives. Le nombre et l'organisation des « fringe-pits » étaient établis tôt dans l'ontogénie, mais avant la fin de l'intégration des segments thoraciques. En raison de la forme inhabituelle et fortement convexe du céphalon, nous utilisons la morphométrie géométrique tridimensionnelle (3D) pour quantifier les changements de forme chez cette espèce et déterminer s'il y a eu un changement de taux, et à quel moment du développement ce changement a eu lieu. La morphométrie 3D a été rendue possible en extrayant des points-repères fixes et des semi-points-repères à partir des reconstructions de surfaces de C. tesselatus issues de scans (tomodensitométrie assistée par ordinateur) de spécimens silicifiés. Les résultats indiquent que le céphalon continuait de changer de forme à l'âge adulte, mais qu'un modèle de seuil avec un changement de taux associé à l'arrêt de la mise en place de nouveaux « fringe-pits » est le mieux soutenu. Les points-repères 2D pris sur la vue dorsale ne permettent pas de capturer le changement spectaculaire de convexité du céphalon pendant le développement, mais les résultats comparés au modèle sont cohérents avec ceux basés sur le jeu de données 3D, permettant une comparaison de cet aspect du changement ontogénétique avec d'autres espèces. D'après ces comparaisons, il apparait que 1) les trajectoires sont souvent mieux caractérisées par des modèles de seuil que des modèles de régression linéaire simples ; 2) le timing des changements n'est peut-être pas conservé ontogénétiquement.
Mots-clés : trilobites ; tomodensitométrie assistée par ordinateur ; silicification ; morphologie fonctionnelle; ontogénie
Translator: Antoine Souron
Deutsche Zusammenfassung
Nicht-lineare ontogenetische Formänderung bei Cryptolithus tesselatus (Trilobita) unter Anwendung dreidimensionaler geometrischer Morphometrie
Für einige Trilobiten-Arten wurde ein Rückgang der cephalen Formänderungsrate während der späten Ontogenie dokumentiert, was möglicherweise mit der Abschluss der Rumpfsegmentbildung zusammenhängt. Qualitative Beschreibungen der Ontogenie von Cryptolithus tesselatus Green, 1832, legen nahe, dass die Formänderung im Cephalon stark durch eine fortschreitende Aufnahme von großen trichterförmigen Perforationen („Fransengruben") während mehrere Häutungen beeinflusst war. Die Anzahl und die Anordnung der Fransengruben wurde früh während der Ontogenie angelegt, jedoch vor dem Abschluss der Rumpfsegmentbildung. Wegen der unüblichen und hohen Konvexität des Cephalons verwenden wir dreidimensionale (3D) geometrische Morphometrie zur Quantifizierung der Formänderung bei dieser Art und legen fest ob eine Ratenänderung vorliegt und an welchem Punkt der Entwicklung diese Änderung auftauchte. 3D Morphometrie wurde ermöglicht indem feste und Semi-Orientierungspunkte aus Oberflächenrekonstruktionen von C. tesselatus, gerendert aus CT-Scans verkieselter Stücke, extrahiert wurden. Die Ergebnisse zeigen, dass das Cephalon bis ins Erwachsenenalter seine Form veränderte, dass jedoch ein Schwellenmodell mit einer Wechselrate, die mit dem Abschluss neuer Fransengruben assoziiert ist, am besten unterstützt wird. 2-D Orientierungspunkte aus der Dorsalansicht können den dramatischen Konvexitäts-Wechsel des Cephalons während der Entwicklung nicht erfassen aber Modellvergleiche stimmen mit denen überein, die auf dem 3D Orientierungspunkt-Datensatz basieren und erlauben so diesen Aspekt des ontogenetischen Wandels mit anderen Arten zu vergleichen. Basierend auf diesen Vergleichen wird ersichtlich, dass 1) Trajektorien oft besser durch Schwellenmodelle charakterisiert werden als durch einfache lineare Regressionsmodelle; 2) der Zeitpunkt der Änderungen möglicherweise nicht phylogenetisch erhalten ist.
Schlüsselwörter: Trilobiten; Computertomographie; Verkieselung; funktionale Morphologie; Ontogenie
Translator: Eva Gebauer
Arabic
Translator: Ashraf M.T. Elewa
-
-
PE: An influential journal
 Palaeontologia Electronica among the most influential palaeontological journals
Article number: 27.2.2E
July 2024

 A Review of Handbook of Paleoichthyology Volume 8a: Actinopterygii I, Palaeoniscimorpha, Stem Neopterygii, Chondrostei