

 Exploring the paleobiology of ammonoids (Cretaceous, Antarctica) using non-invasive imaging methods
Article number: 22.3.57
https://doi.org/10.26879/1007
Copyright Paleontological Society, September 2019
Author biography
Plain-language and multi-lingual abstracts
PDF version
Submission: 9 July 2019. Acceptance: 14 August 2019.
{flike id=2604}
ABSTRACT
Based on medical computed tomography (CT) data, herein I document the ontogenetic changes in conch morphology of Maorites densicostatus and M. seymourianus. For this purpose, 20 specimens were measured in 30° steps starting from a shell diameter of 10 mm, to obtain the ontogenetic trajectories of several conch parameters. Results show that four morphological parameters, aperture height, whorl height, whorl width, and umbilical width have a low variation and can be easily modeled. In contrast, derived indices and whorl expansion rates show a high variation, and their ontogenetic trajectories can be categorized in two stages: the first stage is identified by a rapid morphological change (Perlatum stage), followed by a second stage showing a stable conch morphology (Gibbosum stage). Furthermore, the ontogenetic trajectories revealed that in adulthood, M. densicostatus exhibits similar morphologies to juveniles and sub-adults of M. seymourianus. This phenomenon could indicate a possible size-based heterochronic shift (paedomorphosis) as a possible evolutionary mechanism.
Daniel A. Morón-Alfonso. Universidad de Buenos Aires, Facultad de Ciencias Exactas y Naturales, Departamento de Ciencias Geológicas, Área de Paleontología, Ciudad Universitaria, Pab. 2, C1428EGA, Buenos Aires, Argentina. Paleokarzis@gmail.com; https://sites.google.com/view/lifespiral/home
Keywords: Cephalopoda; ammonoids; palaeobiology; Antarctic; Maorites; computed tomography
Morón-Alfonso, Daniel A. 2019. Exploring the paleobiology of ammonoids (Cretaceous, Antarctica) using non-invasive imaging methods. Palaeontologia Electronica 22.3.57 1-17. https://doi.org/10.26879/1007
palaeo-electronica.org/content/2019/2716-exploring-ammonoid-paleobiology
Copyright: September 2019 Paleontological Society.
This is an open access article distributed under the terms of Attribution-NonCommercial-ShareAlike 4.0 International (CC BY-NC-SA 4.0), which permits users to copy and redistribute the material in any medium or format, provided it is not used for commercial purposes and the original author and source are credited, with indications if any changes are made.
creativecommons.org/licenses/by-nc-sa/4.0/
INTRODUCTION
Recent advances in computed tomography (CT) have allowed us to obtain new information about fossils, otherwise only attainable through destructive methods (e.g., serial grinding tomography; Sutton et al., 2014). Ammonoids are an important extinct group consisting of cephalopods with a chambered, external shell (similar to the modern Nautilus), that inhabited the oceans from the Early Devonian to the end of the Cretaceous period. The application of CT techniques in this group has provided useful data about the complex internal architecture of the shell, buoyancy, structural strength, and the ontogenetic increase in chamber complexity (e.g., Hoffmann et al., 2014, 2015a, b; Tajika et al., 2014, 2015; Lemanis et al., 2015, 2016a, b), and enables new descriptions of relevant elements for the taxonomy and phylogeny of the group (e.g., the radulas; Takeda et al., 2016).
Most recently, Hoffmann et al. (2018) combined measurements of 2D classical shell parameters and high-resolution nano-CT based three-dimensional (3D) data (e.g., surface area to volume ratios) to describe the ontogenetic transformations in conch morphology of Kosmoceras. A similar approach is employed herein; based on data collected from a medical CT scan of 20 specimens, I analyzed the intra- and interspecific variation of two kossmaticeratid species, Maorites densicostatus (Kilian and Reboul, 1909) and Maorites seymourianus (Kilian and Reboul, 1909) from the López de Bertodano Formation (James Ross Basin, Antarctica).
 Geology and stratigraphy
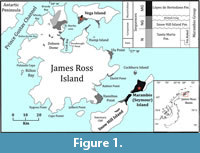
The studied species were collected from the upper section of the López de Bertodano Formation (James Ross Basin), which forms the upper portion of the ~3000 m thick Marambio Group (Santonian─Danian; Olivero, 2012). This unit crops out over ~70 km2 on the southern side of Vicecomodoro Marambio Island (Seymour Island in English literature), the neighboring Snow Hill Island, and is also represented in the Sandwich Bluff Member at Vega Island (Crame et al., 2004; Francis et al., 2013; Olivero et al., 2008; Pirrie et al., 1997; Figure 1). The middle and upper portion of the López de Bertodano Formation was deposited during a marine transgression leading to the establishment of mid to outer shelf environments. The uppermost part of this formation across the Cretaceous-Paleogene boundary was apparently deposited during a regressive phase (Crame et al., 2004; Macellari, 1988; Olivero, 2012).
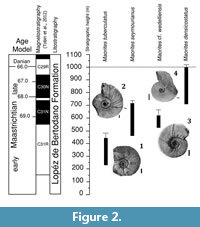
According to the model proposed by Witts et al. (2015), the López de Bertodano Formation is Maastrichtian to earliest Danian in age. Based on this model, M. seymourianus appears at around 225 m and ranges up to 700 m in the López de Bertodano Formation section at Marambio Island, going extinct at approximately 68.3 Ma (Figure 2). This species is replaced in the section by M. densicostatus, which ranges from 700 m to 1000 m in the sequence, and is recorded up to the Cretaceous-Paleogene boundary identified by the iridium anomaly (Figure 2).
MATERIAL AND METHODS
 Systematic notes
According to Marshall (1928), the kossmaticeratid genus Maorites (Campanian-Maastrichtian) is characterized by compressed forms similar to Puzosia (Aptian-Maastrichtian). Maorites ornamentation consists of: prosiradiate ribs generally thin and sinuous crossing the venter without interruption, that bifurcate at the middle of the flank, umbilical nodes that extend radially, and deep prosiradiate constrictions. The suture line is also similar to that of Puzosia, but the first lateral lobe is deeper while the external lobe is wider. Maorites is also comparable to Marshallites (Upper Aptian-Upper Cenomanian) but differs in having stronger nodes. This genus is abundant and widely distributed in Antarctica (Graham land), Argentina, Australia, Chile, Madagascar, New Zealand, and South Africa (Zululand; Macellari, 1986).
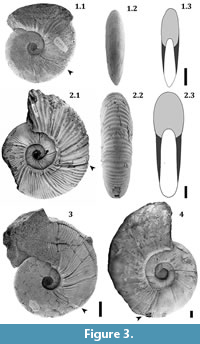
M. seymourianus is a relatively large species (diameter [dm] = 150-300 mm) characterized by being subevolute with strong ribs, strong nodes, and straight and wide constrictions (Figure 3). In contrast, M. densicostatus includes smaller subinvolute forms (dm = 120-200 mm) with thin ribs that are closely spaced, weak nodes, and thin and sinuous constrictions (Figure 3). Both species are discoidal and share an almost identical suture line (see Macellari, 1986).
Ammonoid specimens
 The material consists of 20 specimens collected during the Antarctic campaigns of the Instituto Antártico Argentino in 1990 and 1991 in Marambio and Vega Islands. The material is housed at the collection of the Facultad de Ciencias Exactas y Naturales, Universidad de Buenos Aires (Argentina) under the acronym CPBA. Thirteen of the samples correspond to M. seymourianus (CPBA-16794, CPBA-16805, CPBA-16814, CPBA-16819, CPBA-16830, CPBA-16836, CPBA-16837, CPBA-16838, CPBA-16840, CPBA-16846, CPBA-16851, CPBA-16852, CPBA-8857.1) and seven samples to M. densicostatus (CPBA-16826, CPBA-16856, CPBA-17199.1, CPBA-17199.2, CPBA-17199.3, CPBA-17199.4, CPBA-8857.6; for more information on the specimen see Appendix 1). All specimens are excellently preserved as non-deformed 3D objects, exhibiting several whorls without a sedimentary fill and retaining most of the original shell wall (frequently one flank is better preserved). The body chamber is rarely complete, and some samples are preserved within carbonate concretions.
Computed tomography
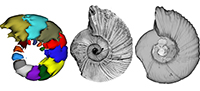
The 20 specimens were scanned using a 64-detector multislice medical scanner, available at the Clínica la Sagrada Familia (Buenos Aires, Argentina) in April 2017. The following configuration was implemented pitch = 1, at 140 Kv and 254 mA, with a spatial resolution of 0.4 mm. The CT scan data obtained were stored as a 2.32 GB DICOM file, available at the Facultad de Ciencias Exactas y Naturales, Universidad de Buenos Aires. The digital visualization and three-dimensional reconstruction of the CT data were performed using the software 3D Slicer v.4.8.0 (Federov et al., 2012). Manual segmentation was not employed during the reconstruction process, due to the size of the specimens and the complexity of sutures. Instead, the GrowCut segmentation module of 3D Slicer v.4.8.0 was employed, which consists of a region growing algorithm based on the isosurfaces approach (Vezhnevets and Konouchine, 2005; Figure 4).
Morphometric parameters
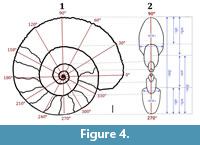 Morphometric data through ontogeny were collected according to tomogram visualization and virtual whorl sections of each specimen in 30° steps, following the procedure described by Korn (2010), Klug et al. (2015), and Hoffmann et al. (2018). The minimum diameter was 10 mm, because at lower diameters the structures could not be resolved in the tomograms. The following parameters were measured at 308 points: diameter (dm), aperture height (ah), whorl height (wh), whorl width (ww) and umbilical width (uw; Figure 4). Some related indices and whorl expansion rates were also calculated: Conch width or conch shape index (CWI)= ww/dm, umbilical width index (UWI) = uw/dm, whorl expansion rate (WER) = (dm1/dm2)2, and whorl width index (WWI) = ww/wh. Furthermore, to estimate the accuracy of the method, calip 2)2, and whorl width index (WWI) = ww/wh. Furthermore, to estimate the accuracy of the method, caliper measurements of diameters from the specimens were obtained before scanning.
As the direct measurement of the area from tomograms is complic er measurements of diameters from the specimens were obtained before scanning.
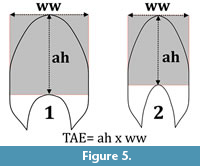
As the direct measurement of the area from tomograms is complicated (because perfect shell orientation is difficult to obtain in a medical CT scan), here I propose a new derived parameter to estimate the area in a whorl section referred to as "Theoretical Area Estimate" (TAE). The TAE can be used as a species-species comparative metric that estimates the cross-sectional whorl area as a rectangular box whose dimensions are the aperture height and the whorl width: TAE = ah x ww (Figure 5).
Statistical analysis
 In order to summarize the ontogenetic variation of multiple specimens, a model curve (ontogenetic trajectory) was determined for each parameter using polynomial fit and LOWESS algorithm (LOcally WEighted Scatter plot Smoothing; Cleveland, 1979) with a smoothing factor of 0.2. An important point to consider is that indices are derived from other parameters (dm, ah, wh, ww), each with an associated standard error. Therefore, the deviation of each parameter contributes to the index function, and the total error increases. In order to solve this problem bootstrap confidence intervals were calculated to estimate the 95% confidence band for each parameter, which allows the detection of outliers and simplifies the interpretation of the results. The software Past 3.21 (Hammer et al. 2001) was used for all the statistical analyses.
RESULTS
In this work, 1121 measurements were collected, 252 belonging to M. densicostatus and 869 to M. seymourianus (see Appendix 2). Results show that whorl shape parameters (ah, wh, ww) are continuous, correlate with themselves, have a low variation, and can thusly be accurately modeled (Table 1). By contrast, indices and whorl expansion rates display a high variation, and their ontogenetic trajectories show two independent ontogenetic stages. The first stage consists of a rapid morphological transition (e.g., sudden increase of involution or compression), which is followed by a second stage showing a stable conch morphology. These stages were recognized first by Cecca et al. (2016), who referred to the morphologic transitional phase as the Perlatum stage, and to the continuous phase as the Gibbosum stage. This same terminology will be used here throughout.
 Ontogeny of Maorites seymourianus
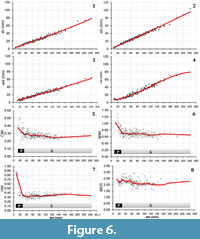
At diameters over 10 mm M. seymourianus possesses a conch morphology that is discoidal (CWI = 0.50), weakly depressed (WWI = 1.28), and evolute (UWI = 0.88; Figure 6). The conch shows a rapid morphological change increasing its involution and decreasing in whorl width. This transitional stage (Perlatum stage) continues up to approximately 26 mm in diameter, at which point the ontogenetic trajectories turn constant and the conch morphology stabilizes. In the Gibbosum stage the conch morphology is extremely discoidal (CWI = 0.22-0.34), weakly compressed (WWI = 0.57-0.86), and subevolute (UWI = 0.27-0.41; Figure 6). Specimen CPBA-16819, the largest in the collection (dm = 242 mm) and here interpreted as a macroconch, exhibits a complete body chamber showing stronger ornamentation and a terminal constriction that differs in angle with respect to the earlier ones (Figure 3.4). The stronger ornamentation in the adult body chamber and the distinct terminal constriction could indicate a third stage likely related to adulthood. These features are also observable in other specimens with an incomplete body chamber (Figure 3.2).
 Ontogeny of Maorites densicostatus
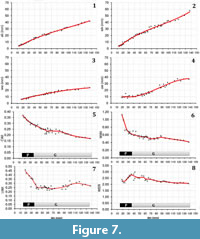
At diameters over 16 mm (the limit of accuracy for this species due to preservation constraints), the morphology of M. densicostatus is similar to M. seymourianus, showing a conch morphology that is discoidal, (CWI = 0.37), weakly depressed (WWI = 1.11), and subevolute (UWI= 0.46; Figure 7). The Perlatum stage in this species ends at approximately 36 mm in diameter and is characterized by a rapid increase in involution and compression. In the Gibbosum stage this species shows a constant umbilical width index (UWI = 0.22-0.27), whorl expansion rate (WER=2.3-2.5), and a decrease in the negative gradient of the whorl width index (WWI=0.4-0.55; Figure 7). The adult body chamber begins at about 100 mm in diameter, exhibiting the same shift in ornamentation observed in M. seymourianus. In adulthood, the involution and the whorl expansion rate decrease, both parameters reaching similar values to juveniles and sub-adults of M. seymourianus (Figure 7.6-7).
DISCUSSION
A theoretical framework for CT based data
As in many methodologies, when processing information using CT scanning techniques, the data produced can be corrupted or lost. In order to detect and categorize these defects, Pinter et al. (2016) offered a theoretical framework stating premises that must be met in order to determine that the data are reliable. Here I propose an inference degree-based classification employing this theoretical framework that can be applied to paleontological data. Inferences are a logic observation or conclusion based on premises; if any of these premises are not fulfilled, the data obtained is unreliable. First-degree inferences are based on the original sample, so they do not require fulfilling any premise and the data obtained are reliable. Second-degree inferences are raised based on tomograms (or slices). In this case, a premise must be fulfilled referred to herein as “Validity ”, stating that the visualized structure exists and is not an artefact produced during scanning or another close structure that is deformed (e.g., sample vibration during data acquisition or low spatial resolution can cause blurring or duplicated structures; Vidal et al., 2005; Davis and Elliott, 2006). If these sources of error are not corrected during processing and segmentation, they can have a drastic influence on any further calculations. Third-degree inferences are based on 3D models and need to fulfill three premises: (1) “Operation”: The user must be acquainted with the reconstruction method and the data transformation processes, as certain algorithms can alter the data (especially for volumes and detailed structures). (2) “Coherence”: The structure from which an inference is made must be an unified whole, similar to what is visualized in the tomography. The structure is incoherent when multiple parts of itself are represented in other regions outside the model. During the reconstruction process, the user can overlook small additions outside the field of view (especially when employing automatic segmentation methods), these small additions can alter volume calculations, and other analyses such as the center of mass and the center of geometry. (3) “Identity”: The user must know where the structures come from and what they represent. Frequently, during the reconstruction process, the user must erase additions that do not belong to the real structure (especially in fossil samples due to the variable preservation). Deciding what to erase is a subjective interpretation and can be a source of error. As a general rule, the uncertainty diminishes as the spatial resolution increases (Sutton et al., 2014). Medical CT scanning is a relatively low spatial resolution technique (0.3-3 mm) compared to other computed tomographic methods, such as micro-CT and synchrotron techniques, so these premises must be considered when an inference or measurement is made.
Error discussion
When comparing caliper measurements from the samples (control) with measurements from the tomograms at the same points, I found that the difference between these values is around two times the spatial resolution (<0.8 mm). In contrast, when comparing the control measurements with the ones taken from the 3D models, the differences were remarkably high (around three times the spatial resolution 1.6 mm). That the error is a multiple of the voxel size is a product of the linear measurement of the blocks that compound the tomography. If the size of an object is 10 mm and the voxel size is 1 mm, ten voxels will be necessary to accurately measure such size. If there is an overestimation of the object or air boundary by one voxel layer, when the object is measured the size result will be 12 mm, with an error of two times the voxel size. Likewise overestimating it by two voxel layers would be an error of four times the voxel size, since we are adding two boxes to each side of the boundary. These result will not always be a perfect multiple of the voxel size though due to different partial volume averaging along different curvatures and angles. This circumstance can explain some of the parameter variation in this work.
In terms of the data lost during the reconstruction process due to the lack of spatial resolution, 3D models exhibit three main differences with respect to the original specimens. These differences can be characterized as follows:
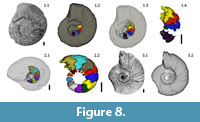 1) Lack of ornamentation: Relief fluctuations under the spatial resolution (<0.4 mm) cannot be resolved in the tomograms. Consequently, 3D models of the conch usually lack ornamentation. (Figure 8.1-3).
2) Low contrast of inner walls limits of the conch: Occasionally, boundaries of the shell wall are diffuse because the matrix and the aragonite shell component have similar absorption properties. The shell wall was visible in the tomograms but was not detected by the segmentation algorithm.
3) Underestimation of chamber volumes and absence of sutures: Chamber volumes obtained from the models are always smaller than the volume observed from the original sample. At conch diameters under 20 mm, septa are so thin that they are visualized as diffuse structures. Accordingly, the space occupied by the septa is exaggerated, and chamber models are considerably smaller. The proportional underestimation increases drastically as the size decreases (Figure 8.2).
When working with medical CT scan based data, the operation premise is not fulfilled, as we can determine that during the reconstruction process the data were altered. Consequently, third-degree inferences based on the 3D models are unreliable. Considering the difficulties of 3D measuring (e.g., orientation, artifacts) and the data lost during the reconstruction process (produced by the low spatial resolution), it is always better to appeal to second-degree inferences based on tomograms. In order to get better results from 3D models, we should use methods with a higher resolution such as micro- or nano-CT scanning (Sutton et al., 2014).
Intraspecific variation
Inferences about the intraspecific variation for Maorites seymourianus are more reliable given the greater number of samples. For this species, the aperture height and the whorl height are the less variable parameters, especially at diameters under 16 mm (Figure 6.1-2). A higher variation can be seen in the whorl width and the umbilical width (Figure 6.3-4). These parameters are more affected in variations in the preservation and are more susceptible to measurement errors, which could explain some of these results.
In general, indices show a high intraspecific variation, and the Perlatum and Gibbosum stages can be identified in the ontogenetic trajectories of these parameters (Figure 6.5-8). With respect to the whorl expansion rate, the intraspecific variation is high throughout ontogeny, showing a local maximum at around 26-30 mm in diameter (Figure 6.7).
The same pattern of ontogenetic variation can be seen in M. densicostatus. The aperture height, the whorl height, the umbilical width, and the whorl width show a low variation. In contrast, indices and whorl expansion rates exhibit high variation (Figure 7). Furthermore, we can also identify a Perlatum and Gibbosum stage in this species (Figure 7.5-8).
A third final stage related to adulthood can also be observed on both species. This stage is characterized by stronger ornamentation and the appearance of a terminal constriction with a distinct change in angle (Figure 3).
The morphological transformation during the Perlatum stage in the studied species could be associated with a change in the life habit, and might be a continuation of the paralarval stage (Young and Harman, 1988). Concerning sexual dimorphism, in accordance with Macellari (1986), there seems to be a bivariate size distribution, showing microconchs and macroconchs in both species as seen in other ammonoids (Klug et al., 2015). Macellari (1986) also noted subtle ornamentation differences in rib density and constriction morphologies for both species, indicating a possible sexual disparity. However, there is no evidence from the data collected in this study consistent with this observation, and complete body chambers with a preserved peristome are rare. Therefore, there is no other reliable indicator of sexual dimorphism beyond adult size.
Interspecific variation
The search for criteria to define species is a strongly debated issue (Klug et al., 2015). In ammonoids, it is a challenging task due to the high diversity, homoplasy (i.e. ammonoids that belong to different higher taxa develop similar morphologies), and often strong variation, especially in closely related taxa in which the differences between morphs are gradual. The results presented here suggest possible characters that can be used to define species, at least within the Kossmaticeratidae.
Macellari (1986) highlighted the main differences between M. seymourianus and M. densicostatus, stating that M. densicostatus is, in many cases, impossible to distinguish from M. seymourianus using isolated fragments. An interesting fact noted by this author is that, in diameters smaller than 40 mm, M. densicostatus is very similar to other genera such as Jacobites, and Karapadites (Riccardi, 1983) implying some relation to these genera. In the present work, the ontogenetic trajectories shed light upon the differences between the studied species, and could be useful in determining the phylogenetic relationships for Maorites.
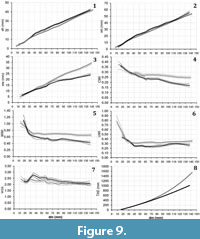 Both the aperture height and the whorl height for the two Maorites species share similar values through ontogeny (Figure 9.1-2); however, a difference in the order from the polynomial function is observed (Table 1). At diameters under 38 mm, the ontogenetic trajectories of the whorl width, the conch width index, the umbilical width index, and the whorl width index are nearly identical (Figure 9.3-5). With increasing diameter the ontogenetic trajectories split, taking lower values for M. densicostatus, showing a strong increase in compression and involution (Figure 9.3-5). Later, around 100 mm in diameter, the ontogenetic trajectories of the umbilical width index and whorl expansion rate tend to converge again (Figure 9.6-7).
The reasons for the low interspecific variation in some parameters such as the aperture height and whorl height could be related to constructional constraints that are still unknown. A possible reason is that there are many important structures in the central plane of the organism linked to these parameters (especially to the aperture height) restricting the variation (e.g., buccal mass, brain, digestive tract; see Klug et al., 2012). In contrast, the whorl width and the umbilical width, parameters that may not have a strong structural limitation, are more variable and could be constrained by other causes. An explanation could be the fact that these parameters have been classically related to the hydrodynamic properties of the ammonoid conch (Ritterbush and Bottjer, 2012; Westermann, 1996); nonetheless, this pattern is still unclear, particularly for the whorl width because it depends on flank preservation and strongly correlates with the aperture height and the whorl height. The study of the variation of these parameters in other ammonoid species could explain this issue.
Evolutionary trends
Macellari (1986) noted that there is an increase in shell compression through time in ammonoids of the families Pachydiscidae and Kossmaticeratidae from the López de Bertodano Formation (Macellari, 1986 p.10, fig. 7). In Maorites this trend is associated with an increase in involution and weaker ornamentation. Results herein show a possible mechanism that would lead to these changes, at least in the studied species.
I propose that during the evolution of M. densicostatus, there was an extension of the Perlatum stage, reaching up to 36 mm in diameter (Figure 9.5, 9.7), in comparison to M. seymourianus, in which the Perlatum stage finalizes at around 26 mm in diameter. The extension of the Perlatum stage in M. densicostatus coincides with an increase in compression and involution (Figure 9.4-6). It is also important to note that adults of M. densicostatus tend to be similar to juveniles and sub-adults of M. seymourianus, suggesting a sized-based heterochronic shift, presumably paedomorphosis, during the evolution of the group. This phenomenon has been documented several times in ammonoids and seems to have been an important evolutionary mechanism for the rapid diversification of the clade (Alberch et al., 1979; Yacobucci, 1999, 2015).
The driving force leading to this change is still unknown. The pattern displayed by these species follows the first Buckman´s rule of covariation (Westermann, 1966) which states that “the more evolute an ammonoid shell is, the more depressed and the more ornamented it is”, which has been attributed to adaptive and environmental constraints, as well as to constructional and developmental constraints (see Monnet et al. 2015 for review). Nonetheless, a possible explanation can be raised based on the ontogenetic trajectory illustrated in Figure 9.8. This figure shows that the area (TAE), and hence the relative space inside a section of the whorl, is much larger at later stages for M. seymourianus than for M. densicostatus. A compressed involute conch with a smooth shell surface is usually related to very hydrodynamically streamlined forms (Naglik et al., 2015; Ritterbush and Bottjer, 2012; Westermann, 1996) and so, here I propose a trade-off between the conch hydrodynamic properties and body size (which may provide more space for reproductive structures). This hypothesis has been previously stated by several authors (e.g., Ritterbush and Bottjer, 2012), and results from Tendler et al. (2015) seem to support it.
Modeling the ammonoid conch
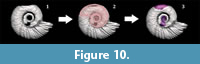 The results of this work show that the conch of the studied species can be modeled with accuracy, and the data obtained can be used to postulate informative traits for phylogenetic analyses (see Cecca et al., 2016). Another possible application is the reconstruction of 3D models, useful for other studies or to create virtual representations of the organism. Additionally, with the combination of mathematical models such as the one proposed by Erlich et al. (2016) and the extracted morphometric parameters, we can reconstruct a poorly preserved shell, which can be helpful if a complete sample is needed for experimentation or exhibition (Figure 10).
CONCLUSIONS
- In M. densicostatus and M. seymourianus, the aperture height, whorl height, whorl width and umbilical width are shell parameters that show low intraspecific variation. These parameters are correlated and can be considered continuous characters that can be easily modeled.
- In both species, the conch width index, whorl width index, umbilical width index and whorl expansion rate display a high intraspecific variation. In these parameters I observed two independent stages in the ontogenetic trajectories: a rapid morphologic transitional stage referred to herein as the Perlatum stage, followed by a continuous stage in conch morphology designated here as the Gibbosum stage (following Cecca et al., 2016). A third stage related to adulthood can be proposed based on a shift in ornamentation and morphology for both species.
- M. seymourianus and M. densicostatus share similar ontogenetic trajectories until a size of 26 mm in diameter, at which point the Perlatum stage in M. seymourianus finalizes and its morphology stabilizes. The Perlatum stage in M. densicostatus however continues up to 35 mm in diameter, coinciding with an increase in involution and whorl compression. Later, adults of this species tend to share a similar morphology to juveniles and sub-adults of M. seymourianus. This phenomenon suggests a size-based heterochronic shift, showing a paedomorphic evolutionary displacement.
ACKNOWLEDGMENTS
M. Tanús (Universidad de Buenos Aires) and M.C. Rodríguez Amenábar (UBA and Instituto Antártico Argentino) are thanked for allow studying material under their care. M. Cichowolski (UBA) and A.Concheyro (UBA) are acknowledged for their invaluable support and access to important information. A.Caramés (UBA) is thanked for the use of her optical instruments. I specially thank to the doctors and technicians of the Clínica de la Sagrada Familia (Buenos Aires) for allowing me to perform the tomography in their facilities. I am very grateful to R. Lemanis, M. Yacobucci, and M.A.S. Quiroz who provided useful feedback on this manuscript. The critical suggestions of the anonymous reviewers greatly improve the quality of this manuscript, they are warmly thanked for that.
REFERENCES
Alberch, P., Gould, S.J., Oster, G.F., and Wake, D. B. 1979. Size and shape in ontogeny and phylogeny. Paleobiology, 5(3):296-317. https://doi.org/10.1017/S0094837300006588
Cecca, F., Rouget, I., and Bardin, J. 2016. Ontogenetic data analyzed as such in phylogenies. Systematic Biology, 66(1):23-37. https://doi.org/10.1093/sysbio/syw052
Cleveland, W.S. 1979. Robust locally weighted regression and smoothing scatterplots. Journal of the American Statistical Association, 74:829-836. https://doi.org/10.2307/2286407
Crame, J.A., Francis, J.E., Cantrill, D.J., and Pirrie, D. 2004. Maastrichtian stratigraphy of Antarctica. Cretaceous Research, 25(3):411-423. https://doi.org/10.1016/j.cretres.2004.02.002
Davis, G.R., and Elliott, J.C. 2006. Artefacts in X-ray microtomography of materials. Materials Science and Technology, 22:1011-1018. https://doi.org/10.1179/174328406X114117
Erlich, A., Moulton, D., Goriely, A., and Chirat, R. 2016. Morphomechanics and developmental constraints in the evolution of ammonite shell form: Morphomechanics and constraints in ammonites. Journal of Experimental Zoology Part B: Molecular and Development, 326(7):437-450. https://doi.org/10.1002/jez.b.22716
Francis, J.E., Bowman, V.C., and Riding, J.B. 2013. Late Cretaceous winter sea ice in Antarctica? Geology, 41(12):1227-1230. https://doi.org/10.1130/g34891.1
Hammer, O., Harper, D., and Ryan, P. 2001. PAST: Paleontological statistics software package for education and data analysis. Palaeontologia Electronica, 4.1.4:1-9.
https://palaeo-electronica.org/2001_1/past/issue1_01.htm
Hoffmann, R., Lemanis, R., Naglik, C., and Klug, C. 2015a. Ammonoid buoyancy, p. 613-648. In Klug, C., Korn, D., De Baets, K., Kruta, I., and Mapes, R.H. (eds.), Ammonoid Paleobiology: From Anatomy to Ecology. Springer Netherlands, Dordrecht. https://doi.org/10.1007/978-94-017-9630-9_16
Hoffmann, R., Lemanis, R.E., Falkenberg, J., Schneider, S., Wesendonk, H., and Zachow, S. 2018. Integrating 2D and 3D shell morphology to disentangle the palaeobiology of ammonoids: a virtual approach. Palaeontology, 61(1):89-104. https://doi.org/10.1111/pala.12328
Hoffmann, R., Reinhoff, D., and Lemanis, R. 2015b. Non-invasive imaging techniques combined with morphometry: A case study from Spirulina. Swiss Journal of Palaeontology, 134(2):207-216. https://doi.org/10.1007/s13358-015-0083-0
Hoffmann, R., Schultz, J., Schellhorn, R., Rybacki, E., Keupp, H., Gerden, S.R., Lemanis, R., and Zachow, S. 2014. Non-invasive imaging methods applied to neo-and paleontological cephalopod research. Biogeosciences, 11:2721-2739. https://doi.org/10.5194/bgd-10-18803-2013
Kilian, W., and Reboul, P. 1909. Les Céphalopodes Néocrétacées des Iles Seymour et Snow Hill. Wissenschaftliche Ergenbnisse der Schwedischen Sudpolar-Expedition 1901-1903, 3(6):1-75.
Klug, C., Riegraf, W., and Lehmann, J. 2012. Soft-part preservation in heteromorph ammonites from the Cenomanian-Turonian boundary event (OAE 2) in north-west Germany. Palaeontology, 55:1307-1331. https://doi.org/10.1111/j.1475-4983.2012.01196.x
Klug, C., Korn, D., Landman, N.H., Tanabe, K., De Baets, K., and Naglik, C. 2015. Describing ammonoid conchs, p. 3-24. In Klug, C., Korn, D., De Baets, K., Kruta, I., and Mapes, R.H. (eds.), Ammonoid Paleobiology: From Anatomy to Ecology. Springer Netherlands, Dordrecht. https://doi.org/10.1007/978-94-017-9630-9_1
Korn, D. 2010. A key for the description of Palaeozoic ammonoids. Fossil Record, 13:5-12. https://doi.org/10.1002/mmng.200900008
Lemanis, R., Korn, D., Zachow, S., Rybacki, E., and Hoffmann, R. 2016a. The evolution and development of cephalopod chambers and their shape. PLOS ONE, 11(3):e0151404. https://doi.org/10.1371/journal.pone.0151404
Lemanis, R., Zachow, S., Fusseis, F., and Hoffmann, R. 2015. A new approach using high-resolution computed tomography to test the buoyant properties of chambered cephalopod shells. Paleobiology, 41(2):313-329. https://doi.org/10.1017/pab.2014.17
Lemanis, R., Zachow, S., and Hoffmann, R. 2016b. Comparative cephalopod shell strength and the role of septum morphology on stress distribution. PeerJ, 4:e2434. https://doi.org/10.7717/peerj.2434
Macellari, C. E. 1986. Late Campanian-Maastrichtian ammonite fauna from Seymour Island (Antarctic Peninsula). Journal of Paleontology, 60(S18):1-55. https://doi.org/10.1017/S0022336000060765
Macellari, C. E. 1988. Late Cretaceous Kossmaticeratidae (Ammonoidea) from the Magallanes Basin, Chile. Journal of Paleontology, 62(6):889-905. https://doi.org/10.1017/S002233600003016X
Marshall, P. 1928. The Upper Cretaceous ammonites of New Zealand. Transactions of the New Zealand Institute, 56:129-210, plates xix-xlvii. Issued separately, 1926. Geological Magazine, 65(9):419-419.
Monnet, C., De Baets, K., and Yacobucci, M.M. 2015. Buckman’s rules of covariation, p. 67-94. In Klug, C., Korn, D., De Baets, K., Kruta, I., and Mapes, R.H. (eds.), Ammonoid Paleobiology: From Macroevolution to Paleogeography. Springer Netherlands, Dordrecht. https://doi.org/10.1007/978-94-017-9633-0_4
Naglik, C., Rikhtegar, F., and Klug, C. 2015. Buoyancy of some Palaeozoic ammonoids and their hydrostatic properties based on empirical 3D-models. Lethaia, 49(1):3-12. https://doi.org/10.1111/let.12125
Olivero, E.B. 2012. Sedimentary cycles, ammonite diversity and palaeoenvironmental changes in the Upper Cretaceous Marambio Group, Antarctica. Cretaceous Research, 34:348-366. https://doi.org/10.1016/j.cretres.2011.11.015
Olivero, E.B., Ponce, J.J., and Martinioni, D.R. 2008. Sedimentology and architecture of sharp-based tidal sandstones in the upper Marambio Group, Maastrichtian of Antarctica. Sedimentary Geology, 210(1):11-26. https://doi.org/10.1016/j.sedgeo.2008.07.003
Pinter, C., Lasso, A., and Fichtinger, G. 2016. Dynamic management of segmented structures in 3D Slicer, Laboratory for Percutaneous Surgery, School of Computing, Queen’s University, Kingston, ON, Canada. 3D Slicer tutorials. https://slideplayer.com/slide/13007331/
Pirrie, D., Crame, J.A., Lomas, S., and Riding, J. 1997. Late Cretaceous stratigraphy of the Admiralty Sound region, James Ross Basin, Antarctica. Cretaceous Research, 18:109-137. https://doi.org/10.1006/cres.1996.0052
Riccardi, A. 1983. Kossmaticeratidae (Ammonitina) y nomenclatura estratigráfica del Cretácico tardío en Lago Argentino, Santa Cruz, Argentina. Ameghiniana, 20:317-345. http://www.ameghiniana.org.ar/index.php/ameghiniana/article/view/1780
Ritterbush, K., and Bottjer, D. 2012. Westermann Morphospace displays ammonoid shell shape and hypothetical paleoecology. Paleobiology, 38(3):424-446. https://doi.org/10.1666/10027.1
Sutton, M., Rahman, I., and Garwood, R. 2014. Techniques for Virtual Palaeontology. Wiley-Blackwell, Chichester. https://doi.org/10.1002/9781118591192
Tajika, A., Naglik, C., Morimoto, N., Pascual-Cebrian, E., Hennhöfer, D., and Klug, C. 2015. Empirical 3D model of the conch of the Middle Jurassic ammonite microconch Normannites: Its buoyancy, the physical effects of its mature modifications and speculations on their function. Historical Biology, 27(2):181-191. https://doi.org/10.1080/08912963.2013.872097
Takeda, Y., Tanabe, K., Sasaki, T., Uesugi, K., and Hoshino, M. 2016. Non-destructive analysis of in situ ammonoid jaws by synchrotron radiation X-ray micro-computed tomography. Palaeontologia Electronica, 19.3.46A:1-13. https://doi.org/10.26879/697
Tendler, A., Mayo, A., and Alon, U. 2015. Evolutionary tradeoffs, Pareto optimality and the morphology of ammonite shells. BMC Systems Biology, 9(1):12. https://doi.org/10.1186/s12918-015-0149-z
Vezhnevets, V., and Konouchine, V. 2005. “GrowCut ”-Interactive Multi-Label ND image segmentation by cellular automata. Graphicon. Moscow State University, Moscow, Russia. http://graphics.cs.msu.ru/en/publications/text/gc2005vk.pdf
Vidal, F.P., Létang, J.M., Peix, G. and Cloetens, P. 2005. Investigation of artefact sources in synchrotron microtomography via virtual X-ray imaging. Nuclear Instruments and Methods in Physics Research Section B: Beam Interactions with Materials and Atoms, 234:333-348. https://doi.org/10.1016/j.nimb.2005.02.003
Westermann, G. E. G. 1966. Covariation and taxonomy of the Jurassic ammonite Sonninia adicra (Waagen). Neues Jahrbuch für Geologie und Paläontologie, 124:289-312.
Westermann, G.E.G. 1996. Ammonoid life and habitat, p. 607-707. In Landman, N.H., Tanabe, K., and Davis, R.A. (eds.), Ammonoid Paleobiology. Springer, Boston. https://doi.org/10.1007/978-1-4757-9153-2_16
Witts, J.D., Bowman, V.C., Wignall, P.B., Alistair Crame, J., Francis, J.E., and Newton, R.J. 2015. Evolution and extinction of Maastrichtian (Late Cretaceous) cephalopods from the López de Bertodano Formation, Seymour Island, Antarctica. Palaeogeography, Palaeoclimatology, Palaeoecology, 418:193-212. https://doi.org/10.1016/j.palaeo.2014.11.002
Yacobucci, M.M. 1999. Plasticity of developmental timing as the underlying cause of high speciation rates in ammonoids, p. 59-76. In Olóriz, F., and Rodríguez-Tovar, F.J. (eds.), Advancing Research on Living and Fossil Cephalopods. Springer Science+Business Media, New York. https://doi.org/10.1007/978-1-4615-4837-9_6
Yacobucci, M. M. 2015. Macroevolution and paleobiogeography of Jurassic-Cretaceous ammonoids, p. 189-228. In Klug, C., Korn, D., De Baets, K., Kruta, I., and Mapes, R.H. (eds.), Ammonoid Paleobiology: From Macroevolution to Paleogeography. Springer Netherlands, Dordrecht. https://doi.org/10.1007/978-94-017-9633-0_8
Young, R.E., and Harman, R.F. 1988. 'Larva', 'paralarva' and 'subadult' in cephalopod terminology. Malacologia, 29:201-207.
