

 The intriguing shapes of the ammonoid whorl
Article number: 26.1.a14
https://doi.org/10.26879/1263
Copyright Palaeontological Association, April 2023
Author biographies
Plain-language and multi-lingual abstracts
PDF version
Submission: 26 December 2022. Acceptance: 7 April 2023.
ABSTRACT
Here we study the variation of the Paleozoic to Mesozoic ammonoid whorl profile shape (WPS, in previous contributions referred as the whorl cross-section shape) employing a geometric morphometric approach, virtual modelling, and statistical tools to assess possible biological phenomena. For this approach, a dataset covering 300 individuals (each belonging to a different genus) was generated from revised specimens and published literature data. From this dataset, we proposed several predictors (e.g., several size parameters) that could be applied in linear models using the principal components (resulting from the geometric morphometric analyses) as response variables. The whorl profile area from the specimens was calculated from virtual models of their original whorls. The results show that the variation in the whorl profile in this sample is resumed by 10 principal components, of which the first three cover 87% of the total variation. PC1 (54.5%) illustrates transformations mainly from the degree of compression and, to a lesser extent, the degree of whorl overlap. Furthermore, the statistical results indicate a significant association between PC1 with several ammonoid subtaxa and whorl size. A correlation between PC1 and the whorl area is also recognised. PC2 (24.8%) reflects morphological transformations that emulates stretching and compression of the whorl profile shape; it is likely related to the hydrodynamic performance of the resulting conch morphology. PC3 (7.4%) encompasses changes on the shape of the venter (from flat to rounded), and the curvature of the flanks, and it seems to be related to minor modifications required to achieve some extreme shapes.
Daniel A. Morón-Alfonso. Universidad de Buenos Aires, Facultad de Ciencias Exactas y Naturales, Departamento de Ciencias Geológicas, Área de Paleontología, Ciudad Universitaria, Pab. 2, C1428EGA, Buenos Aires, Argentina. CONICET-Universidad de Buenos Aires, Instituto de Estudios Andinos “Don Pablo Groeber” (IDEAN), Buenos Aires, Argentina. paleokarzis@gmail.com
Marcela Cichowolski. Universidad de Buenos Aires, Facultad de Ciencias Exactas y Naturales, Departamento de Ciencias Geológicas, Área de Paleontología, Ciudad Universitaria, Pab. 2, C1428EGA, Buenos Aires, Argentina. CONICET-Universidad de Buenos Aires, Instituto de Estudios Andinos “Don Pablo Groeber” (IDEAN), Buenos Aires, Argentina. mcicho@gl.fcen.uba.ar
René Hoffmann. Institute of Geology, Mineralogy, & Geophysics, Ruhr-Universität Bochum, 44801 Bochum, Germany. Rene.Hoffmann@rub.de
Dieter Korn. Museum für Naturkunde, Leibniz-Institut für Evolutions-und Biodiversitätsforschung, Invalidenstraße 43, 10115 Berlin, Germany. dieter.korn@mfn.berlin
Verónica V. Vennari. Instituto de Evolución, Ecología Histórica y Ambiente (IDEVEA), Universidad Tecnológica Nacional, Facultad Regional San Rafael (UTN-FRSR). Gral. J.J. Urquiza 314, M5602GCH, San Rafael, Mendoza, Argentina. vvennari@mendoza-conicet.gob.ar
Ninon Allaire. Consejo Nacional de Investigaciones Científicas y Técnicas (CONICET), Centro de Investigaciones en Ciencias de la Tierra (CICTERRA), Córdoba, Argentina. ninon.allaire@gmail.com
Keywords: Cephalopoda; Ammonoid; geometric morphometrics; whorl profile; whorl section; area
Final citation: Morón-Alfonso, Daniel A., Cichowolski, Marcela, Hoffmann, René, Korn, Dieter, Vennari, Verónica V., and Allaire, Ninon. 2023. The intriguing shapes of the ammonoid whorl. Palaeontologia Electronica, 26(1):a14.
https://doi.org/10.26879/1263
palaeo-electronica.org/content/2023/3825-shapes-of-the-ammonoid-whorl
Copyright: April 2023 Society of Vertebrate Paleontology.
This is an open access article distributed under the terms of the Creative Commons Attribution License, which permits unrestricted use, distribution, and reproduction in any medium, provided the original author and source are credited.
creativecommons.org/licenses/by/4.0
INTRODUCTION
The considerable variation of the external conch morphology in ammonoids is a longstanding subject of discussion (e.g., Saunders and Swan, 1984; Leonova, 2002; Korn and Klug, 2012; De Baets et al., 2013; Klug et al., 2015b), not only involving the key aspects of the classification of the group but also as the source of many macroevolutionary hypotheses (Monnet et al., 2015a). Concerning the latter, the recurrent morphologies suggesting several cases of convergence within ammonoid lineages have encouraged the proposition of many physical and/or morphogenetic constraints (Ubukata et al., 2008; Monnet et al., 2011; Ritterbush and Bottjer, 2012; Brosse et al., 2013; Monnet et al., 2015a; Erlich et al., 2016). Understanding these limitations is crucial, not only to assess the evolutionary history of the group, but also to identify the recurring factors involved in such morphological changes (e.g., the expected response to environmental stress such as sea level or temperature variations; Bayer and McGhee 1984; Korn, 1995; Bucher et al., 1996; De Baets et al., 2015). Fossils of ammonoids are abundant and nearly globally distributed; they range from the Early Devonian to the Cretaceous-Paleogene boundary, with some taxa surviving into the earliest Palaeocene (=Danian; Machalski and Heinberg, 2005; Landman et al., 2012). Accordingly, understanding the drivers leading the morphological variability in this group is useful to assess the palaeoenvironmental changes across different basins over long periods. However, the conch morphology can be difficult to evaluate, as it is usually studied using morphometric parameters that exhibit complex logarithmic allometric variations through the conch ontogeny. This is particularly true for lower taxonomic levels (i.e., genus, species), and sometimes higher levels, as the variation of these parameters can be very small at these levels, and other characters such as the sutural/septal and siphuncular features that characterise superior hierarchies cannot be employed (Allen, 2007; Korn, 2010; Klug and Hoffmann, 2015; Wegerer et al., 2018). Moreover, many other attributes of the ammonoid conch are not discrete or even codependent, sometimes varying slightly between species (e.g., the density of the ribbing pattern), and hence their definition for cladistic analyses is problematic (Yacobucci, 2004; Bardin et al., 2014; Moulton et al., 2015).
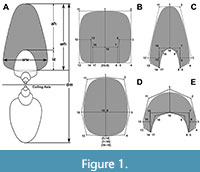 One of these complex continuous features is the shape of the whorl in a transversal cross-section of the conch, to which we will refer as the whorl profile (WP, Figure 1). The ammonoid conch morphology can be understood as a by-product of the variation of the whorl profile shape (WPS) through the growth phase of the organism following commonly (but not uniquely) a continuous spiral arrangement (Chirat et al., 2021; Hoffmann et al., 2021). The shape variation of the WP is strongly linked to the processes of shell generation, and therefore, it is susceptible to register valuable data of the producer (Erlich et al., 2016, fig. 1). The ammonoid WPS is usually studied using morphometric parameters (and derived indices and rates, Figure 1A) and often presented as ontogenetic trajectory plots (Okamoto, 1996; Korn, 2010; Korn and Klug, 2012; Knauss and Yacobucci, 2014; Klug et al., 2015b). However, despite their effective use as descriptive and diagnostic tools, these morphometric parameters have intricate interactions between each other and the overall size of the conch, so it is difficult to differentiate morphological variations caused by independent factors. In this regard, changes in the WPS can be caused by a response to changes in lifestyle but might be resumed by the variations of the same parameters (Monnet et al., 2011; Brosse et al., 2013). For example, during growth there could be an increase in the compression of the conch, but there might be additional changes related to the curvature of the flanks that can be overlooked using linear measurements (Figure 1). An alternative approach using geometrics morphometrics (GM) has been employed to address this issue in biologic studies (Klingenberg, 2016, 2020). As stated by Klingenberg (2016, p. 119): “The key advance of geometric morphometrics by comparison to earlier approaches is that it uses the complete information about a configuration of landmarks: not just a selected set of distances, but all aspects of the relative arrangement of the landmarks and all the interrelations among them”. Therefore, the shape is formally defined as all the geometric features of a given landmark configuration including proportions, angles, and the relative arrangement of parts, independently from the size, position, and orientation. Formerly, GM has been employed before to study effectively the conch morphology in ammonoids and other cephalopods (Neige, 1999; Simon et al., 2010; 2011; Monnet et al., 2011; Korn and Klug, 2012; Klein and Korn, 2014; Courville and Crônier, 2016; Gerber, 2017; Bischof et al., 2021; Nätscher et al., 2021). More recently, a new methodology combining virtual modelling and GM presented by Morón-Alfonso et al. (2021) allowed translating the WP to a configuration of semi-landmarks including uncoiled taxa. The obtained results provided a general overview of the morphospace of the ammonoid WPS, and of possible mechanisms explaining the constraints involved. Herein, we advance in this research, by exploring more deeply the obtained morphospace including 300 representatives of distinct genera, and by applying statistical tools to assess possible biological phenomena.
MATERIALS AND METHODS
Data Frame
For the construction of the data frame, a list of ammonoid genera across the Phanerozoic was downloaded from the Paleobiology Database (PBDB). At the starting date of this project (January 2021) we found 3307 genera recorded in the PBDB including their respective references and possible synonyms (Appendix 1). These genera were numbered, and an algorithm was used to generate a random selection without duplicates. For each genus, a specimen with a clean apertural view or a transversal cross-section was searched for, either at the available repositories or published in the literature (Appendix 2). Additional information for the statistical analyses was recorded when available. Finally, based on the resolution and format type, a quality value going from one (excellent, with a resolution of at least 300 dpi) to three (acceptable, with a resolution between 150 and 300 dpi) was qualitatively assigned to the images of the selected specimens. This quality scale might be useful to help authors to decide if the data presented here can be improved for review papers or include specimens showing better preservation in the future. In some instances, only schematic representations depicted by the original authors were available, for these cases, a quality value of two was determined indicating the implicit subjective interpretation. Accordingly, the data frame generated in this work is dynamic and apt to be updated as new information is included.
The original ammonoid database was sampled until fulfilling the goal of retrieving data for a target of 300 genera. During this process, more than 700 genera were reviewed and 43% of these had the required data and data quality for this study. Images of the WPs extracted from subadult phragmocones in both apertural views and conch transversal cross-sections were collected. WPs from subadult phragmocones are ideal for these analyses; they seem to exhibit reasonable morphological stability before the possible adult modifications suffered during adulthood both by the phragmocone and the body chamber (Klug et al., 2015a). These images consisted of high-resolution photographs, tomographic datasets, and schematic diagrams of the selected genera. We compiled data provided from the following repositories: Colección de Paleontología de la Universidad de Buenos Aires (CPBA, Argentina), Colección de Paleoinvertebrados del Instituto Antártico Argentino (IAA-pi, Argentina), Colección de Paleontología del Museo José Royo y Gómez (RGM, Colombia), Ruhr-Universität Bochum Repository (RUB-Pal, Germany), The Digital Atlas of Ancient Life (virtual Repository, Hendricks et al., 2015), Muséum National d’Histoire Naturelle (MNHN virtual Repository, France), GB3D Type Fossils Online (virtual repository of the Oxford University Museum of Natural History, UK), and the Natural History Museum Dataset (2014, virtual repository, UK). Data also include figures from 178 works regarding ammonoids, source materials are cited here and a list is provided in Appendix 1.
Geometric Morphometrics
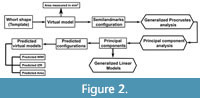 The geometric morphometric methodology used here was described by Morón-Alfonso et al. (2021). It employs a basic landmark configuration derived from the morphometric parameters that is translated from virtual models of the selected samples using a subdivision surface algorithm (Figure 1). These models (and their corresponding semilandmark configurations) are analysed employing a geometric morphometric approach, which consists of a Generalised Procrustes Analysis (GPA), followed by a Principal Component Analysis (PCA, Figure 2). The resulting principal components (PCs) summarise the transformations between different WPSs; the obtained morphospace is used to visualise the variation found in the original sample (Figure 2). Posteriorly, these PCs can be analysed using Generalised Linear Models against distinct variables to identify different trends and relationships. The virtual models were constructed using Blender 3.0.1 (Blender Online Community, 2022). In this case, a basic 18-semilandmark configuration was used as a template (Figure 1). The GPA and the PCA were performed using Morpho 2.9 (Schlager, 2020) and Geomorph 4.0.1 (Adams et al., 2021) R Packages. Back-transform morphospaces were constructed using the morphospace package (Carmona, 2022). Both analyses and their results can be inspected from an interactive file in Appendix 2.
Statistical Analyses
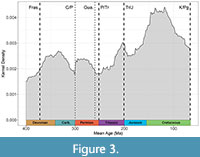 A data validation test was performed to check if the sample was representative of the known ammonoid diversity across the Phanerozoic. For this, a Kernel density curve for the selected genera and the mean age was computed using the R package ggplot2 (Wickham, 2009; Figure 3). The mean age was calculated from the first and the last record appearance of the species; if not available, it was calculated from a known available time interval estimated for the taxon. Further, this diversity curve was compared to diversity curves obtained from the literature to check possible discrepancies (Sepkoski, 1996; Bambach et al., 2004; Figure 3). Once the data was validated, several Generalised Linear Models (GLMs) were proposed. GLMs encompass regression models in which a dependent (response) variable is expressed as a linear function of designed predictors (independent or explanatory variables). As follows, the PCs obtained from the PCA were established as the dependent variables and several possible factors were proposed as independent variables.
The first variable proposed to explain the WP variation is the body size, which appears to have increased through the ammonoid evolutionary history. In extant cephalopods, the size of the organism is usually registered as the length of the mantle. As this measurement cannot be obtained from fossils, the conch diameter is usually used instead as a proxy value (Figure 1). However, the diameter cannot be employed in non-spiral taxa, so another variable must be used instead to evaluate the WPs. In such cases, the centroid size, defined as the square root of the sum of squared distances of all the semi-landmarks from their centroid (obtained by averaging the x and y coordinates of all the landmarks), can be employed as a size variable (Klingenberg, 2016). The centroid size is widely used in GM as a scale factor, but to be useful for this purpose, all the virtual models (and in consequence the semilandmark configurations) had to be scaled to their real size values in mm. Furthermore, WPs tend to grow following a near logarithmic function due to the spiral geometry of the conch (Bucher et al., 1996). Consequently, the logarithm of the centroid size was used in the statistical analyses.
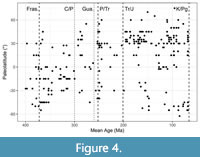 The second selected predictor was the palaeolatitude of the original locality for each specimen (PLAT), which was approximated by subdividing an updated palaeogeographic map (for different periods) in a 2.5° latitude grid and tracking down the position of the locality through time (Scotese, 2014; Scotese and Wright, 2018). This was done using Icy 2.4.0.0 (de Chaumont et al., 2012) for the image processing, and Google Earth Pro 7.3.4.8 for building the dynamic maps. PLAT was employed to explore the spatial distribution of the selected taxa through time, and their relation to the WPS (Figure 4).
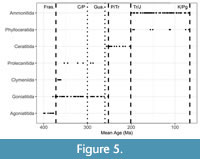 Statistical exploration of the data showed a relationship between the PCs and several subtaxa within the Ammonoida. The occurrence of these subtaxa is consistent with the history of the group influenced by bottlenecks caused by extinction events (Figure 3, Figure 4, Figure 5). As previously mentioned, most of these subtaxa are considered natural groups typified by changes in the septal/sutural structures and the siphuncle (Wright et al., 1996; Leonova, 2002; Korn et al., 2003; Korn and Klug, 2012; Klug and Hoffmann, 2015; Monnet et al., 2015c). Dependence between these subtaxa and time implies a case of multicollinearity in which a factor is correlated with a continuous variable (i.e., Mean Age, Figure 5); this can be tested by calculating a Generalised Variance Inflation Factor (GVIF, Appendix 3).
 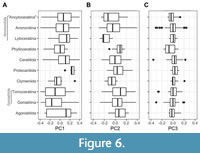 Multicollinearity between explanatory variables can lead to wider confidence intervals producing less reliable results in a linear model. Considering all these circumstances, it was concluded that these subtaxa were required to adjust to a statistical distribution and were considered as the effect of the phylogeny in the statistical analyzes. As follows, 10 subtaxa were selected to represent these subpopulations at the order level within Ammonoida. The most diverse orders, Ammonitida and Goniatitida, were further subdivided in their respective suborders to provide a more exact evaluation of these groups (Hoffmann et al., 2022). We also decided to include the current informal group “Ancyloceratina” which encompasses the uncoiled forms (Hoffmann et al., 2022; Figure 6). Once all the variables were defined, several GLMs were tested by employing the backwards elimination technique (Wang et al., 2007). A summary of this procedure can be found in Appendix 3.
Measurements
Additional measurements were taken from the scaled virtual models of the specimens. The surface area in mm2 was measured using an Add-on included in the modelling software (3D Printing Toolbox Addon in Blender 3.0.1, Appendix 1).
Measurements were also taken from the predicted WPs obtained from the PCA to evaluate the parametric changes caused by the variation of the PCs. A valuable remark is that during the GPA, all the models were rescaled to the same unit (to subtract the size). Therefore, the predicted area, the predicted imprint zone rate (i.e., the relation between the imprint zone and the whorl height, Figure 1), and the predicted whorl width index (i.e., the relation between the whorl width and whorl height, Figure 1) are dimensionless.
RESULTS
Geometric Morphometric Results
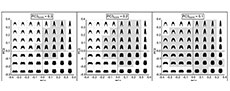
 The PCA results show that the first two PCs, respectively, summarise 54.5% and 24.8% of the total variance in the sample (i.e., together around 80%, Table 1). The third PC only explains 7.3% of the total variance (Figure 6, Figure 7, Figure 8, Figure 9, Figure 10). Details of this procedure are provided in Appendix 2, and an interactive 3D plot showing the subtaxa is provided in Appendix 3. Two dimensional representations of the morphospace are discussed below.
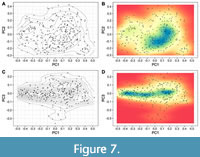
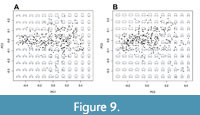
The PC1/PC2 scatter plot shows a heterogeneous distribution of the specimens with an increase in density reaching the highest values around the intervals PC1score = [-0.1; 0.2] and PC2score = [-0.2; 0.01] from where the density decreases towards the margin of the occupied morphospace (Figure 7A-B). Further, additional regions of aggregation can be observed around the intervals PC1score = [-0.5; -0.2] and PC2score = [-0.1; 0.2], and the intervals PC1score = [0.3; 0.5] and PC2score = [-0.1; -0.2] (Figure 7A-B).
In the PC1/PC3 scatter plot, the density plot shows the most populated regions around the interval PC3score = [-0.1; 0.1], with a limited number of specimens showing extreme score values (Figure 7C-D). At least two regions reaching the highest densities can be differentiated following PC1 around the intervals PC1score = [0.0; -0.5] and PC1score = [0.1; 0.3] (Figure 7C-D).
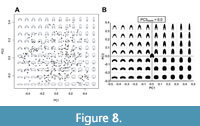 However, the most important result is the distribution pattern of the WP morphologies in the PC1/PC2 diagram (Figure 8). It should be considered that essentially three morphological characters can be depicted in this diagram:
(1) The whorl width / whorl height ratio (whorl width index: WWI).
(2) The rate of encompassment of the preceding whorl (the degree of whorl overlap), measured by the imprint zone (imprint zone rate: IZR, here going from zero, meaning no overlap, to positive values with increasing whorl overlap).
(3) The general outline of the WP, such as the shape of the venter (e.g., acute, convex, flat, or concave), the ventrolateral shoulder (rounded or angular), the flanks (convergent, parallel, or divergent) and the umbilical margin (rounded or angular).
 Among these three characters, the first two can easily be recognised in their different expressions in the PC1/PC2 diagram (Figure 8), because they have easily ascertainable quantitative properties. Both parameters, WWI and IZR, are represented in both PC1 and PC2: a rising WWI is reflected in decreasing PC1 and decreasing PC2 values; a rising IZR is represented by a decreasing PC1 and an increasing PC2 value. This means that ammonoids with stout involute conchs plot at the top-left area of the morphospace, ammonoids with slender involute conchs occupy the top-right corner, ammonoids with stout evolute conchs occupy the bottom-left corner and ammonoids with slender evolute conchs occupy the bottom-right corner (Figure 8, Figure 9, Figure 10). The consensus or “average” shape (moderately stout, moderately umbilicate, moderate overlapping degree) is illustrated in the centre of the morphospace (Figure 8).
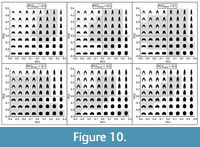 Variations in the whorl shape involving the curvature of the flanks and the venter are summarised by PC3 (Figure 9-Figure 10). Ammonoids with convergent flanks and concave or flat venter show high PC3 scores, while specimens with strongly convex flanks and narrowly rounded or acute venter show lower PC3 scores values (Figure 10).
Statistical Results for PC1
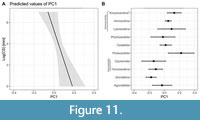 Results of the statistical model for PC1 show a relationship between this principal component, the centroid size, and the subtaxa selected (Model 1 in Table 2, Appendix 3). It is important to note that these two predictors do not show interaction between each other (i.e., simple additive model, Appendix 3). The palaeolatitude and the diameter are not significant factors (Model 2 in Table 2); the mean age was not considered due to the unusual case of multicollinearity (Appendix 3). To summarise, we can observe that for each unit of the logarithm of the centroid size, the PC1 score decreases in average between 0.001 to 0.07 with 95% confidence (independently of the subtaxa, Figure 11, Table 1). Therefore, changing the whorl size causes a modest but statistically significant change in the WP morphology (Figure 11A). Furthermore, predicted values of PC1 for the subtaxa exhibit significant differences among each other (comparing at the same sizes). The disparity between the subtaxa is more noticeable when Paleozoic and Mesozoic taxa are compared (Figure 11B). Lastly, PC2 and PC3 do not follow a particular statistical distribution, probably suggesting a multimodal effect, which hints of the presence of subpopulations not accounted for in this study. As follows, we were unable to propose a statistical model that could be applied to these principal components.
Statistical Results for the Measured Area
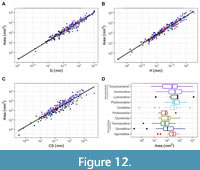 Three statistical models were proposed to study the measured area from the specimens (mm2), each using a different size proxy for ammonoids (i.e., the diameter, the whorl height, and the centroid size; Table 3, Appendix 4). In general, there is a direct exponential relationship between all these parameters and the measured area as expected from an increase in size (Table 3). The data involving the centroid size show the highest dispersion of the three size predictors, and the subtaxa have a significant effect. The model employing the centroid size predicts that increasing a unit of the logarithm of this variable implies an increase in the area between 5.47 to 6.35 mm2 in average with a 95% of confidence (Model 3 in Table 3). The subtaxa were not a significant factor for the linear models including both the diameter and the whorl size (Models 4 and 5, respectively, in Table 3). The results show that increasing the logarithm of the diameter implies an area increment ranging between 6.21 to 6.93 mm2 in average with 95% confidence (Figure 12, Table 3). For the logarithm of the whorl height the area increment ranges between 6.18-6.82 mm2 in average with 95% confidence (Figure 12, Table 3).
Morphometric Parameters of the Predicted Whorl Profiles
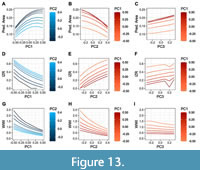 Analyses of the predicted WP morphologies obtained from the principal components, highlight some of the possible interactions observed in ammonoids (Appendix 5). On this matter, the predicted area is an important factor linked to PC1. In this case (and following the polarity used in this work), increasing the PC1 score implies an expansion of the predicted area until reaching a local optimum around the interval PC1scores = [0.1; 0.2] at which point the predicted area begins to decrease (Figure 13A). Interestingly, this interval corresponds to the most densely occupied part of the morphospace (Figure 7). Contrary to PC1, increasing the PC2 score leads to a reduction of the predicted area following a negative exponential curve (Figure 13B). Lastly, increasing the PC3 score shows a moderate linear effect with respect to the predicted area (Figure 13C).
Regarding the variation of the predicted whorl width index (WWI), increasing the scores of both PC1 and PC2 imply an increase in the whorl compression (Figure 13 G-I). Furthermore, there is no relevant effect for PC3 at low PC1 values, but this becomes significant at high PC1 values showing an additional increase in whorl compression (Figure 13I). As follows, high values of the first three principal components correspond to the most compressed WPs (Figure 10).
The predicted IZR has a negative logarithmic relationship with PC1, and a positive relationship with PC2 (Figure 13D-F). It also shows an irregular variation for PC3 caused by the deformation of the ventral and dorsal regions of the predicted WPs at high PC3 scores (Figure 13F).
DISCUSSION
The Whorl Profile Morphospace
Results of this work are congruent with previous morphological trends observed on the ammonoid WP and the general conch morphology showing close similarities to other morphospaces (Saunders et al., 2004; Korn and Klug, 2012; McGhee, 2012; Ritterbush and Bottjer, 2012; Tendler et al., 2015; Gerber, 2017). In this regard, the rates of variance and the transformations obtained for the principal components agreed with previous results (Morón-Alfonso et al., 2021) indicating that most of the WP variation is summarised by the first three principal components (around 87%). Here we provide a more extensive depiction of this morphospace showing representations of the predicted morphologies and their possible variations (Figure 8, Figure 9, Figure 10).
The results indicate that there is a complex interaction between the transformations summarised by each PC, in some cases acting as drivers to a particular WPS (e.g., a high score for PC1, PC2, and PC3 results in a very compressed WP with a high imprint zone), and in others buffering their effect (e.g., a high score for PC1, but low scores for PC2 and PC3 indicates a moderately compressed WP with a reduced imprint zone). Therefore, the combinations of these principal components resume the complex interactions between the whorl parameters (WWI and IZR; Figure 13). Nonetheless, despite the similar transformations resumed by these principal components, some clear differences can be noted. In this respect, PC1 seems to be closely related to changes in the relative whorl area, a pattern that can be observed on both the density plots and the predicted whorl morphologies (Figure 7, Figure 13). Note, the data aggregation around the interval PC1score = [0.1; 0.2] coincides with the optimal predicted area measured from the predicted WPs.
Contrary to PC1, increasing the PC2 score restricts the expansion of the predicted area (Figure 13A). Note that the PC2 transformations emulate the stretch of the whorl following the vertical axis (e.g., like an elastic cylinder when a force is applied along its axis, Figure 8, Figure 10), in consequence, there is an increase in whorl compression at the cost of the available area (Figure 13B). Another interesting observation is that an increase of the PC3 score leads to an expansion of the predicted area as well (Figure 13C). A high score value for the first three principal components implies a very compressed WPS with a reduced imprint zone (e.g., Figure 10, PC3score =0.3). Hence, having a high PC3 value might mitigate the net loss of the available area caused by the combined effect of high scores for PC1 and PC2, a pattern that is also observed in the scatter plots (Figure 7B, Figure 13C).
A valuable issue comes out of examining the predicted WPs at extreme score values in the morphospace, to understand why some of these morphologies are rarely or never exhibited by ammonoids. The first possible reason is related to a sampling bias. Ammonoids might have explored such morphologies but those are not represented in the dataset due to the low representation of some taxa (either from the original sample pool or as a result of their scarce fossil record). Furthermore, for high PC1 scores (i.e., higher than 0.3) there seems to be a constraint related to the relative whorl area (Figure 13A), showing that ammonoids rarely occupy the morphospace beyond this value (Figure 7A). This suggests that the WPS tends towards an optimal relative area, and in consequence, it will likely be a common cause of convergence in this group. The highest PC1 scores are only attained under very low PC2 scores (implying a low degree of whorl overlap or no overlap at all, i.e., advolute conch; Figure 8) thus allowing to surpass the threshold around PC1score = 0.3 (Figure 7A). This observation suggests a possible explanation for WPs with reduced or nonexistent imprint zones, maximising the relative area available over other possible constraints to the WP, a phenomenon that has been inferred before by Saunders et al. (2008) and Tendler et al. (2015). Additionally, for a very low PC1 score (under -0.4) the relative area available might be insufficient to allocate the soft parts of the organisms (Figure 8B, Figure 10). The same possible explanation can be applied to very high (>0.4) or very low (<-0.3) PC2 scores, where the predicted WPs are very narrow, implying a limited habitable area (Figure 8B, Figure 10). For high PC2 scores, there seems to be an additional limitation related to the width and the extension of the flanks around the region involving the imprint zone. In general, wide flanks are exclusively observed on shortened WPs, and very narrow flanks are rarely observed (Figure 10). This might imply restrictions related to the mantle properties or the distribution of some soft parts of the organism.
In the case of PC3, the highest and lowest scores are only attained under specific circumstances. The former is reached in accordance with high scores for both PC1 and PC2 (Figure 9, Figure 10). In this case, at low PC1 and PC2 values of the morphospace, the WPs have an expanded flat venter implying a high drag coefficient (depending on Reynolds number) possibly hindering the hydrodynamic performance of the resulting conch morphology (e.g., Figure 10: PC3score = 0.3, PC1score = -0.2, and PC2score = -0.2; Jacobs, 1992; Naglik et al., 2015; Hebdon et al., 2020). The lower PC3 values are only reached around the interval PC1score = [0.0; 0.1]. The most probable explanation for this unoccupied region is related to the expansion rate. In this respect, at high PC1 scores, the imprint zones of the predicted WPs are laterally narrow but elongated, implying that the previous whorl would be very small, and therefore, it would require a very high expansion rate to reach the predicted WP (e.g., Figure 10: PC3score = -0.3, PC1score = 0.3, and PC2score = 0.1). The opposite pattern would be observed on low PC3 and PC1 scores, where the expansion rate should be very low to obtain the predicted WP (e.g., Figure 10: PC3score = -0.3, PC1score = - 0.2, and PC2score = -0.1).
Summarising these observations, it is inferred that the ammonoid WPS seems to be constrained by the relative available area, the size of the flanks compromising the imprint zone, the expansion rate, and the hydrodynamic performance of the resulting conch morphology. About the latter, given that the changes resumed by PC2 are closely associated with the exposure of the umbilicus and the compression degree (in all cases deterring the available area in favour of a compressed WS with long flanks hiding the umbilicus), it would be reasonable to infer that this principal component is linked to streamlining; a tendency of aquatic organisms to have compressed body shapes allowing to reduce the fluid resistance during movement (i.e., leading to low drag coefficient for the resulting conch morphology, Jacobs, 1992; Fish, 2009; Langerhans and Reznick, 2010; Naglik et al., 2015; Peterman et al., 2019; Hebdon et al., 2020; Peterman et al., 2020). PC3 seems to encompass additional modifications of the ventral region and the curvature of the flanks, probably allowing to reach some extreme WP morphologies at specific PC1 and PC2 scores (e.g., such as extremely compressed shapes, Figure 10).
Statistical Analyses
Statistical results for the model involving PC1 show that the centroid size and the considered subtaxa are significant factors to predict PC1. Noticeably, these predictors do not interact with each other (Figure 11, Table 2), suggesting a physical cause for the centroid size, as this pattern is observed across different taxa occurring at notable temporal gaps. However, despite being statistically significant, the effect size for the centroid size is small, showing just a slight decrease in the PC1 score towards higher sizes, therefore, this relationship might not be biologically noticeable (Table 2). In contrast, the selected subtaxa show a major effect in response to PC1, about an order of magnitude greater than the centroid size (Table 2). Following, the statistical model for PC1 involving the diameter (excluding the non-spiral forms), shows that this parameter is not statistically significant (i.e., near the threshold p -value), and possesses a small effect size (Table 2). These results contradict previous findings where the diameter was found to be a significant factor in the statistical models (using a smaller sample size n = 50, Morón-Alfonso et al., 2021), which might have been caused by a tendency of some subtaxa to reach greater sizes resulting in statistical interference (i.e., the overlap of two probability distributions). As a corollary, the results of these models indicate that the selected subtaxa are the most important factor to predict PC1, and hence that the evolutionary history (i.e., the phylogenetic effect) plays a major role in the WP variation. Regarding the subtaxa, it should be noted that despite representing the stated metapopulations (separated mainly by temporal gaps, and being required to propose the statistical models), there is an inherent lack of independence due to the phylogenetic relationships among them. Furthermore, some of these subtaxa are also poorly represented in the sample due to the random selection. Considering these observations and the statistical results for PC1, it should be acknowledged that GLMs might not be the most favourable method to study the WP variation, and phylogenetic analyses can be more suitable for these data (e.g., Goloboff and Catalano, 2011). This would also imply the requirement to consider additional characters in future analyses.
About the statistical models using the measured area of the specimens in mm2, an exponential relationship is observed between this variable and the size proxies used in this study (i.e., the centroid size, the diameter, and the whorl height, Table 3, Figure 12). The model considering the centroid size requires the inclusion of the subtaxa to approximate a statistical distribution (Table 3). The data for this model also show more dispersion around the mean values, which might indicate that different WPSs reach equivalent whorl areas; an observation congruent from prior results obtained from the morphospace in this study. In general, Mesozoic taxa show higher whorl profile areas than Paleozoic taxa, and groups within Ammonitida reach the highest measured areas among the subtaxa (controlled by size, Appendix 4, Figure 1). In this sense, members of the “Ancyloceratina” and Lytoceratina reach the highest measured areas. Furthermore, the diameter and the whorl height show a similar exponential pattern compared to the centroid size; in both cases the slope values are similar as well (Table 3, Figure 12). These results suggest a tendency for the diameter and the whorl height to reach particular whorl areas, a relationship expected from an increase in the body size, but also closely linked to the constraints for buoyancy (Naglik et al., 2015). An alternative explanation involving the organism’s biomineralizing surface, the general volume/area, and the size was inferred by Guex (2003) who signalled different trade-offs among these factors. In this context, our results indicate that ammonoids exhibit a tendency to greater whorl areas through time and might be related to Cope’s rule as well (Guex, 2003).
Closing Remarks
Here we summarise some of the possible constraints that might play a role in the WPS variation of ammonoid conchs that can lead to morphological convergence in this group. We also provide statistical evidence that the WPS might sustain phylogenetic value. In this sense, even though we were unable to provide statistical models for PC2 and PC3, there is a clear tendency for particular taxa to reach extreme scores for these principal components (e.g., members of the Lytoceratina reach very low PC2 scores, Figure 6B). This concerns some of the remaining principal components as well, hinting that some WP variations are characteristic of specific taxa (Appendix 4). Furthermore, observed covariations of morphometric parameters reflect complex interactions between the transformations resumed by the obtained principal components, possibly explaining the inconsistencies concerning Buckman’s rules of covariation (Monnet et al., 2015c). The exact mechanisms causing these transformations are unknown, but a compromise between the area and the streamlining is inferred. This has been proposed previously by Tendler et al. (2015) and Klug et al. (2016), and our findings seem to support this assessment. Furthermore, given the relationship between PC1 and the WP area, it is likely that the biological mechanism involved is associated with the ontogenetic growth in ammonoids. Note that herein we used a basic 18 semi-landmarks configuration to study the WP, so there is an implicit simplification of the original data, which can lead to additional errors in the analyses. In this regard, new advances in the method allowed the inclusion of more accurate models (up to 174 semi-landmarks). Experiments using these configurations in a subsample of the data frame indicate that the variance explained by PC1 might be underestimated by around 8 to 10% (summarising the same transformations), reducing some of the variation explained by the remaining principal components. These results remain to be corroborated using the complete sample.
CONCLUSIONS
We provide a detailed depiction of the whorl profile morphospace illustrating the morphological changes found in ammonoid taxa. Such variation can be summarised by 10 principal components, the first three comprising around 87% of the variation found in the sample. Shape variation along PC1 is mainly associated with the degree of conch compression, but changes in the degree of whorl overlap and in the whorl section area also play a role in the distribution of the whorl profiles along this axis. By studying the predicted WP areas for PC1, we found an optimal score for this parameter corresponding to the most densely occupied regions of the morphospace. Above this optimal score the WP area is reduced, and the morphospace is unoccupied. Statistical analyses based on a linear additive model for PC1 indicate a significant association with several subtaxa within Ammonoida and the whorl size (the centroid size), suggesting that these two predictors do not interact between each other.
PC2 compromises morphological transformations involving stretching and compression of the WPS along the vertical axis leading to changes in the degree of whorl overlap (so to IZR) as well. Given that an increase in PC2 implies a cost to the whorl area, and a more streamlined WS (possibly reducing the drag coefficient), this principal component might be related to the streamlining phenomenon observed on other organisms leading to an enhanced hydrodynamic performance of the final conch morphology.
PC3 involves changes in the shape of the venter (from flat to rounded), and in the curvature of the flanks. This principal component appears to be related to modifications of the whorl shape, necessary to achieve some extreme WPSs (e.g., such as very compressed whorls).
Based on these results, the ammonoid whorl profile morphology appears to be constrained by the relative available whorl profile area, the size of the flanks around the imprint zone, the expansion rate, and the hydrodynamic performance of the resulting conch morphology. Moreover, the measured whorl profile area shows an exponential relationship with the ammonoid size proxies (i.e., the centroid size, the diameter, and the whorl height). In this regard, Mesozoic taxa were characterised by higher whorl profile areas than Paleozoic taxa. Furthermore, members of Ammonitida possessed the highest whorl profile area among the subtaxa evaluated.
ACKNOWLEDGMENTS
Authors thank to the Museo Jose Royo y Goméz (Servicio Geológico Colombiano, Bogotá, Colombia) for giving access to some of the specimens used in this study. Thanks to M.C. Rodríguez Amenábar (Instituto Antártico Argentino, Buenos Aires, Argentina) and M. Tanuz (Universidad de Buenos Aires, Buenos Aires, Argentina) for the loan of specimens under their care. Thanks to the Ruhr Universität Bochum for providing some of the tomographic datasets used in this work. Special thanks to the cephalopod research community, the online repositories, and to all the authors that provided free open-access to the data required for this study. The first author would like to express his gratitude to all the collaborators whose comments and observations were invaluable during the elaboration of this work. Lastly, thanks to the suggestions of the anonymous reviewers, who greatly improve the quality of this manuscript. This is the contribution R-442 of the Instituto de Estudios Andinos ‘Don Pablo Groeber’ (IDEAN, UBA-CONICET).
REFERENCES
Note: Appendix 6 is a list of additional references for Appendices 1-5.
Adams, D.C., Collyer, M., Kaliontzopoulou, A., and Baken, E.K. 2021. Geomorph: Software for geometric morphometric analyses. R package version 4.0. Methods in Ecology and Evolution, 4:393-399.
Allen, E.G. 2007. Understanding Ammonoid Sutures: New Insight into the Dynamic Evolution of Paleozoic Suture Morpholog, p. 159-180. In Landman, N.H., Davis, R.A., and Mapes, R.H. (eds.), Cephalopods Present and Past: New Insights and Fresh Perspectives. Springer Netherlands, Dordrecht. https://doi.org/10.1007/978-1-4020-6806-5_8
Balini, M., Krystyn, L., Levera, M., and Tripodo, A. 2012. Late Carnian-Early Norian ammonoids from the GSSP candidate section Pizzo Mondello (Sicani Mountains, Sicily). Rivista Italiana di Paleontologia e Stratigrafia, 118:47-84. https://doi.org/10.13130/2039-4942/5992
Bambach, R.K., Knoll, A.H., and Wang, S.C. 2004. Origination, extinction, and mass depletions of marine diversity. Paleobiology, 30:522-542. https://doi.org/10.1666/0094-8373(2004)030<0522:OEAMDO>2.0.CO;2
Bardin, J., Rouget, I., and Cecca, F. 2014. Cladistics in ammonoids: Back to the future. Neues Jahrbuch für Geologie und Paläontologie - Abhandlungen, 274:239-253. https://doi.org/10.1127/njgpa/2014/0449
Bayer, U. and McGhee, G.R. 1984. Iterative evolution of Middle Jurassic ammonite faunas. Lethaia, 17:1-16. https://doi.org/10.1111/j.1502-3931.1984.tb00661.x
Bischof, E.A., Schlüter, N., Korn, D., and Lehmann, J. 2021. Ontogeny of highly variable ceratitid ammonoids from the Anisian (Middle Triassic). PeerJ, 9e10931:1-26. https://doi.org/10.7717/peerj.10931
Blender Online Community 2022. Blender, a 3D Modelling and Rendering Package.
https://www.blender.org/download/releases/2-81/
Brosse, M., Brayard, A., Fara, E., and Neige, P. 2013. Ammonoid recovery after the Permian-Triassic mass extinction: a re-exploration of morphological and phylogenetic diversity patterns. Journal of the Geological Society, 170:225-236.
https://doi.org/10.1144/jgs2012-084
Bucher, H., Landman, N.H., Klofak, S.M., and Guex, J. 1996. Mode and Rate of Growth in Ammonoids, p. 407-461. In Landman, N.H., Tanabe, K., and Davis, R.A. (eds.), Ammonoid Paleobiology. Topics in Geobiology, vol 13. Springer US, Boston, MA. https://doi.org/10.1007/978-1-4757-9153-2_12
Carmona, M. 2022. morphospace 0.0.0. R package version 4.2.1. CRAN.R virtual repository. https://github.com/millacarmona/morphospace.git
Chirat, R., Goriely, A., and Moulton, D.E. 2021. The physical basis of mollusk shell chrial coiling. The Proceedings of the National Academy of Sciences, 118:e2109210118. https://doi.org/10.1073/pnas.2109210118
Courville, P. and Crônier, C. 2016. Diversity or disparity in the Jurassic (Upper Callovian) genus Kosmoceras (Ammonitina): A morphometric approach. Journal of Paleontology, 79:944-953.
https://doi.org/10.1666/0022-3360(2005)079[0944:DODITJ]2.0.CO;2
De Baets, K., Klug, C., and Monnet, C. 2013. Intraspecific variability through ontogeny in early ammonoids. Paleobiology, 39:75-94. https://doi.org/10.1666/0094-8373-39.1.75
De Baets, K., Bert, D., Hoffmann, R., Monnet, C., Yacobucci, M.M., and Klug, C. 2015. Ammonoid Intraspecific Variability, p. 359-426. In Klug, C., Korn, D., De Baets, K., Kruta, I., and Mapes, R.H. (eds.), Ammonoid Paleobiology: From anatomy to ecology. Topics in Geobiology, vol 43. Springer Netherlands, Dordrecht.
https://doi.org/10.1007/978-94-017-9630-9_9
de Chaumont, F., Dallongeville, S., Chenouard, N., Hervé, N., Pop, S., Provoost, T., Meas-Yedid, V., Pankajakshan, P., Lecomte, T., Le Montagner, Y., Lagache, T., Dufour, A., and Olivo-Marin, J.-C. 2012. Icy: an open bioimage informatics platform for extended reproducible research. Nature Methods, 9:690-696. https://doi.org/10.1038/nmeth.2075
Erlich, A., Moulton, D.E., Goriely, A., and Chirat, R. 2016. Morphomechanics and developmental constraints in the evolution of ammonites shell form. Journal of Experimental Zoology Part B: Molecular and Developmental Evolution, 326:437-450. https://doi.org/10.1002/jez.b.22716
Fish, F.E. 2009. Streamlining, p. 1123-1127. In Perrin, W.F., Würsig, B., and Thewissen, J.G.M. (eds.), Encyclopedia of Marine Mammals (Second Edition). Academic Press, London. https://doi.org/10.1016/B978-0-12-373553-9.00257-1
Gerber, S. 2017. The geometry of morphospaces: lessons from the classic Raup shell coiling model. Biological Reviews Cambridge Philosophical Society, 92:1142-1155. https://doi.org/10.1111/brv.12276
Goloboff, P. and Catalano, S. 2011. Phylogenetic morphometrics (II): Algorithms for landmark optimization. Cladistics, 27:42-51. https://doi.org/10.1111/j.1096-0031.2010.00318.x
Guex, J. 2003. A generalization of Cope’s rule. Bulletin de la Société Géologique de France, 174:449-452. https://doi.org/10.2113/174.5.449
Hebdon, N., Ritterbush, K., and Choi, Y. 2020. Computational fluid dynamics modeling of fossil ammonoid shells. Palaeontologia Electronica, 23:a21. https://doi.org/10.26879/956
Hendricks, J., Stigall, A., and Lieberman, B. 2015. The Digital Atlas of Ancient Life: delivering information on paleontology and biogeography via the web. Palaeontologia Electronica, 18.2.3E. https://doi.org/10.26879/153E
Hoffmann, R., Howarth, M., Fuchs, D., Klug, C., and Korn, D. 2022. The higher taxonomic nomenclature of Devonian to Cretaceous ammonoids and Jurassic to Cretaceous ammonites including their authorship and publication. Neues Jahrbuch für Geologie und Paläontologie - Abhandlungen, 305:187-197. https://doi.org/10.1127/njgpa/2022/1085
Hoffmann, R., Slattery, J.S., Kruta, I., Linzmeier, B.J., Lemanis, R.E., Mironenko, A., Goolaerts, S., De Baets, K., Peterman, D.J., and Klug, C. 2021. Recent advances in heteromorph ammonoid palaeobiology. Biological Reviews, 96:576-610. https://doi.org/10.1111/brv.12669
Jacobs, D.K. 1992. Shape, drag, and power in ammonoid swimming. Paleobiology, 18:203-220. https://doi.org/10.1017/S009483730001397X
Klein, C. and Korn, D. 2014. A morphometric approach to conch ontogeny of Cymaclymenia and related genera (Ammonoidea, Late Devonian). Fossil Record, 17:1-32. https://doi.org/10.5194/fr-17-1-2014
Klingenberg, C.P. 2016. Size, shape, and form: concepts of allometry in geometric morphometrics. Development Genes and Evolution, 226:113-37. https://doi.org/10.1007/s00427-016-0539-2
Klingenberg, C.P. 2020. Walking on Kendall’s Shape Space: Understanding shape spaces and their coordinate systems. Evolutionary Biology, 47:334-352. https://doi.org/10.1007/s11692-020-09513-x
Klug, C. and Hoffmann, R. 2015. Ammonoid Septa and Sutures, p. 45-90. In Klug, C., Korn, D., De Baets, K., Kruta, I., and Mapes, R.H. (eds.), Ammonoid Paleobiology: From anatomy to ecology. Topics in Geobiology, vol 43. Springer Netherlands, Dordrecht. https://doi.org/10.1007/978-94-017-9630-9_3
Klug, C., Zatoń, M., Parent, H., Hostettler, B., and Tajika, A. 2015a. Mature Modifications and Sexual Dimorphism, p. 253-320. In Klug, C., Korn, D., De Baets, K., Kruta, I., and Mapes, R.H. (eds.), Ammonoid Paleobiology: From anatomy to ecology. Topics in Geobiology, vol 43. Springer Netherlands, Dordrecht. https://doi.org/10.1007/978-94-017-9630-9_7
Klug, C., Korn, D., Landman, N.H., Tanabe, K., De Baets, K., and Naglik, C. 2015b. Describing Ammonoid Conchs, p. 3-24. In Klug, C., Korn, D., De Baets, K., Kruta, I., and Mapes, R.H. (eds.), Ammonoid Paleobiology: From anatomy to ecology. Topics in Geobiology, 43. Springer Netherlands, Dordrecht. https://doi.org/10.1007/978-94-017-9630-9_1
Klug, C., De Baets, K., and Korn, D. 2016. Exploring the Limits of Morphospace: Ontogeny and Ecology of Late Viséan Ammonoids from the Tafilalt, Morocco. Acta Palaeontologica Polonica, 61:1-14. https://doi.org/10.4202/app.00220.2015
Knauss, M. and Yacobucci, M. 2014. Geographic Information Systems technology as a morphometric tool for quantifying morphological variation in an ammonoid clade. Palaeontologia Electronica, 17:19A. https://doi.org/10.26879/418
Korn, D. 1995. Impact of environmental perturbations on heterochronic development in Palaeozoic ammonoids, p. 245-260. In McNamara, K.J. (ed.), Evolutionary Change and Heterochrony. Wiley.
Korn, D. 2010. A key for the description of Palaeozoic ammonoids. Fossil Record, 13:5-12. https://doi.org/10.1002/mmng.200900008
Korn, D., Ebbighausen, V., Bockwinkel, J., and Klug, C. 2003. The A-mode sutural ontogeny in prolecanitid ammonoids. Palaeontology, 46:1123-1132. https://doi.org/10.1046/j.0031-0239.2003.00336.x
Korn, D. and Klug, C. 2012. Palaeozoic ammonoids - diversity and development of conch morphology, p. 491-534. In Talent, J.A. (ed.), Earth and Life: Global Biodiversity, Extinction Intervals and Biogeographic Perturbations Through Time. Springer Netherlands, Dordrecht. https://doi.org/10.1007/978-90-481-3428-1_15
Landman, N., Garb, M., Rovelli, R., Ebel, D., and Edwards, L. 2012. Short-Term Survival of Ammonites in New Jersey After the End-Cretaceous Bolide Impact. Acta Palaeontologica Polonica, 57:703-715. https://doi.org/10.4202/app.2011.0068
Langerhans, R.B. and Reznick, D.N. 2010. Ecology and evolution of swimming performance in fishes: predicting evolution with biomechanics, p. 200-248. In Domenici, P. and Kapoor, B.G. (eds.), Fish Locomotion: An Eco-ethological Perspective. CRC Press, New York, USA. https://doi.org/10.1201/b10190
Leonova, T.B. 2002. Permian ammonoids: Classification and phylogeny. Paleontological Journal, 36:S1-S24.
Machalski, M. and Heinberg, C. 2005. Evidence for ammonite survival into the Danian (Paleogene) from the Cerithium Limestone at Stevns Klint, Denmark. Bulletin of the Geological Society of Denmark, 52:1-12. https://doi.org/10.37570/bgsd-2005-52-08
McGhee, G.R. 2012. The geometry of evolution: adaptive landscapes and theoretical morphospaces. Cambridge University Press., Cambridge, UK. https://doi.org/10.1017/CBO9780511618369
Monnet, C., De Baets, K., and Klug, C. 2011. Parallel evolution controlled by adaptation and covariation in ammonoid cephalopods. BMC Evolutionary Biology, 11:115. https://doi.org/10.1186/1471-2148-11-115
Monnet, C., Klug, C., and De Baets, K. 2015a. Evolutionary Patterns of Ammonoids: Phenotypic Trends, Convergence, and Parallel Evolution, p. 95-142. In Klug, C., Korn, D., De Baets, K., Kruta, I., and Mapes, R.H. (eds.), Ammonoid Paleobiology: From macroevolution to paleogeography. Topics in Geobiology, 43. Springer Netherlands, Dordrecht.
https://doi.org/10.1007/978-94-017-9633-0_5
Monnet, C., De Baets, K., and Yacobucci, M.M. 2015c. Buckman’s Rules of Covariation, p. 67-94. In Klug, C., Korn, D., De Baets, K., Kruta, I., and Mapes, R.H. (eds.), Ammonoid Paleobiology: From macroevolution to paleogeography. Topics in Geobiology, 43. Springer Netherlands, Dordrecht. https://doi.org/10.1007/978-94-017-9633-0_4
Morón-Alfonso, D., Hoffmann, R., and Cichowolski, M. 2021. Geometric morphometrics in ammonoids based on virtual modelling. Palaeontologia Electronica, 24.3.a29. https://doi.org/10.26879/1157
Moulton, D.E., Goriely, A., and Chirat, R. 2015. The morpho-mechanical basis of ammonite form. Journal of Theoretical Biology, 364:220-230. https://doi.org/10.1016/j.jtbi.2014.09.021
Naglik, C., Tajika, A., Chamberlain, J., and Klug, C. 2015. Ammonoid Locomotion, p. 649-688. In Klug, C., Korn, D., De Baets, K., Kruta, I., and Mapes, R.H. (eds.), Ammonoid Paleobiology: From anatomy to ecology. Topics in Geobiology, 43. Springer Netherlands, Dordrecht. https://doi.org/10.1007/978-94-017-9630-9_17
Nätscher, P.S., Dera, G., Reddin, C.J., Rita, P., and De Baets, K. 2021. Morphological response accompanying size reduction of belemnites during an Early Jurassic hyperthermal event modulated by life history. Scientific Reports, 11:14480.
https://doi.org/10.1038/s41598-021-93850-0
Neige, P. 1999. The Use of Landmarks to Describe Ammonite Shape, p. 263-272. In Olóriz, F., and Rodríguez-Tovar, F.J. (eds.), Advancing Research on Living and Fossil Cephalopods. Springer New York. https://doi.org/10.1007/978-1-4615-4837-9_20
Okamoto, T. 1996. Theoretical Modeling of Ammonoid Morphology, p. 225-251. In Landman, N.H., Tanabe, K., and Davis, R.A. (eds.), Ammonoid Paleobiology. Springer, Boston, MA. https://doi.org/10.1007/978-1-4757-9153-2_8
Peterman, D., Ciampaglio, C., and Yacobucci, M. 2019. Stable hooks: effects of the u-shaped body chamber of adult heteromorphic ammonoids on hydrostatic stability and hydrodynamic restoration. Geological Society of America Abstracts with Programs, 51:171-6. https://doi.org/10.1130/abs/2019AM-334021
Peterman, D., Hebdon, N., Ciampaglio, C.N., Yacobucci, M.M., Landman, N.H., and Linn, T. 2020. Syn vivo hydrostatic and hydrodynamic properties of scaphitid ammonoids from the U.S. Western Interior. Geobios, 60:79-98. https://doi.org/10.1016/j.geobios.2020.04.004
Raup, D.M. 1967. Geometric analysis of shell coiling: Coiling in ammonoids. Journal of Paleontology, 41:43-65.
Ritterbush, K.A. and Bottjer, D.J. 2012. Westermann Morphospace displays ammonoid shell shape and hypothetical paleoecology. Paleobiology, 38:424-446, 23. https://doi.org/10.1666/10027.1
Saunders, W.B. and Swan, A.R.H. 1984. Morphology and morphologic diversity of Mid-Carboniferous (Namurian) ammonoids in time and space. Paleobiology, 10:195-28. https://doi.org/10.1017/S0094837300008162
Saunders, W.B., Work, D.M., and Svetlana, V.N. 2004. The evolutionary history of shell geometry in Paleozoic ammonoids. Paleobiology, 30:19-43. https://doi.org/10.1666/0094-8373(2004)030<0019:TEHOSG>2.0.CO;2
Saunders, W.B., Greenfest-Allen, E., Work, D.M., and Nikolaeva, S.V. 2008. Morphologic and taxonomic history of Paleozoic ammonoids in time and morphospace. Paleobiology, 34(1):128-154. https://doi.org/10.1666/07053.1
Schlager, S. 2020. Morpho and Rvcg - Shape Analysis in R: R-Packages for Geometric Morphometrics, Shape Analysis and Surface Manipulations, p. 217-256. In Guoyan, Z., Shuo, L., and Gabor, S. (eds.), Statistical Shape and Deformation Analysis. Academic Press. https://doi.org/10.1016/B978-0-12-810493-4.00011-0
Scotese, C. 2014. Atlas of Plate Tectonic Reconstructions (Mollweide Projection). PALEOMAP Project PaleoAtlas for ArcGIS, 1-6:1-46. https://doi.org/10.13140/2.1.1046.4967
Scotese, C. and Wright, N. 2018. PALEOMAP Paleodigital Elevation Models (PaleoDEMS) for the Phanerozoic [Data set]. ZENODO. https://doi.org/10.5281/zenodo.5460860
Sepkoski, J.J. 1996. Patterns of Phanerozoic Extinction: a Perspective from Global Data Bases, p. 35-51. In Walliser, O.H. (ed.), Global Events and Event Stratigraphy in the Phanerozoic: Results of the International Interdisciplinary Cooperation in the IGCP-Project 216 “Global Biological Events in Earth History”. Springer Berlin Heidelberg, Berlin, Heidelberg.
https://doi.org/10.1007/978-3-642-79634-0_4
Simon, M.S., Korn, D., and Koenemann, S. 2010. Disparity fluctuations in Jurassic ammonoids by means of conch geometry. Palaeogeography, Palaeoclimatology, Palaeoecology, 292:520-531. https://doi.org/10.1016/j.palaeo.2010.04.023
Simon, M.S., Korn, D., and Koenemann, S. 2011. Temporal patterns in disparity and diversity of the Jurassic ammonoids of southern Germany. Fossil Record, 14:77-94. https://doi.org/10.1002/mmng.201000016
Tendler, A., Mayo, A., and Alon, U. 2015. Evolutionary tradeoffs, Pareto optimality and the morphology of ammonite shells. BMC Systems Biology, 9:1-12. https://doi.org/10.1186/s12918-015-0149-z
Ubukata, T., Tanabe, K., Shigeta, Y., Maeda, H., and Mapes, R.H. 2008. Piggyback Whorls: A new theoretical morphologic model reveals constructional linkages among morphological characters in ammonoids. Acta Palaeontologica Polonica, 53:113-128. https://doi.org/10.4202/app.2008.0108
Wang, Q., Koval, J.J., Mills, C.A., and Lee, K.-I.D. 2007. Determination of the selection statistics and best significance level in Backward Stepwise Logistic Regression. Communications in Statistics - Simulation and Computation, 37:62-72.
https://doi.org/10.1080/03610910701723625
Wegerer, M., De Baets, K., and Korn, D. 2018. Quantitative analysis of suture lines in Carboniferous ammonoids. Fossil Record, 21:223-236. https://doi.org/10.5194/fr-21-223-2018
Wickham, H. 2009. ggplot2: Elegant Graphics for Data Analysis. Springer,Dordrecht.
https://doi.org/10.1007/978-0-387-98141-3
Wright, C.W., Callomon, J.H., and Howarth, M.K. 1996. Cretaceous Ammonoidea, p. 1-362. In Kaesler, R.I. (ed.), Treatise in Invertebrate Paleontology, Part L, Mollusca 4, revised. The Geological Society of America, The University of Kansas, Boulder, Colorado, and Lawrence, Kansas.
Yacobucci, M. 2004. Buckman’s Paradox: variability and constraints on ammonoid ornament and shell shape. Lethaia, 37:57-69. https://doi.org/10.1080/00241160410004755
