

 Paleoecology of the Rhinocerotidae (Mammalia, Perissodactyla) from Béon 1, Montréal-du-Gers (late early Miocene, SW France): Insights from dental microwear texture analysis, mesowear, and enamel hypoplasia
Article number: 24.2.a27
https://doi.org/10.26879/1163
Copyright Palaeontological Association, August 2021
Author biographies
Plain-language and multi-lingual abstracts
PDF version
Submission: 21 April 2021. Acceptance: 6 August 2021.
ABSTRACT
The late early Miocene Béon 1 locality has yielded an abundant vertebrate fauna with more than 5,000 remains assigned to four rhinocerotid species: the stem rhinocerotine Plesiaceratherium mirallesi, the teleoceratines Prosantorhinus douvillei and Brachypotherium brachypus, and the early-diverging elasmotheriine Hispanotherium beonense. Such a profusion of closely related large herbivore species co-occurring raises questions about habitat capacity and niche partitioning. To investigate potential niche partitioning of Béon 1 rhinocerotids, we studied their ecology through texture microwear (short-term diet proxy), mesowear (long-term diet proxy), and enamel hypoplasia (environmental stress proxy). The mesowear revealed no significant differences between the species, with low scores suggesting browsing preferences, while microwear suggested subtle dietary variations. We concluded that Plesiaceratherium mirallesi and Prosantorhinus douvillei were browsers probably consuming a lot of leaves, while Brachypotherium brachypus and Hispanotherium beonense were mixed-feeders. Concerning hypoplasia, the overall prevalence was high at Béon 1, with more than 25 % of the teeth affected (216 teeth out of 832). There were, however, huge discrepancies depending on the species, tooth loci, or type of hypoplasia considered. Interestingly, H. beonense had the greatest dietary flexibility and the lowest hypoplasia prevalence (13.04 %). Both teleoceratines were very affected by hypoplasia, suggesting whether a comparable high sensitivity to stress (phylogeny) or similar habitat-related stresses (environment). The most affected loci were p4 (48.15 %), m3 (46.81 %), and D4 (46.15 %), reflecting vulnerability periods around weaning, environment-related, and near birth, respectively.
Manon Hullot. Institut des Sciences de l'Évolution, UMR5554, Université de Montpellier, CNRS, IRD, EPHE, Place Eugène Bataillon, CC064, 34095 Montpellier, France. manon.hullot@gmail.com
Yves Laurent. Muséum de Toulouse, 35 Allées Jules Guesde, F-31000 Toulouse, France. Yves.LAURENT@toulouse-metropole.fr
Gildas Merceron. PALEVOPRIM, UMR 7262, CNRS, Université de Poitiers, 86073 Poitiers, France. gildas.merceron@univ-poitiers.fr
Pierre-Olivier Antoine. Institut des Sciences de l'Évolution, UMR5554, Université de Montpellier, CNRS, IRD, EPHE, Place Eugène Bataillon, CC064, 34095 Montpellier, France. pierre-olivier.antoine@umontpellier.fr
Keywords: environmental stress; feeding ecology; General Linear Mixed Models (GLMM); niche partitioning; rhinocerotids; ungulates, rhinoceros, France
Final citation: Hullot, Manon, Laurent, Yves, Merceron, Gildas, and Antoine, Pierre-Olivier. 2021. Paleoecology of the Rhinocerotidae (Mammalia, Perissodactyla) from Béon 1, Montréal-du-Gers (late early Miocene, SW France): Insights from dental microwear texture analysis, mesowear, and enamel hypoplasia. Palaeontologia Electronica, 24(2):a27. https://doi.org/10.26879/1163
palaeo-electronica.org/content/2021/3433-beon-1-rhinocerotids-ecology
Copyright: August 2021 Palaeontological Association.
This is an open access article distributed under the terms of Attribution-NonCommercial-ShareAlike 4.0 International (CC BY-NC-SA 4.0), which permits users to copy and redistribute the material in any medium or format, provided it is not used for commercial purposes and the original author and source are credited, with indications if any changes are made.
creativecommons.org/licenses/by-nc-sa/4.0/
INTRODUCTION
Using multiple approaches for addressing a question proves to be useful in paleontology because it allows for yielding more robust results and broader insights. Despite that fact, many studies remain centered around one method only, which may lead to misinterpretations (Jones and DeSantis, 2017). For instance, both microwear and mesowear are diet-related proxies, but they are relevant at different time scales (Davis and Pineda-Munoz, 2016). The study of mesowear alone, which is a cumulative over-life dietary signal (Ackermans et al., 2020), might miss seasonal variations or near-death modifications of the diet, while microwear alone, which documents the diet during the last days to weeks (Grine, 1986; Winkler et al., 2020), might only reveal a subset of dietary preferences (Schulz et al., 2007; Jones and DeSantis, 2017; Rivals et al., 2020).
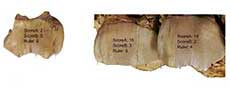
 The locality of Béon 1 (Montréal-du-Gers, Occitanie, France; Figure 1) is dated from the late early Miocene, about 17 million years ago and corresponding to the upper part of the MN4 of the European Neogene Mammal zones system (Antoine and Duranthon, 1997; Rage and Bailón, 2005; Antoine et al., 2018). The locality landscape is reconstructed as an oxbow lake surrounded by a wooded savannah-like biome (Duranthon et al., 1999; Rage and Bailón, 2005). It has yielded an abundant and diverse vertebrate fauna, including five species of rhinocerotids (Crouzel et al., 1988; Antoine and Duranthon, 1997; Duranthon et al., 1999; Orliac et al., 2006; Antoine et al., 2018). Four of these species - Plesiaceratherium mirallesi (abbreviated Pl. mirallesi hereunder), Prosantorhinus douvillei (abbreviated Pr. douvillei hereunder), Brachypotherium brachypus, and Hispanotherium beonense - are documented by abundant dental samples, with over 1,000 teeth found either isolated or in tooth rows (Antoine and Duranthon, 1997; Antoine et al., 2000; Hullot and Antoine, 2020). The postcranial material is also abundant (Antoine, 2002), and it allows for considering the following minimum number of individuals (MNI): five individuals of B. brachypus, 40 of Pr. douvillei, 38 of Pl. mirallesi, and seven of H. beonense, for a total MNI equaling 90. Regarding other herbivore mammals, Béon 1 locality yielded proboscideans, such as the deinotheriid Prodeinotherium bavaricum and the elephantoid Gomphotherium gr. sylvaticum (Antoine and Duranthon, 1997; Tassy, pers. comm. 2021), a wide array of ruminants (Duranthon et al., 1995) and suoids (Orliac, 2006; Orliac et al., 2006), and a three-toed equoid (Anchitherium aurelianense; Crouzel et al., 1988). This species-rich herbivore assemblage is interpreted as resulting from an attritional accumulation and most specimens originate from a single 15-50 cm thick dark clay layer, distributed over a 500 m2 surface, in one piece (Antoine and Duranthon, 1997; Duranthon et al., 1999; Hullot and Antoine, 2020). Indeed, numerous marks of trampling are observed on cranio-dental and postcranial remains, most being compatible with three- and four-toed rhinocerotid feet (see Hullot and Antoine, 2020 for further details on geology and taphonomy of the locality). As such, it offers a perfect setting for testing resource availability and potential niche partitioning among associated rhinocerotids, even if direct ecological interaction could not be evidenced a priori between these four species.
Previous studies investigated the rhinocerotids from Béon 1 but remained evasive on their ecologies. Nevertheless, different habitats were inferred for these four species based on their morphology. Both teleoceratines (B. brachypus and Pr. douvillei) are considered swamp dwellers due to their short limbs and stout silhouette, while the slender-limbed hornless rhinocerotine Pl. mirallesi is interpreted as living in open woodland, and the early-diverging elasmotheriine H. beonense in savannah-like open environments (Antoine and Duranthon, 1997; Antoine et al., 2000; Bentaleb et al., 2006). Enamel carbonate oxygen isotope composition (δ18O) suggested that all species shared a common source of drinking water (Bentaleb et al., 2006), i.e., the oxbow lake itself or the main river, falling in the home range of all rhinocerotid species (10-100 km2 in extant species; Owen-Smith, 1988) without necessarily being their preferred habitat. Eventually the few differences between the δ18O of both teleoceratine species, thought to live in the same habitat (swamp), might be due to different dietary preferences with different oxygen content (Bentaleb et al., 2006). All these previous findings point towards niche partitioning of Béon 1 rhinocerotids.
To investigate the ecology and the eventual niche partitioning of these four rhinocerotid species from the Miocene locality of Béon 1, we used several approaches on the abundant dental material. For this matter, multi-proxy approaches proved successful in revealing subtle niche partitioning in extant species (Merceron et al., 2021). Our approach combined dental microwear textures analyses (DMTA), mesowear, and enamel hypoplasia. Microwear (DMTA) and mesowear allowed for assessing dietary preferences at two different time scales (short term for microwear and long term for mesowear), and enamel hypoplasia revealed stress vulnerability. The objectives of this paper were to: i) characterize the dietary preferences of Béon 1 rhinos, ii) investigate intraspecific stress vulnerability, and iii) reveal subtle details of niche partitioning and competition.
ABBREVIATIONS
For teeth, lowercases refer to lower teeth and uppercases to upper teeth as follows: d/D - deciduous teeth, p/P - permanent premolars, m/M - permanent molars. Prosantorhinus douvillei is abbreviated as Pr. douvillei and Plesiaceratherium mirallesi as Pl. mirallesi to avoid confusion.
DMTA: Dental microwear texture analyses (here using scale-sensitive fractal analyses).
Abbreviations of DMTA parameters as follows, epLsar: anisotropy, Asfc: complexity, FTfv: fine textural-fill volume, HAsfc: heterogeneity of the complexity (whether it is HAsfc9 or HAsfc81).
Other abbreviations, OR: occlusal relief, CS: cusp shape, LEH: linear enamel hypoplasia, MHNT: Muséum d’Histoire Naturelle de Toulouse.
MATERIALS AND METHODS
All material from Béon 1 is stored permanently at the MHNT. We studied all available teeth, both isolated and from tooth rows, for a total amount of around 1,000 teeth. However, depending on the constraints of the different methods used (microwear, mesowear, and hypoplasia) the dataset was restricted as detailed thereafter.
Dental Microwear Texture Analyses (DMTA)
Dental microwear is the study of microscopic scars left by food at the surface of the enamel. The shape and quantity of these scars are linked to the type of food items (and especially to their mechanical properties) consumed by the individual and the way to comminute these items, during the last few meals prior to its death (Hoffman et al., 2015; Winkler et al., 2020). Dental microwear is a short-term (Teaford and Oyen, 1989; Winkler et al., 2020) proxy of diet (Teaford, 1991; Rivals et al., 2014; Ramdarshan et al., 2016), widely used in paleontology for various mammalian clades (Grine, 1986; Solounias and Semprebon, 2002; Calandra et al., 2008; Jones and DeSantis, 2017; Berlioz et al., 2018; Rivals et al., 2020). In this study, we used Dental Microwear Texture Analyses (DMTA) with sensitive-scale fractal analyses to study microwear. This DMTA method was developed by Ungar et al. (2003), and we followed a protocol based on Scott et al. (2005).
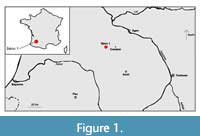
 We sampled one molar - preferentially the second (first or third otherwise) whether it was upper or lower, left, or right - displaying a good state of preservation and a sufficient wear, for each specimen. We analyzed two facets, one shearing and one grinding, from the same enamel band on the lingual part of the protocone on upper molars and distally to the protoconid or hypoconid (if the protoconid facet was unavailable) on lower molars (Figure 2). Sometimes the shearing facet was not developed and could not be sampled. Our dataset was also split according to the preparation method used on the specimens - hand-prepared or sand-prepared (using sand blasting) - to test the effect of sand blasting on microwear signals.
After selection, the facets of interest were cleaned twice with cotton-swabs soaked in acetone or ethanol, and two silicone molds were produced (Regular Body President, ref. 6015 - ISO 4823, medium consistency, polyvinylsiloxane addition type; Coltene Whaledent). The second mold was used for further analyses. Scans of the molded facets were obtained with a Leica DCM8 confocal profilometer (“TRIDENT” profilometer housed at the PALEVOPRIM, CNRS, and University of Poitiers) using white light confocal technology with a Leica 100× objective (Numerical aperture: 0.90; working distance: 0.9 mm; Leica Microsystems). The .Plμ files obtained were then pre-treated under LeicaMap v.8.2. (Leica Microsystems) as follows: surface inversion (scans produced on negative replicas), replacement of the missing points (i.e., non-measured, less than 1%) by the mean of the neighboring points, removal of aberrant peaks with automatic operators including a morphological filter (see Supplementary Information in Merceron et al., 2016 for details), and levelling of the surfaces. A 200×200-μm area (1551×1551 pixels) was selected and saved as a digital elevation model (.sur) to be used for DMTA. As some surfaces included Hunter-Schreger bands we ran a final removal of form (polynomial of degree 8) and a last levelling to temper the potential relief effects in the parameter calculations. These surfaces were then analyzed using the Scale-Sensitive Fractal Analysis with Toothfrax and Sfrax softwares (Surfract, www.surfract.com) following Scott et al. (2006) or using Sfrax and LeicaMap. For our study we selected five classical DMTA parameters:
• anisotropy (exact proportion of length-scale anisotropy of relief; epLsar), which measures the orientation concentration of surface roughness;
• complexity (area-scale fractal complexity; Asfc) that estimates the roughness at a given scale;
• heterogeneity of complexity (heterogeneity of area-scale fractal complexity here at 3×3 and 9×9; HAsfc9 and HAsfc81) reflecting the variation of complexity within the studied zone;
• fine textural fill volume (here at 0.2 μm; FTfv) estimated by filling the surface with square cuboids of different volumes and is linked to surface relief (see Scott et al., 2006 for details).
We used a dataset modified from that of Hullot et al. (2019), with two new specimens as detailed below, and encompassing all five living rhinoceros’ species to facilitate the interpretation of fossil textural microwear. The dataset consists of 17 specimens of Ceratotherium simum (white rhinoceros), four of Dicerorhinus sumatrensis (Sumatran rhinoceros), 21 of Diceros bicornis (black rhinoceros), 15 of Rhinoceros sondaicus (Javan rhinoceros; one new specimen), and five of Rhinoceros unicornis (Indian rhinoceros; one new specimen).
Mesowear
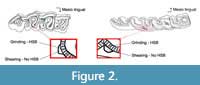
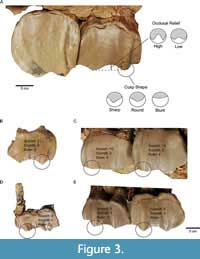 Dental mesowear studies ungulate molars occlusal morphology through relief and sharpness of cusp apices to categorize the gross dental wear observed into dietary preferences. Mesowear typically relies on two variables (Figure 3) scored originally on second upper molars as proposed by Fortelius and Solounias (2000):
• occlusal relief (OR) that can be high or low;
• cusp shape (CS) taking the values sharp, round, or blunt.
With this method, browsers are characterized by a high percentage of attrition-dominated specimens with high relief and sharp cusps, while grazers are abrasion-dominated with low relief and blunt cusps (Fortelius and Solounias, 2000). Nevertheless, as abrasion is cumulative over-life, there is an ontogeny effect in the mesowear signal (Fortelius and Solounias, 2000), which we took into account by using age classes as defined by Hillman-Smith et al. (1986).
In this study, we used three different mesowear scores to assess dietary preferences (Table 1):
• Score A: better known as ‘Mesowear I & II—Expanded’ (Solounias et al. 2014; Ackermans 2020) with refined categories for both OR and CS (e.g., high-high, high-low, round-round) giving scores between 1 (high-high sharp) and 17 (low blunt), based on the work of Winkler and Kaiser (2011);
• Score B: or ‘Mesowear II’ which is a conversion of the classic original scoring (‘Mesowear I’) from Fortelius and Solounias (2000) as proposed by Rivals et al. (2007) into a score ranging from 0 (high relief sharp cusp) to 3 (low relief blunt cusp);
• Ruler: mesowear II ruler developed by Mihlbachler et al. (2011) on equid perissodactyls, giving scores from 0 to 6.
These methods were applied to all available upper permanent molars (M1, M2, and M3) and to the third and fourth upper deciduous teeth (D3 and D4). Mesowear was assessed on the paracone and not on the sharpest cusp (paracone or metacone) because significant differences between cusps have been reported in rhinoceros (Taylor et al., 2013). We studied deciduous teeth as they are molarized in rhinocerotids, which means that mesowear methods are easily transposable, and as they might give insights of the diet of juvenile and subadult individuals, and not only of adult individuals. Examples of scoring using the three different methods are provided in Figure 3.
Enamel Hypoplasia
Enamel hypoplasia is a permanent, sensitive, but non-specific and individual marker of stress. Causes of this enamel defect can be very diverse (around 100 factors interfering with normal amelogenesis in human are listed by Small and Murray, 1978), such as environmental stress (e.g., drought, food shortage; Skinner and Pruetz, 2012; Upex and Dobney, 2012), physiological stress (e.g., disease, parasitism; Suckling et al., 1986; Rothschild et al., 2001; Niven et al., 2004), and psychological stress (e.g., depression; Guatelli-Steinberg, 2001).
All cheek teeth available (deciduous and permanent) were included in the study of hypoplasia, with the exception of teeth too damaged, too worn, with not enough enamel visible (e.g., tooth unerupted in bone, sediment occluding), or not properly identified. This exclusion was considered because absence of hypoplasia in worn or damaged teeth might generate false negatives, and because hypoplasia on unidentified teeth is difficult to link to potential causes. This exclusion concerned 81 teeth: 10 permanent in B. brachypus, 19 (two deciduous - 17 permanent) in H. beonense, 28 (one deciduous - 27 permanent) in Pl. mirallesi, and 24 (four deciduous - 20 permanent) in Pr. douvillei. The analyzed sample represents a total of 832 teeth (197 deciduous molars and 635 permanent premolars and molars).
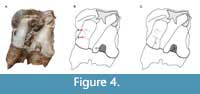 To our knowledge, no standard protocol nor threshold is available to differentiate normal from pathological enamel in any given species. Here, we have chosen to investigate enamel hypoplasia with the naked eye. The approach consisted in the macroscopical identification of defects, following the Fédération Dentaire Internationale index (1982) and associated caliper measurements. In this paper, we distinguished three types of hypoplasia as illustrated in Figure 4:
• linear enamel hypoplasia (LEH), defect forming a line around the crown;
• pitted hypoplasia, restricted rounded defect; and
• aplasia, zone entirely missing enamel.
Figure 4 also details the measurements taken: distance to enamel-dentine junction (linked to the age at which the defect occurred) and width of the defect when applicable (linked to the severity and duration of the stress). Other qualitative parameters were recorded: the type of tooth affected (e.g., second upper right molar), the position of the defect on the crown (labial or lingual, near which cusp), and its severity.
Statistics and Figures
All statistics were conducted in R (R Core Team, 2018. R: A language and environment for statistical computing. R Foundation for Statistical Computing, Vienna, Austria. URL https://www.R-project.org/.). Figures were done using R packages ggplot2 (Wickham, 2016), cowplot (Wilke, 2020), and gridExtra (Auguie, 2017), as well as Inkscape v.0.91.
General Linear Mixed Models (GLMM) were applied to our data. They were built using a R code modified from Arman et al. (2019), based on the package lme4 (Bates et al., 2015), and adapted to each tested response variable. For DMTA, response variables were the five DMTA parameters (epLsar, Asfc, FTfv, HAsfc9, and HAsfc81) and factors were: specimen (random factor), species, tooth (e.g., first molar, fourth premolar), position (upper or lower), side (left or right), cusp (protocone, protoconid, hypoconid), and facet (grinding or shearing). For mesowear, the variables were ScoreA (from 1 to 17; Winkler and Kaiser, 2011), ScoreB (from 0 to 3; Rivals et al., 2007), and Ruler (from 0 to 6; Mihlbachler et al., 2011), and the factors were: specimen (random factor), species, tooth (e.g., first molar, fourth premolar), category (deciduous or permanent), side (left or right), wear (low = stages 1 to 4, average = stages 5 to 7, high = stages 8 to 10 according to scale defined by Hillman-Smith et al., 1986), ontogeny (adult, subadult, juvenile; as defined in Hullot and Antoine, 2020), and cusp (sharpest or paracone). For hypoplasia, response variables were Hypo (1 or 0 for presence or absence of hypoplasia), Defect (e.g., LEH, Pits, Aplasia; converted to numbers), Multiple (number of defects), Severity (0 to 4), and factors were: specimen (random factor), species, tooth (e.g., first molar, fourth premolar), position (upper or lower), side (left or right), defect (converted to factor; for response variables Severity and Multiple), and wear (low, average, high; same categories as above). An example of this code applied to mesowear ScoreA is given in Appendix 1.
Model construction followed a bottom-up approach (i.e., adding factors incrementally to the model), starting with the factor specimen alone, which was the only random factor of our dataset. For the second model we added the factor species, as this was the principal interest of our analyses. We tested few interactions (e.g., Species x Facet for microwear) in the models as most factors were considered independent and to avoid unnecessarily complex models (models with interaction effects rarely selected after preliminary analysis; Arman et al., 2019). We created additional sets of models by adding a different factor (e.g., ontogeny, tooth, category, side, wear, cusp) to the second model (species + specimen) and selected the model that produced the lowest AIC score (Akaike’s Information Criterion) as the base for the next set of models. We repeated this process until there was no improvement in AIC score. After selecting the best model (lowest AIC), we checked for over-dispersion (estimated through the ratio of deviance and degrees of freedom) and corrected the model by using quasi-Poisson or quasi-Binomial laws from the MASS package (Venables and Ripley, 2002) if necessary. In total, 200 models were compared across the 12 response variables (see Appendix 2, Appendix 3, Appendix 4, Appendix 5).
RESULTS
DMTA: Modelling, Impact of Sand Preparation, and Dietary Preferences
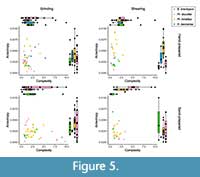 Median, mean, and standard deviation of the mean were calculated for every DMTA parameter (anisotropy, complexity, FTfv, HAsfc9, and HAsfc81) by species, facet, and preparation type (hand or sand blasting). All results are detailed in Table 2. As for dietary interpretation, only hand-prepared specimens are usable. Therefore, we will mainly refer to this subsample and compare it to the sand-prepared subsample to assess the influence of sand blasting on the microwear signal. In the hand-prepared subset, values of complexity were relatively similar among the four species on both facets, especially both teleoceratines, with most specimens plotting between 0.5 and 2 (Figure 5). Mean and median of complexity were low to moderate in all four species on both facets, ranging from 0.72 to 1.69. Within this sample, Pl. mirallesi had the highest values of anisotropy on the shearing facets (mean and median above 5x10⁻³) but values similar to those of Pr. douvillei and H. beonense on the grinding ones (2.5-3x10 -3; Figure 5, Table 2). The lowest values of anisotropy were those of B. brachypus, mostly around 2x10⁻³. The heterogeneities of complexity (HAsfc9 and HAsfc81) were low for Pl. mirallesi but moderate in other species on both facets (except shearing of Pr. douvillei). Eventually, FTfv had the highest value on the grinding facets of two teleoceratines, with a mean of 4.78x10⁴ for B. brachypus and 5.21x10⁴ for Pr. douvillei, and the lowest value on the shearing facets of B. brachypus, with a mean of 1.63x10⁴. Overall, the shearing facet seems to discriminate better between the species, especially through anisotropy (Figure 5), though both facets are useful for dietary studies, as they give insights into different moments of the mastication.
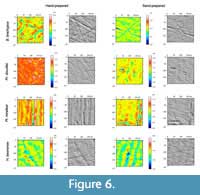 Sand-prepared specimens show lower values and less dispersion in anisotropy on both facets, but higher values and more dispersion in complexity, especially on the grinding facet (Figure 5). This is confirmed by mean and median values of Asfc for all species but H. beonense grinding and B. brachypus shearing, both exhibiting equivalent or lower values in the sand-prepared subset (Table 2). Concerning anisotropy, the shift is verified for species/facets with high values (Pl. mirallesi and H. beonense) but is less clear (shearing facet of Pr. douvillei) or inverted for other species (B. brachypus). The differences between hand- and sand-prepared surfaces are illustrated in Figure 6. Photo-simulations of the sand-prepared surfaces show bigger pits and coarser scratches, and the orientation of the scars is less obvious than in the hand-prepared surfaces. These observations are consistent with previous statements on anisotropy and complexity.
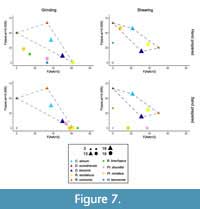 When compared to the living rhinoceros species dataset, we found that no species from Béon 1 was in the extant dietary space, except for the shearing facet of Pl. mirallesi, which clusters with the extant strict grazer C. simum and the folivore D. sumatrensis (Figure 7). The microwear pattern is clearly distinct at the species level, as the proportions of specimens with high anisotropy (epLsar > 0.005) and high complexity (Asfc > 2) change. Regarding sand preparation on the grinding facet, we observe more specimens above the complexity threshold and sensibly less above the anisotropy one, for all species but H. beonense. These tendencies between hand prepared and sand prepared are more subtle on the shearing facet: H. beonense displays less anisotropic specimens but still no complex ones, Pl. mirallesi presents less anisotropic specimens and slightly more complex ones, Pr. douvillei has still no anisotropic specimens but much more complex ones, and B. brachypus has more anisotropic specimens but still no complex ones (Figure 7).
For all response variables (epLsar, Asfc, FTfv, HAsfc9, and HAsfc81), model support increased (lower AIC) when intraspecific factors (e.g., tooth loci, preparation type, facet) were included. The final models contained three to five factors. Alongside species and specimen, preparation type was in all final models but that of FTfv. Facet appeared in the final models of epLsar, Asfc, and FTfv. Both HAsfc had the same final model, and epLsar and Asfc shared the same factors but differ in the presence of interactions. Details and comparison of all models can be seen in Appendix 3.
Based on GLMMs results, we can infer the impact of sand preparation on the microwear pattern. Sand-prepared specimens display significantly higher mean complexity (p-value = 5x10⁻⁴), HAsfc9, and HAsfc81 (df = 122, α = 0.95, t-values > 2.5). The choice of facet also appears crucial as shearing facet has higher mean anisotropy (p-value = 4x10⁻⁴), and lower mean complexity (p-value ≈ 0.003) and FTfv (p-values < 5x10⁻⁴). Significant or nearly significant interspecific differences were observed relatively to Pl. mirallesi (set as reference for GLMMs): Pr. douvillei had higher mean Asfc (p-value ≈ 0.06) and HAsfc81 (df = 122, α = 0.95, t-value = 1.97). The effects of interactions (species x preparation type x facet) were significant for anisotropy. The final model of FTfv includes tooth and position as factors, and it reveals that M3 has significantly lower mean FTfv than M2, and that upper teeth have significantly lower mean FTfv than the lower ones.
Mesowear: Modelling, Impact of Ontogeny, and Dietary Preferences
Out of the complete dataset used for GLMMs, we selected one tooth per specimen (preferentially M2) to calculate mean, standard deviation of the mean, and median of all mesowear scores (ScoreA, ScoreB, Ruler) by species. The results are given in Table 3. Mean of Ruler was around 2 for Pr. douvillei and Pl. mirallesi, lower in H. beonense (1.77), and higher in B. brachypus (3.5; Table 3). Median of Ruler was 2 for all species but B. brachypus. Mean ScoreA was around 7.5 and mean ScoreB between 0.77 and 0.98 for all species but B. brachypus for which they were considerably higher (10.5 and 2 respectively; Table 3). However, mesowear was assessed on only two molars for B. brachypus.
ScoreB and Ruler had lower means when only deciduous teeth were considered and higher ones when permanent teeth alone were studied for all species (Table 3). Median of ScoreB was 1 in all species and sample (all teeth, deciduous only, or permanent only), while that of Ruler was 1 with deciduous teeth and 2 otherwise (all teeth and permanent only). Concerning ScoreA, deciduous teeth also had lower means and permanent teeth higher ones for Pl. mirallesi and H. beonense, but it was the opposite for Pr. douvillei (Table 3).
Generalized linear mixed-models were built for each response variable (ScoreA, ScoreB, Ruler). For all variables, model support increased (lower AIC) when intraspecific factors (e.g., tooth loci, ontogeny, cusp) were included. The final models contained three to five factors, always including species, specimen, and ontogeny. Final models of ScoreA and ScoreB contained the same factors: specimens, species, tooth, cusp, and ontogeny. Details and comparison of all models can be seen in Appendix 4. Based on GLMMs results, we can infer the impact of ontogeny, tooth loci, or cusp sampled on the mesowear pattern. Ontogeny seems to play a crucial role in mesowear, as juveniles and subadults had significantly lower scores than adults for all methods (p-value < 0.05). Surprisingly, we found that D3, D4, M1, and M3 had higher mean mesowear ScoreA and ScoreB than M2. When scored on paracone, ScoreA and ScoreB yielded significantly higher mean values than with the sharpest cusp approach. Eventually, no significant interspecific differences were found in the mesowear score for any method (ScoreA, ScoreB, Ruler).
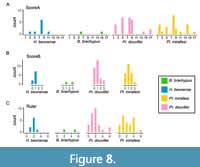 Despite the absence of significant differences between Béon 1 rhinocerotids, we observed different mesowear score profiles (Figure 8). The only two teeth of B. brachypus studied yielded very different mesowear scores for all methods (ScoreA: 6 and 15; ScoreB: 1 and 3; Ruler: 2 and 5). Concerning ScoreA, many specimens displayed the average mesowear score of 8 in all three remaining species and most specimens had a mesowear score below 10 (Figure 8). ScoreB for H. beonense was 0 or 1 for all specimens, while all scores from 0 to 3 were observed for Pl. mirallesi and Pr. douvillei. ScoreB over 1 was however limited for Pr. douvillei. Eventually, Ruler was between 1 and 3 for H. beonense with most specimens having a score of 2. All scores but 5 were observed for Pl. mirallesi and Pr. douvillei but similarly to ScoreB, the profile was skewed to higher scores in Pl. mirallesi (Figure 8).
Enamel Hypoplasia
At Béon 1, 216 teeth out of the 832 studied are affected by hypoplasia (all types of hypoplasia, all species, all dental loci), corresponding to an overall prevalence of 25.96 %. This prevalence corresponds to a minimum number of individuals affected by hypoplasia of 27 (Table 4) out of the 61 estimated at Béon 1 using tooth eruption incompatibilities (see Hullot and Antoine, 2020). There are, however, great variations depending on the type of hypoplasia, the species and the tooth locus considered.
As for species, the prevalence was between 13.04 % (12/92 teeth) for H. beonense and above 28 % for both Pl. mirallesi (98/340; 28.82%) and B. brachypus (13/46; 28.26%; Table 5). The prevalence by species must however be nuanced by the number of teeth available for each species: Pl. mirallesi and Pr. douvillei are equally abundant (340 and 354 teeth, respectively), while B. brachypus and H. beonense are scarce (46 and 92 teeth, respectively; Table 5).
Similarly, there are huge differences in the prevalence by tooth locus. Deciduous teeth are for instance less affected than permanent teeth with prevalences of 17.77 % (35/197) and 28.5 % (181/635), respectively, but permanent teeth are three times more numerous in the dataset (Table 5). This difference is clear for H. beonense (milk: 1/30, 3.33 %; permanent: 11/62, 17.74 %) and Pl. mirallesi (milk: 12/76, 15.79 %; permanent: 86/264, 32.58 %), but less pronounced in proportions for Pr. douvillei (milk: 21/90, 23.33 %; permanent: 72/264, 27.27 %). For B. brachypus there is only one deciduous tooth - a D1 - and it presents hypoplasia (two LEHs). Multiple events of hypoplasia were twice as frequent on permanent teeth (68/635; 10.71 %) than on deciduous ones (11/197; 5.58 %). However, the ratio of multiplicity against the number of hypoplastic teeth is similar in deciduous (11/35, 31.43 %) and permanent (68/181; 37.57 %) teeth, around one third. Overall, upper teeth (100/446; 22.42 %) are also significantly less hypoplastic than lower teeth (116/386; 30.1 %). The difference between upper and lower teeth was similar for Pr. douvillei (lower: 46/148, 31.08 %; upper: 47/206, 22.82 %) and Pl. mirallesi (lower: 54/151, 35.76 %; upper: 44/189, 23.28 %), but inverted for H. beonense: upper teeth (8/44; 18.18 %) were more affected than lower ones (4/48; 8.33 %). For B. brachypus, very few upper teeth were available, making such comparison hazardous.
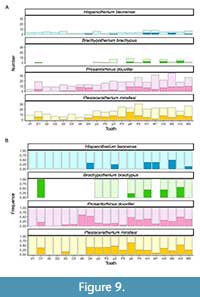 More precisely, d1/D1, d2/D2, and D3 were the least affected loci with less than 5% of the teeth presenting hypoplasia (even 0 % for d1 and D2). The most affected loci were p4 (48.15 %), m3 (46.81 %), and D4 (46.15 %). Hypoplasia prevalence is also high for d4 with 40 % of the teeth affected (Figure 9). Figure 9 highlights inter-specific differences in the most affected tooth loci. Few loci are affected for B. brachypus and H. beonense: for B. brachypus all lower permanent molars seem to be particularly affected, while for H. beonense M2 and m1/M1 seem more frequently hypoplastic. The other two species present a wider range of loci affected: for Pr. douvillei the most affected teeth are d4/D4, p4, and m3, while for Pl. mirallesi it is p4, m3, and p3 (Figure 9).
Concerning the type of hypoplasia, LEH (linear enamel hypoplasia) was the most frequent, affecting 17.55 % of the teeth (146/832) and corresponding to about the half of the defects encountered (Table 5). Pits were found on 7.45 % of the teeth (62/832) and aplasia on 2.4 % (20/832).
For all response variables (Hypo, Defect, Multiple, and Severity), model support increased (lower AIC) when intraspecific factors (e.g., tooth loci, wear stage) were included. The final models contained three to five factors. Besides species and specimens, tooth type was in the final models of the variables Hypo (i.e., presence or absence of hypoplasia) and Defect (i.e., type of defect), and defect (converted to factor) in that of variables Multiple and Severity. Details and comparison of all models can be seen in Appendix 5. Based on final GLMMs, we found significant differences (Appendix 5; p-values < 0.05) in species vulnerability to stress: H. beonense had suffered significantly less hypoplasia than Pl. mirallesi (set as reference for GLMMs), and it was more through single LEH than any other types of defects (e.g., aplasia, combination of defects). The prevalence and defect type did not differ significantly between Pl. mirallesi and the two teleoceratines. Similarly, mean severity was not different in all species. Upper teeth appeared less affected by hypoplasia but neither the defect types nor the multiplicity were different (p-values > 0.05). We also found significant differences depending on dental loci: p4/P4 had a higher prevalence of hypoplasia than d2/D2, d3/D3, p2/P2, and p3/P3. The defect types also differ between p4/P4 and d2/D2 or m3/M3 (p-values < 0.05). More surprisingly, we found that right teeth display significantly different hypoplastic patterns and that lightly worn teeth were presenting less hypoplasia. Eventually, our results suggest that pits were less severe and less frequently multiple than LEH, but this result can be imputed to how pits were recorded in the first place (i.e., several pits identified as a single hypoplasia event) and their aetiology (less ameloblasts disrupted than for LEH or aplasia).
DISCUSSION
Impact of Sand Preparation on Microwear Signal
As suggested by Table 2 and Figure 5, Figure 6, Figure 7, the microwear signal is modified by sand blasting preparation. Before our study we had three hypotheses concerning the impact of sand blasting on the microwear signal observed: 1) no significant effect of sand blasting (null hypothesis), 2) generation of new features resulting in a different microwear signal, and 3) flattening of the surface and erasing of microwear features. Our results suggest a shift towards lower anisotropy and higher complexity values in all studied species, regardless of their diet. A decrease in anisotropy is likely to be explained by sand particles impacting randomly and erasing any eventual pre-existing preferential orientations, while an increase in complexity could be due to sand particles generating new features of various sizes and shapes primarily due to the wide range of angles of incidence while blasting sand. These results point towards our second hypothesis, with the apparition of a de novo microwear signal that may in turn bias microwear interpretation towards browsing or frugivory artificially. Sand blasting is a real issue for undertaking microwear studies a posteriori. Accordingly, not only this method should be used with care and parsimony for museum preparation of occlusal surfaces of fossil teeth, but it is also necessary to be particularly cautious when analyzing museum fossil specimens for microwear analyses.
Interest of GLMM
Generalized linear mixed-models are extremely powerful yet very complex tools in ecology. Their application and their interpretation require many precautions. Yet, the use of GLMMs is a good way to compare different methods and assess the impact of factors all at the same time. In our study, GLMMs revealed that the choice of the cusp for scoring mesowear was crucial in rhinocerotids as ScoreA and ScoreB yielded significantly different means depending on the cusp studied (sharpest cusp or paracone). This matter has already been emphasized in rhinocerotids (Taylor et al., 2013) as well as in equids (Taylor et al., 2016), probably due to the asymmetry of their teeth. This issue is apparently restricted to perissodactyls as no cusp differences are reported in ruminant taxa, for instance (Fortelius and Solounias, 2000; Ackermans et al., 2018). GLMMs also highlighted differences due to ontogeny for mesowear. This result was expected, and it has been discussed before (Fortelius and Solounias, 2000; Rivals et al., 2007). However, the present study is the first investigation of mesowear on rhinocerotid deciduous teeth to our knowledge. These deciduous teeth were probably reacting differently to wear than would permanent teeth. Indeed, the enamel layer is thinner in deciduous teeth, which might lead to a distinct wear pattern (i.e., faster and/or more marked wear). Interestingly, the confounding factors - such as tooth loci/position in microwear, or left/right tooth (side) in hypoplasia or mesowear - were absent of most final models. This absence suggests that these factors might not play a crucial role in the variations observed, meaning that the most variation observed is due to actual interspecific differences.
Despite all these interests, our models are not perfect. First, we chose to study certain interactions and not others to simplify the models, which may have oriented our final results. Secondly, we based our model selection on AIC but several other criteria exist, with different sensitivities. For instance, when all models tested were ordered by Bayesian information criterion (BIC), the best candidate model differed for several response variables (Mesowear: Ruler, ScoreB; Microwear: Anisotropy, FTfv, HAsfc9, HAsfc81; Hypoplasia: Hypo, Defect). For FTfv the best model selected by BIC was based on different factors, but for the other variables, inter-individual variation (1|Specimen) was the only factor present. This could be due to the risk of over-fitting when using AIC and under-fitting with BIC. However, some biological parameters might also be responsible for this prevalence of inter-individual variation. For mesowear variables (ScoreB and Ruler), as no species differences were highlighted in the models, individual variability might be the greatest variation observed. As, for hypoplasia variables (Hypo and Defect), this could indicate that vulnerability is more at the individual level rather than at a species level.
Which Mesowear Method is best for Rhinocerotids?
In this study, we tested three different mesowear methods on our rhinocerotid sample. No critical difference was observed between the three methods (Figure 8; Table 3), however each of them relies on different scoring systems with their own advantages and disadvantages. For instance, mesowear I (ScoreA) and extended mesowear I & II (ScoreB) are scored on the sharpest cusp, which is not fully applicable for rhinocerotid teeth as discussed in the previous section. This means that these methods may not be the most adapted to study mesowear for representatives of this clade or that they should be applied to the paracone, which in turn would impede comparison to other studies. Moreover, the very large scale (1-17) used in extended mesowear (ScoreB) is probably a source of intra- and inter-observer errors, instead of providing a finer discrimination between dietary preferences. Thus, we would recommend the use of Mesowear II - Mesowear Ruler (Ruler) to study mesowear on rhinocerotid teeth, especially since it has been specifically designed on equids (Mihlbachler et al. 2011), which are more closely related to rhinocerotids than artiodactyl ruminants.
Dietary Preferences
The dietary preferences of four associated rhinocerotid species from Béon 1 were investigated at two timescales: a short (days-to-weeks) scale with microwear, and a longer more cumulative, over-life scale, with mesowear. Previous work, based on gross dental and postcranial morphology, proposed a habitat partitioning for these rhinocerotids - swamps for the teleoceratines B. brachypus and Pr. douvillei, open woodland for the stem rhinocerotine Pl. mirallesi, and savannah-like open environments for the early-diverging elasmotheriine H. beonense (Antoine and Duranthon, 1997; Antoine et al., 2000; Bentaleb et al., 2006) - so we were expecting to find dietary differences.
Concerning mesowear, no significant differences were found between the four rhinocerotid species in any methods (ScoreA, ScoreB, and Ruler). The mesowear score profiles were different (Figure 8). In mesowear, leaf browsers have the lowest scores and grazers the highest, while mixed feeders and fruit browsers have intermediate overlapping scores. At Béon 1, all species had relatively low mean mesowear scores for all methods (ScoreA: 6.5-7; ScoreB: 0.7-1; Ruler: 1.2-2), excluding grazing as a dietary preference. Only B. brachypus had higher mean mesowear scores, which could suggest mixed-feeding, but as mesowear could be assessed on two teeth only, this remains an assumption. Accordingly, this species will not be further discussed. For the other associated species, ScoreB and Ruler suggest leaf browsing or mixed-feeding (Figure 8). Differences between deciduous and permanent teeth mesowear are highlighted with Ruler for all species and for Pl. mirallesi only with ScoreB (Table 3). Permanent teeth display higher mesowear score than deciduous teeth, which might indicate a resource partitioning between the youngsters (weaned juveniles and subadults) and the adults. A less abrasive diet seems to be adopted by youngsters still possessing milk teeth, which might help to avoid competition with adults and to preserve deciduous teeth from excessive wear. ScoreA points toward a more abrasive diet than ScoreB and Ruler, but still coherent with browsing or mixed-feeding (Figure 8). Previous studies reported mesowear scores for extant rhinoceroses using different approaches (Fortelius and Solounias, 2000; Taylor et al., 2013; Mihlbachler et al., 2018; Rivals et al., 2020). The mean values reported by Rivals et al. (2020) for extant rhinos using Ruler are under 0.5 for all extant species but C. simum (4.67). Such values are very different from those observed at Béon 1 (between 1 and 2 for Pl. mirallesi, Pr. douvillei, and H. beonense), which could mean that modern rhinoceroses are not strict dietary analogues of the most abundant rhinocerotid species documented at Béon 1. However, the values reported in the study of Mihlbachler et al. (2018) were more contrasted, with mean mesowear scores around 2 for Asiatic browsing rhinoceroses (Javan + Sumatran rhinos), 3 for the Indian rhino, 4 for the black rhino, and 6 for the grazing white rhino. With these scores, Béon 1 rhinos appear closed to the Asiatic browsing rhinoceroses, known to live in close dense forest and relying mostly on leaf-browsing (Kahlke et al., 2011; Hullot et al., 2019).
Concerning microwear, the patterns observed can be summed up as in Table 6. Although there is a little overlap in microwear signals that could be due to sampling sites (see the discussion of Mihlbachler et al. 2016 for 2D microwear), we found subtle variations in the textures suggesting different feeding behaviors among the four rhinocerotid species. The relatively low values of Asfc for all species on both facets exclude the consumption of hard items, such as seeds, branches, or fruits with stone. This finding is consistent with the relatively open environment proposed from Montréal-du-Gers (oxbow lake surrounded by savannah and open woodlands; Duranthon et al., 1999; Hullot and Antoine, 2020). For the teleoceratines, the higher mean values of HAsfc for B. brachypus indicate that this species might have included more variety to its diet (Scott et al., 2006) compared to Pr. douvillei. The anisotropy and textural fill volume were lower in B. brachypus than in Pr. douvillei, which confirms that the investigated specimens of these closely related species had different dietary preferences. The microwear signature of Pl. mirallesi (Table 2) is suggestive of an abrasive and homogeneous diet especially on the shearing facet. This pattern is similar to what is observed in extant strict grazers such as the white rhinoceros or in strict selective folivores like the Sumatran rhinoceros (Scott, 2012; Hullot et al., 2019). Given the low-crowned dental pattern similar to that of D. sumatrensis, selective folivory seems to be more likely than strict grazing as a diet for Pl. mirallesi. Eventually, H. beonense exhibits moderate values of all parameters suggestive of a relative flexibility in the diet and probably of a mixed-feeding behavior (as inferred in early mesodont equids; Mihlbachler et al., 2011).
With all the previous results discussed in mind, we tried to provide feeding ecologies for Béon 1 rhinocerotids. Overall, microwear and mesowear concur, suggesting browsing or mixed-feeding diets. This congruence is especially verified for the two teleoceratines: Pr. douvillei appears to be a browser probably favoring leaves and B. brachypus has more variable feeding preferences that could suggest mixed-feeding. A browsing diet on low vegetation is compatible with B. brachypus morphology but dental wear suggests a mixed-feeding diet as proposed by Becker and Tissier (2020). The use of microwear and mesowear in tandem helped to reveal a subtle niche partitioning of the two teleoceratines through feeding ecology. This finding is consistent with the slight differences in the δ18O of their teeth reported in a previous study (Bentaleb et al., 2006). Concerning Pl. mirallesi the microwear pattern pointed towards relatively abrasive and homogeneous food items, which is not retrieved in the mesowear score. This uncoupling, as well as low-crowned teeth, tends to exclude a grazing behavior and could suggest selective folivory similarly to what is observed in modern Sumatran rhinoceros instead. Eventually, H. beonense appears as a browser or a mixed-feeder with both proxies. This last result is quite surprising as Elasmotheriinae, to which H. beonense belongs, were in general hypothesized to have grazed on gramineous and abrasive plants from open environments (Inigo and Cerdeño, 1997; Cerdeño, 1998; Antoine, 2002; Becker and Tissier, 2020), due to their specialized morphology (i.e., high-crowned teeth with cement). However, hypsodonty does not necessarily imply obligate grazing and may instead allow for a wider range of dietary preferences, which is a key selective advantage (Janis, 1988; Semprebon and Rivals, 2007; Merceron et al., 2016).
Enamel Hypoplasia
The prevalence of hypoplasia affecting the rhinocerotids at Béon 1 is quite high, and comparable to what was observed in a Late Pleistocene woolly rhino sample (Coelodonta antiquitatis) from Fouvent-Sainte-Andoche, for which harsh cold conditions are reconstructed (France; Fourvel et al., 2015). There are, however, major differences depending on the species, tooth, or type of hypoplasia considered, as reported for tapirs and rhinoceroses found in association at Coc Muoi, a late Middle Pleistocene locality of Southeast Asia (Bacon et al., 2018). All prevalence values discussed in this paper must be nuanced in the light of species/tooth abundance and as some events might have been counted several times (defect on both opposing teeth from the same individual), because every isolated tooth was considered for counting. We found that deciduous teeth were less affected than permanent teeth. This has been reported in several other studies focusing on various mammals (Dobney and Ervynck, 1998; Lukacs, 1999; Bacon et al., 2018; Towle and Irish, 2019; McGrath et al., 2021), and several factors might explain this difference. First, in rhinocerotids, deciduous teeth develop partially (d1/D1 and d4/D4) or totally (d2/D2 and d3/D3) in utero, which provides a relatively stable environment (Hitchins, 1978; Hillman-Smith et al., 1986; Böhmer et al., 2016). Such a stable environment might play a buffer role limiting stress, thus avoiding the formation of enamel hypoplasia on such dental loci. Also, deciduous teeth develop faster than their permanent counterparts (Dobney and Ervynck, 1998). This faster growth leaves less time to suffer from stress and record hypoplasia. Other factors were found to have an influence in the prevalence of hypoplasia observed but were difficult to explain. For instance, upper teeth present less enamel defects than their lower counterparts, whereas they have similar developmental timings, a pattern also observed in deciduous canines of great apes (Lukacs, 1999), but the underlying mechanisms of which has not been elucidated thus far. The higher frequency of hypoplastic right teeth with respect to their left counterparts might be due to a sampling bias as isolated teeth represent a great part of our sample.
Besides sampling biases, the marked interspecific differences in terms of prevalence could be due to specific sensibilities, distinct habitats, different preferred diet and flexibility, and/or contrasting life trajectories. Both species of teleoceratines exhibit similar levels of hypoplasia on their permanent teeth (Pr. douvillei: 27.27 %; B. brachypus: 26.67 %), out of which LEH is about as abundant in both species (Pr. douvillei: 13.64 %, B. brachypus: 11.11 %; Table 5). Such similarities are consistent with a comparable sensitivity to stress, perhaps linked to the phylogenetic closeness of these species. Moreover, as these two rhinocerotids were probably inhabiting the same habitat but presenting different feeding preferences (as highlighted here), we can hypothesize that environment, besides food resource, might be responsible for the observed stress. Indeed, previous works linked LEH with environmental stresses, such as drought or seasonal lack of food, in various mammals (Chollet and Teaford, 2010; Skinner and Pruetz, 2012; Upex and Dobney, 2012). Periodic droughts are known to have happened at Béon 1 (Duranthon et al., 1999; Hullot and Antoine, 2020), and these events might have affected particularly the teleoceratines that would have relied on water. Interestingly, the rhino with the least dietary flexibility had the highest hypoplasia prevalence (Pl. mirallesi; 28.82 %), whilst the most flexible (H. beonense, mixed feeder) had the lowest hypoplasia prevalence (13.04 %). The high-crowned teeth with cement of H. beonense might have allowed this species to consume a wider range of resources and avoid nutritional stress. On the contrary, the selective Pl. mirallesi, which probably relied on low quality food (fibrous and abrasive), would have been more prone to dietary stresses.
As stated in the results section, the most affected loci were p4 (48.15 %), m3 (46.81 %), D4 (46.15 %), and d4 (40 %). In Teleoceras, another Miocene rhinoceros, hypoplasias recorded on d4/D4 have been linked to birth related stresses, while that occurring on p4/P4 were related to cow-calf separation/weaning (Mead, 1999). These hypotheses are consistent with the mortality curves of Béon 1 rhinocerotids established by Hullot and Antoine (2020), that highlighted birth and weaning as vulnerability periods. At the Pleistocene site of Taubach (Germany), Bratlund (1999) suggests malnutrition or disease causing a fever to explain the nine hypoplasia defects detected on the permanent teeth (P2-M2) of Stephanorhinus hemitoechus. Concerning m3, it is the last tooth to develop and erupt. Hypoplasia on the last molars has been correlated with seasonality in sheep (Upex and Dobney, 2012) and fossil giraffe (Franz-Odendaal et al., 2004). The most affected loci are variable depending on the species (Figure 9). This suggests that the different species have distinct sensitivities to stress and are affected at various periods of their life. For Pl. mirallesi and Pr. douvillei we retrieved some vulnerability periods of their mortality curves (Hullot and Antoine, 2020): birth (d4/D4, m1/M1 and second and third premolars) and weaning (p4/P4). The last two molars are also frequently hypoplastic, suggesting that these rhinos experienced environmental stresses. Very few loci are affected for B. brachypus and H. beonense but they imply similar causes: stresses around birth (D4, m1/M1) and environmental stresses (m3, M2). It would be interesting to investigate the prevalence of hypoplasia in other taxa from Béon 1 to confirm the role of environment as a stressor and to compare sensitivity across more distant species, like what has been done for the Pliocene herbivores of Langebaanweg (South Africa; Franz-Odendaal et al., 2004).
CONCLUSIONS
In this study we reconstructed some ecological aspects of four rhinocerotid species from the late early Miocene locality of Béon 1 (Montréal-du-Gers, France). While mesowear did not discriminate between the species and suggested browsing habits, microwear (DMTA) revealed subtle dietary preferences: Pl. mirallesi and Pr. douvillei were browsers probably favoring leaves, while B. brachypus and H. beonense were mixed-feeders. The prevalence of hypoplasia was overall high (> 25 % of the teeth affected), although it was contrasted depending on species, tooth locus, and type of defect considered. This suggested a rather stressful environment, which is coherent with the periodical droughts that occurred at Béon 1. Interestingly, the rhinocerotid with the most flexible diet (H. beonense) was the least affected by hypoplasia. We also discussed three methodological points here: the impact of sand-preparation on microwear signatures (lower anisotropy and higher complexity), the interests and limits of Generalized Linear Mixed Models (powerful but complex tool), and the choice of mesowear approach for rhinocerotids (Mesowear II - Mesowear Ruler seems the most suitable).
ACKNOWLEDGEMENTS
This research has been partly funded by the foundation Yves Coppens (excavation at Béon 1) and a “Bourse de Mobilité Doctorale” granted by the Association Française des Femmes Diplômées des Universités.
We are indebted to F. Duranthon and P. Dalous (Muséum de Toulouse) who granted us the access to study the rhinocerotids from Béon 1. For the extant dataset we are grateful to S. Jiquel, B. Marandat, and A.-L. Charruault (University of Montpellier), D. Berthet and F. Vigouroux (Musée des Confluences de Lyon), F. Zachos and A. Bibl (Natuhistorisches Museum Wien), J. Lesur and V. Bouetel (Muséum National d’Histoire Naturelle, Paris), M. Lowe (University Museum of Zoology of Cambrige), E. Gilissen (Musée Royal d’Afrique Centrale, Tervuren), and L. Costeur (Natuhistorisches Museum Basel). We thank both reviewers, F. Rivals and M. Mihlbachler, for their constructive feedback that greatly improved an earlier version of the manuscript.
REFERENCES
Ackermans, N.L. 2020. The history of mesowear: a review. PeerJ, 8. https://doi.org/10.7717/peerj.8519
Ackermans, N.L., Winkler, D.E., Schulz-Kornas, E., Kaiser, T.M., Müller, D.W., Kircher, P.R., Hummel, J., Clauss, M., and Hatt, J.-M. 2018. Controlled feeding experiments with diets of different abrasiveness reveal slow development of mesowear signal in goats (Capra aegagrus hircus). Journal of Experimental Biology, 221:jeb186411.
https://doi.org/10.1242/jeb.186411
Ackermans, N.L., Martin, L.F., Codron, D., Hummel, J., Kircher, P.R., Richter, H., Kaiser, T.M., Clauss, M., and Hatt, J.-M. 2020. Mesowear represents a lifetime signal in sheep (Ovis aries) within a long-term feeding experiment. Palaeogeography, Palaeoclimatology, Palaeoecology, 553:109793. https://doi.org/10.1016/j.palaeo.2020.109793
Antoine, P.-O. 2002. Phylogénie et évolution des Elasmotheriina (Mammalia, Rhinocerotidae). Mémoires du Muséum National d’Histoire naturelle, 188:1-359.
Antoine, P.-O. and Duranthon, F. 1997. Découverte de Protaceratherium minutum (Mammalia, Rhinocerotidae) dans le gisement Orléanien (MN 4) de Montréal-du-Gers (Gers). Annales de Paléontologie (Vert.-Invert.), 83:201-213.
Antoine, P.-O., Bulot, C., and Ginsburg, L. 2000. Les rhinocérotidés (Mammalia, Perissodactyla) de l’Orléanien des bassins de la Garonne et de la Loire (France): intérêt biostratigraphique. Comptes Rendus de l’Académie des Sciences - Series IIA - Earth and Planetary Science, 330:571-576. https://doi.org/10.1016/S1251-8050(00)00174-9
Antoine, P.-O., Becker, D., Laurent, Y., and Duranthon, F. 2018. The Early Miocene teleoceratine Prosantorhinus aff. douvillei (Mammalia, Perissodactyla, Rhinocerotidae) from Béon 2, Southwestern France. Revue de Paléobiologie, 37:367-377.
Arman, S.D., Prowse, T.A.A., Couzens, A.M.C., Ungar, P.S., and Prideaux, G.J. 2019. Incorporating intraspecific variation into dental microwear texture analysis. Journal of the Royal Society Interface, 16:20180957. https://doi.org/10.1098/rsif.2018.0957
Auguie, B. 2017. gridExtra: Miscellaneous Functions for “Grid” Graphics. R package version 2.3. https://CRAN.R-project.org/package=gridExtra
Bacon, A.-M., Antoine, P.-O., Huong, N.T.M., Westaway, K., Tuan, N.A., Duringer, P., Zhao, J., Ponche, J.-L., Dung, S.C., Nghia, T.H., Minh, T.T., Son, P.T., Boyon, M., Thuy, N.T.K., Blin, A., and Demeter, F. 2018. A rhinocerotid-dominated megafauna at the MIS6-5 transition: The late Middle Pleistocene Coc Muoi assemblage, Lang Son province, Vietnam. Quaternary Science Reviews, 186:123-141. https://doi.org/10.1016/j.quascirev.2018.02.017
Bates, D., Mächler, M., Bolker, B., and Walker, S. 2015. Fitting linear mixed-effects models using lme4. Journal of Statistical Software, 67:1-48. https://doi.org/10.18637/jss.v067.i01
Becker, D. and Tissier, J. 2020. Rhinocerotidae from the early middle Miocene locality Gračanica (Bugojno Basin, Bosnia-Herzegovina). Palaeobiodiversity and Palaeoenvironments, 100:395-412. https://doi.org/10.1007/s12549-018-0352-1
Bentaleb, I., Langlois, C., Martin, C., Iacumin, P., Carré, M., Antoine, P.-O., Duranthon, F., Moussa, I., Jaeger, J.-J., and Barrett, N. 2006. Rhinocerotid tooth enamel 18O/16O variability between 23 and 12 Ma in southwestern France. Comptes Rendus Geoscience, 338:172-179. https://doi.org/10.1016/j.crte.2005.11.007
Berlioz, É., Kostopoulos, D.S., Blondel, C., and Merceron, G. 2018. Feeding ecology of Eucladoceros ctenoides as a proxy to track regional environmental variations in Europe during the early Pleistocene. Comptes Rendus Palevol, 17:320-332. https://doi.org/10.1016/j.crpv.2017.07.002
Böhmer, C., Heissig, K., and Rössner, G.E. 2016. Dental eruption series and replacement pattern in Miocene Prosantorhinus (Rhinocerotidae) as revealed by macroscopy and x-ray: Implications for ontogeny and mortality profile. Journal of Mammalian Evolution, 23:265-279. https://doi.org/10.1007/s10914-015-9313-x
Bratlund, B. 1999. Taubach revisited. Jahrbuch des Römisch-Germanischen Zentralmuseums Mainz, 46:61-174. https://doi.org/10.11588/jrgzm.1999.1.25776
Calandra, I., Göhlich, U.B., and Merceron, G. 2008. How could sympatric megaherbivores coexist? Example of niche partitioning within a proboscidean community from the Miocene of Europe. Naturwissenschaften, 95:831-838. https://doi.org/10.1007/s00114-008-0391-y
Cerdeño, E. 1998. Diversity and evolutionary trends of the Family Rhinocerotidae (Perissodactyla). Palaeogeography, Palaeoclimatology, Palaeoecology, 141:13-34. https://doi.org/10.1016/S0031-0182(98)00003-0
Chollet, M.B. and Teaford, M.F. 2010. Ecological stress and linear enamel hypoplasia in Cebus. American Journal of Physical Anthropology, 142:1-6. https://doi.org/10.1002/ajpa.21182
Crouzel, F., Duranthon, F., and Ginsburg, L. 1988. Découverte d’un riche gisement à petits et grands mammifères d’âge Orléanien dans le département du Gers (France). Comptes rendus de l’Académie des Sciences, 307:101-104.
Davis, M. and Pineda-Munoz, S. 2016. The temporal scale of diet and dietary proxies. Ecology and Evolution, 6:1883-1897. https://doi.org/10.1002/ece3.2054
Dobney, K. and Ervynck, A. 1998. A protocol for recording linear enamel hypoplasia on archaeological pig teeth. International Journal of Osteoarchaeology, 8:263-273. https://doi.org/10.1002/(SICI)1099-1212(199807/08)8:4<263::AID-OA427>3.0.CO;2-P
Duranthon, F., Sola, S.M., Astibia, H., and Köhler, M. 1995. Ampelomeryx ginsburgi nov. gen., nov. sp. (Artiodactyla, Cervoidea) et la famille de Palaeomerycidae. Comptes rendus de l’Académie des Sciences, 321:339-346.
Duranthon, F., Antoine, P.O., Bulot, C., and Capdeville, J.P. 1999. Le Miocène inférieur et moyen continental du bassin d’Aquitaine Livret-guide de l’excursion des Journées Crouzel (10 et 11 juillet 1999). Bulletin de la Société d’histoire naturelle de Toulouse, 135:79-91.
Fédération Dentaire Internationale. 1982. An epidemiological index of development defects of dental enamel (DDE index). International Dental Journal, 42:411-426.
Fortelius, M. and Solounias, N. 2000. Functional characterization of ungulate molars using the abrasion-attrition wear gradient: a new method for reconstructing paleodiets. American Museum Novitates, 2000:1-36.
Fourvel, J.-B., Fosse, P., Fernandez, P., and Antoine, P.-O. 2015. Large mammals of Fouvent-Saint-Andoche (Haute-Saône, France): a glimpse into a Late Pleistocene hyena den. Geodiversitas, 37:237-266. https://doi.org/10.5252/g2015n2a5
Franz-Odendaal, T., Chinsamy, A., and Lee-Thorp, J. 2004. High prevalence of enamel hypoplasia in an early Pliocene giraffid (Sivatherium hendeyi) from South Africa. Journal of Vertebrate Paleontology, 24:235-244. https://doi.org/10.1671/19
Grine, F.E. 1986. Dental evidence for dietary differences in Australopithecus and Paranthropus: a quantitative analysis of permanent molar microwear. Journal of Human Evolution, 15:783-822.
Guatelli-Steinberg, D. 2001. What can developmental defects of enamel reveal about physiological stress in nonhuman primates? Evolutionary Anthropology: Issues, News, and Reviews, 10:138-151. https://doi.org/10.1002/evan.1027
Hillman-Smith, A.K.K., Owen-Smith, N.R., Anderson, J.L., Hall-Martin, A.J., and Selaladi, J.P. 1986. Age estimation of the white rhinoceros (Ceratotherium simum). Journal of Zoology, 210:355-377.
Hitchins, P.M. 1978. Age determination of the black rhinoceros (Diceros bicornis Linn.) in Zululand. South African Journal of Wildlife Research, 8:71-80.
Hoffman, J.M., Fraser, D., and Clementz, M.T. 2015. Controlled feeding trials with ungulates: a new application of in vivo dental molding to assess the abrasive factors of microwear. The Journal of Experimental Biology, 218:1538-1547. https://doi.org/10.1242/jeb.118406
Hullot, M. and Antoine, P.-O. 2020. Mortality curves and population structures of late early Miocene Rhinocerotidae (Mammalia, Perissodactyla) remains from the Béon 1 locality of Montréal-du-Gers, France. Palaeogeography, Palaeoclimatology, Palaeoecology, 558:109938. https://doi.org/10.1016/j.palaeo.2020.109938
Hullot, M., Antoine, P.-O., Ballatore, M., and Merceron, G. 2019. Dental microwear textures and dietary preferences of extant rhinoceroses (Perissodactyla, Mammalia). Mammal Research, 64:397-409. https://doi.org/10.1007/s13364-019-00427-4
Inigo, C. and Cerdeño, E. 1997. The Hispanotherium matritense (Rhinocerotidae) from Córcoles (Guadalajara, Spain): Its contribution to the systematics of the Miocene Iranotheriina. Geobios, 30:243-266. https://doi.org/10.1016/S0016-6995(97)80232-X
Janis, C.M. 1988. An estimation of tooth volume and hypsodonty indices in ungulate mammals, and the correlation of these factors with dietary preferences. Mémoires du Museum National d’Histoire Naturelle, 53:367-387.
Jones, D.B. and DeSantis, L.R.G. 2017. Dietary ecology of ungulates from the La Brea tar pits in southern California: A multi-proxy approach. Palaeogeography, Palaeoclimatology, Palaeoecology, 466:110-127. https://doi.org/10.1016/j.palaeo.2016.11.019
Kahlke, R.-D., García, N., Kostopoulos, D.S., Lacombat, F., Lister, A.M., Mazza, P.P., Spassov, N., and Titov, V.V. 2011. Western Palaearctic palaeoenvironmental conditions during the Early and early Middle Pleistocene inferred from large mammal communities, and implications for hominin dispersal in Europe. Quaternary Science Reviews, 30:1368-1395. https://doi.org/10.1016/j.quascirev.2010.07.020
Lukacs, J.R. 1999. Enamel hypoplasia in deciduous teeth of great apes: Do differences in defect prevalence imply differential levels of physiological stress? American Journal of Physical Anthropology, 110:351-363.
https://doi.org/10.1002/(SICI)1096-8644(199911)110:3<351::AID-AJPA7>3.0.CO;2-2
McGrath, K., Limmer, L.S., Lockey, A.-L., Guatelli-Steinberg, D., Reid, D.J., Witzel, C., Bocaege, E., McFarlin, S.C., and El Zaatari, S. 2021. 3D enamel profilometry reveals faster growth but similar stress severity in Neanderthal versus Homo sapiens teeth. Scientific Reports, 11:522. https://doi.org/10.1038/s41598-020-80148-w
Mead, A.J. 1999. Enamel hypoplasia in Miocene rhinoceroses (Teleoceras) from Nebraska: evidence of severe physiological stress. Journal of Vertebrate Paleontology, 19:391-397. https://doi.org/10.1080/02724634.1999.10011150
Merceron, G., Ramdarshan, A., Blondel, C., Boisserie, J.-R., Brunetiere, N., Francisco, A., Gautier, D., Milhet, X., Novello, A., and Pret, D. 2016. Untangling the environmental from the dietary: dust does not matter. Proceedings of the Royal Society B: Biological Sciences, 283:20161032. https://doi.org/10.1098/rspb.2016.1032
Merceron, G., Berlioz, E., Vonhof, H., Green, D., Garel, M., and Tütken, T. 2021. Tooth tales told by dental diet proxies: An alpine community of sympatric ruminants as a model to decipher the ecology of fossil fauna. Palaeogeography, Palaeoclimatology, Palaeoecology, 562:110077. https://doi.org/10.1016/j.palaeo.2020.110077
Mihlbachler, M.C., Rivals, F., Solounias, N., and Semprebon, G.M. 2011. Dietary change and evolution of horses in North America. Science, 331:1178-1181. https://doi.org/10.1126/science.1196166
Mihlbachler, M.C., Campbell, D., Ayoub, M., Chen, C., and Ghani, I. 2016. Comparative dental microwear of ruminant and perissodactyl molars: Implications for paleodietary analysis of rare and extinct ungulate clades. Paleobiology, 42:98-116.
https://doi.org/10.1017/pab.2015.33
Mihlbachler, M.C., Campbell, D., Chen, C., Ayoub, M., and Kaur, P. 2018. Microwear-mesowear congruence and mortality bias in rhinoceros mass-death assemblages. Paleobiology, 44:131-154. https://doi.org/10.1017/pab.2017.13
Niven, L.B., Egeland, C.P., and Todd, L.C. 2004. An inter-site comparison of enamel hypoplasia in bison: implications for paleoecology and modeling Late Plains Archaic subsistence. Journal of Archaeological Science, 31:1783-1794. https://doi.org/10.1016/j.jas.2004.06.001
Orliac, M.J. 2006. Eurolistriodon tenarezensis, sp. nov., from Montréal-du-Gers (France): implications for the systematics of the European Listriodontinae (Suidae, Mammalia). Journal of Vertebrate Paleontology, 26:967-980. https://doi.org/10.1671/0272-4634(2006)26[967:ETSNFM]2.0.CO;2
Orliac, M.J., Antoine, P.-O., and Duranthon, F. 2006. The Suoidea (Mammalia, Artiodactyla), exclusive of Listriodontinae, from the early Miocene of Béon 1 (Montréal-du-Gers, SW France, MN4). Geodiversitas, 28:685-718.
Owen-Smith, N.R. 1988. Megaherbivores: The Influence of Very Large Body Size on Ecology. Cambridge University Press.
Rage, J.-C. and Bailón, S. 2005. Amphibians and squamate reptiles from the late early Miocene (MN 4) of Béon 1 (Montréal-du-Gers, southwestern France). Geodiversitas, 27:413-441.
Ramdarshan, A., Blondel, C., Brunetière, N., Francisco, A., Gautier, D., Surault, J., and Merceron, G. 2016. Seeds, browse, and tooth wear: a sheep perspective. Ecology and Evolution, 6:5559-5569. https://doi.org/10.1002/ece3.2241
Rivals, F. and Semprebon, G.M. 2006. A comparison of the dietary habits of a large sample of the Pleistocene pronghorn Stockoceros onusrosagris from the Papago Springs Cave in Arizona to the modern Antilocapra americana. Journal of Vertebrate Paleontology, 26:495-500. https://doi.org/10.1671/0272-4634(2006)26[495:ACOTDH]2.0.CO;2
Rivals, F., Solounias, N., and Mihlbachler, M.C. 2007. Evidence for geographic variation in the diets of late Pleistocene and early Holocene Bison in North America, and differences from the diets of recent Bison. Quaternary Research, 68:338-346. https://doi.org/10.1016/j.yqres.2007.07.012
Rivals, F., Takatsuki, S., Albert, R.M., and Macià, L. 2014. Bamboo feeding and tooth wear of three sika deer (Cervus nippon) populations from northern Japan. Journal of Mammalogy, 95:1043-1053. https://doi.org/10.1644/14-MAMM-A-097
Rivals, F., Prilepskaya, N.E., Belyaev, R.I., and Pervushov, E.M. 2020. Dramatic change in the diet of a late Pleistocene Elasmotherium population during its last days of life: Implications for its catastrophic mortality in the Saratov region of Russia. Palaeogeography, Palaeoclimatology, Palaeoecology, 556:109898.
https://doi.org/10.1016/j.palaeo.2020.109898
Rothschild, B.M., Martin, L.D., Lev, G., Bercovier, H., Bar-Gal, G.K., Greenblatt, C., Donoghue, H., Spigelman, M., and Brittain, D. 2001. Mycobacterium tuberculosis complex DNA from an extinct bison dated 17,000 years before the present. Clinical Infectious Diseases, 33:305-311. https://doi.org/10.1086/321886
Schulz, E., Fahlke, J.M., Merceron, G., and Kaiser, T.M. 2007. Feeding ecology of the Chalicotheriidae (Mammalia, Perissodactyla, Ancylopoda). Results from dental micro-and mesowear analyses. Verhandlungen des Naturwissenschaftlichen Vereins zu Hamburg, 43:5-31.
Scott, J.R. 2012. Dental microwear texture analysis of extant African Bovidae. Mammalia, 76. https://doi.org/10.1515/mammalia-2011-0083
Scott, R.S., Ungar, P.S., Bergstrom, T.S., Brown, C.A., Grine, F.E., Teaford, M.F., and Walker, A. 2005. Dental microwear texture analysis shows within-species diet variability in fossil hominins. Nature, 436:693-695. https://doi.org/10.1038/nature03822
Scott, R.S., Ungar, P.S., Bergstrom, T.S., Brown, C.A., Childs, B.E., Teaford, M.F., and Walker, A. 2006. Dental microwear texture analysis: technical considerations. Journal of Human Evolution, 51:339-349. https://doi.org/10.1016/j.jhevol.2006.04.006
Semprebon, G.M. and Rivals, F. 2007. Was grass more prevalent in the pronghorn past? An assessment of the dietary adaptations of Miocene to Recent Antilocapridae (Mammalia: Artiodactyla). Palaeogeography, Palaeoclimatology, Palaeoecology, 253:332-347. https://doi.org/10.1016/j.palaeo.2007.06.006
Skinner, M.F. and Pruetz, J.D. 2012. Reconstruction of periodicity of repetitive linear enamel hypoplasia from perikymata counts on imbricational enamel among dry-adapted chimpanzees (Pan troglodytes verus) from Fongoli, Senegal. American Journal of Physical Anthropology, 149:468-482. https://doi.org/10.1002/ajpa.22145
Small, B.W. and Murray, J.J. 1978. Enamel opacities: prevalence, classifications and aetiological considerations. Journal of Dentistry, 6:33-42. https://doi.org/10.1016/0300-5712(78)90004-0
Solounias, N. and Semprebon, G. 2002. Advances in the reconstruction of ungulate ecomorphology with application to early fossil equids. American Museum Novitates, 3366:1-49. https://doi.org/10.1206/0003-0082(2002)366<0001:AITROU>2.0.CO;2
Solounias, N., Tariq, M., Hou, S., Danowitz, M., and Harrison, M. 2014. A new method of tooth mesowear and a test of it on domestic goats. Annales Zoologici Fennici, 51:111-118.
Suckling, G., Elliott, D.C., and Thurley, D.C. 1986. The macroscopic appearance and associated histological changes in the enamel organ of hypoplastic lesions of sheep incisor teeth resulting from induced parasitism. Archives of Oral Biology, 31:427-439. https://doi.org/10.1016/0003-9969(86)90016-6
Taylor, L.A., Kaiser, T.M., Schwitzer, C., Müller, D.W.H., Codron, D., Clauss, M., and Schulz, E. 2013. Detecting inter-cusp and inter-tooth wear patterns in Rhinocerotids. PLOS ONE, 8:e80921. https://doi.org/10.1371/journal.pone.0080921
Taylor, L.A., Müller, D.W., Schwitzer, C., Kaiser, T.M., Castell, J.C., Clauss, M., and Schulz-Kornas, E. 2016. Comparative analyses of tooth wear in free-ranging and captive wild equids. Equine Veterinary Journal, 48:240-245. https://doi.org/10.1111/evj.12408
Teaford, M.F. 1991. Dental microwear: what can it tell us about diet and dental function, p. 341-356. In Kelley, M. and Larsen, C. (eds.), Advances in Dental Anthropology. Wiley-Liss, New York.
Teaford, M.F. and Oyen, O.J. 1989. In vivo and in vitro turnover in dental microwear. American Journal of Physical Anthropology, 80:447-460. https://doi.org/10.1002/ajpa.1330800405
Towle, I. and Irish, J.D. 2019. A probable genetic origin for pitting enamel hypoplasia on the molars of Paranthropus robustus. Journal of Human Evolution, 129:54-61. https://doi.org/10.1016/j.jhevol.2019.01.002
Ungar, P.S., Brown, C.A., Bergstrom, T.S., and Walker, A. 2003. Quantification of dental microwear by tandem scanning confocal microscopy and scale-sensitive fractal analyses. Scanning, 25:185-193. https://doi.org/10.1002/sca.4950250405
Upex, B. and Dobney, K. 2012. Dental enamel hypoplasia as indicators of seasonal environmental and physiological impacts in modern sheep populations: a model for interpreting the zooarchaeological record. Journal of Zoology, 287:259-268. https://doi.org/10.1111/j.1469-7998.2012.00912.x
Venables, W.N. and Ripley, B.D. 2002. Modern Applied Statistics with S. Springer, New York.
Wickham, H. 2016. ggplot2: Elegant Graphics for Data Analysis. Springer-Verlag, New York.
Wilke, C.O. 2020. cowplot: Streamlined Plot Theme and Plot Annotations for “ggplot2”. R package version 1.1.0. https://CRAN.R-project.org/package=cowplot
Winkler, D.E. and Kaiser, T.M. 2011. A case study of seasonal, sexual and ontogenetic divergence in the feeding behaviour of the moose (Alces alces LINNÉ, 1758). Verhandlungen des naturwissenschaftlichen Vereins zu Hamburg, 46:331-348.
Winkler, D.E., Schulz-Kornas, E., Kaiser, T.M., Codron, D., Leichliter, J., Hummel, J., Martin, L.F., Clauss, M., and Tütken, T. 2020. The turnover of dental microwear texture: Testing the” last supper” effect in small mammals in a controlled feeding experiment. Palaeogeography, Palaeoclimatology, Palaeoecology, 557:109930.
https://doi.org/10.1016/j.palaeo.2020.109930
