

Article Search
Volume 27.1
January–April 2024
Full table of contents
ISSN: 1094-8074, web version;
1935-3952, print version
Recent Research Articles
See all articles in 27.1 January-April 2024
See all articles in 26.3 September-December 2023
See all articles in 26.2 May-August 2023
See all articles in 26.1 January-April 2023
APPENDIX 1. Video of CV 14 in lateral view. Sequence runs from the digital model of the original fossil to the SAM, MM, and back to the original model. Click on image to see video.
APPENDIX 2. Video of CV 14 in dorsal view. Sequence runs from the digital model of the original fossil to the SAM, MM, and back to the original model. Click on image to see video.
APPENDIX 3. Video of CV 14 in posterior view. Sequence runs from the digital model of the original fossil to the SAM, MM, and back to the original model. Click on image to see video.
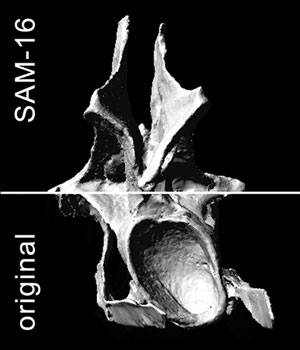
TABLE 1. Numerical characters used in phylogenetical analyses, with the corresponding ratios of the original vertebrae of the Kaatedocus siberi SMA 0004, the MM models, and the SAM models. Trends recovered by retrodeformation are compared to the Raphus cucullatus test, green indicates probable real trends for SMA 0004. Abb.: H112, character 112 of Harris (2006); U1, character 1 of Upchurch et al. (2004); W87, character 87 of Whitlock (2011).
|
Character |
Borders as set in character |
Vertebra |
Original |
Retrodeformed models |
Comparison with trends recovered in Dodo (CS) |
Comments |
||
|
MM |
SAM |
MM |
SAM |
|||||
|
H112 |
|
CV 3 |
1.29 |
1.59 |
1.38 |
= |
SMA 0004 ambiguous, retrodeformation enhances ambiguity, but is questioned by Dodo analysis |
|
|
CV 4 |
1.08 |
1.16 |
1.05 |
= |
≠ |
|||
|
CV 5 |
1.10 |
1.04 |
0.95 |
≠ |
||||
|
H114 (=W90) |
4 in Harris (2006), Whitlock (2011) leaves gap: 2.5-3, or 4+ as plesio- or apomorphic states, respectively |
CV 6 |
4.13 |
3.38 |
3.20 |
= |
Original ambiguous, retrodeformation shifts mid-cervicals into plesiomorphic state of H114, W90 only applicable with SAM models and original of CV 6, but SAM appears to give false trends according to Dodo analysis |
|
|
CV 7 |
3.66 |
3.81 |
2.81 |
≠ |
= |
|||
|
CV 8 |
3.31 |
3.02 |
2.68 |
= |
||||
|
CV 9 |
3.51 |
3.70 |
2.83 |
≠ |
= |
|||
|
CV 10 |
3.00 |
3.66 |
2.90 |
≠ |
= |
|||
|
H115 |
|
CV 6 |
1.38 |
1.42 |
1.35 |
= |
= |
Retrodeformation generally strengthens assignment of SMA 0004 to apomorphic state, although this seems to be the wrong trend, according to Dodo analysis. However, deformation would have to be very strong for SMA 0004 to fall within plesiomorphic state |
|
CV 7 |
1.29 |
1.45 |
1.50 |
= |
≠ |
|||
|
CV 8 |
1.23 |
1.34 |
1.28 |
= |
≠ |
|||
|
CV 9 |
1.38 |
1.41 |
1.45 |
= |
≠ |
|||
|
CV 10 |
1.32 |
1.44 |
1.18 |
= |
= |
|||
|
H118 (=W87) |
no explicit border in Harris (2006), but described to be around 1; Whitlock (2011) restricts character to anterior cervicals, but leaves gap: <1, or 1.5 as plesio-, or apomorphic states, respectively |
CV 3 |
0.68 |
0.60 |
0.71 |
≠ |
= |
Retrodeformation ambiguous in its trends in anterior and mid-cervicals, but shifts ratios of posterior cervicals towards upper end of plesiomorphic state of H118. However, this appears to be the wrong trend, according to the Dodo analysis. SMA 0004 can thus be safely scored as plesiomorphic |
|
CV 4 |
0.72 |
0.69 |
0.69 |
≠ |
||||
|
CV 5 |
0.61 |
0.55 |
0.58 |
≠ |
||||
|
CV 6 |
0.55 |
0.55 |
0.52 |
≠ |
||||
|
CV 7 |
0.60 |
0.48 |
0.59 |
≠ |
||||
|
CV 8 |
0.61 |
0.66 |
0.67 |
= |
||||
|
CV 9 |
0.67 |
0.59 |
0.66 |
≠ |
||||
|
CV 10 |
0.60 |
0.52 |
0.55 |
≠ |
||||
|
CV 11 |
0.67 |
0.73 |
0.78 |
= |
||||
|
CV 12 |
0.80 |
0.86 |
0.89 |
= |
||||
|
CV 13 |
0.84 |
0.89 |
0.96 |
= |
||||
|
CV 14 |
0.94 |
0.97 |
1.00 |
= |
||||
|
U1 |
|
CV 3 |
0.48 |
0.61 |
0.62 |
≠ |
No changes, weak trend to wider vertebrae through retrodeformation (especially when applying the SAM), which appears to be right according the the Dodo analysis |
|
|
CV 4 |
0.62 |
0.61 |
0.66 |
= |
≠ |
|||
|
CV 5 |
0.65 |
0.70 |
0.69 |
≠ |
||||
|
CV 6 |
0.64 |
0.78 |
0.70 |
≠ |
||||
|
CV 7 |
0.61 |
0.61 |
0.62 |
≠ |
||||
|
CV 8 |
0.76 |
0.75 |
0.82 |
= |
= |
|||
|
CV 9 |
0.68 |
0.71 |
0.75 |
≠ |
||||
|
CV 10 |
0.69 |
0.74 |
0.83 |
≠ |
||||
|
CV 11 |
0.62 |
0.62 |
0.69 |
≠ |
||||
|
CV 12 |
0.62 |
0.70 |
0.71 |
≠ |
||||
|
CV 13 |
0.73 |
0.77 |
0.79 |
≠ |
||||
|
CV 14 |
0.74 |
0.68 |
0.70 |
= |
||||
TABLE 2. Numerical characters used in phylogenetic analyses, with the corresponding ratios of the original vertebra of Raphus cucullatus, the deformed models, the MM models, and the SAM models. The closest fit with the original vertebra is marked with bold numbers. Differences between the deformed/retrodeformed models and the original are given in percent, with high deviations (>50%) marked in red, and low differences (<5%) in green. The similarity of the retrodeformed models with the original vertebra is given compared with the deviance of the deformed model (arrows pointing upwards indicate a closer fit between retrodeformed models and original vertebra, arrows pointing down show that the retrodeformation increased deformation even more; two arrows show higher (green) or lower (red) accuracy of the respective retrodeformation method compared with the other one). Abb.: H112, character 112 of Harris (2006); U1, character 1 of Upchurch et al. (2004); W87, character 87 of Whitlock (2011).
|
Character |
Character definitions |
Undeformed original |
Deformed models |
Retrodeformed models |
Difference from undeformed original (in percent) |
||||
|
MM |
SAM |
deformed |
MM |
SAM |
|||||
|
H112 |
Height/width posterior articular surface |
0.61 |
C |
1.27 |
1.30 |
1.28 |
210.20% |
215.09% |
211.25% |
|
S |
0.84 |
0.75 |
0.69 |
139.25% |
124.65% |
114.11% |
|||
|
CS |
1.16 |
1.18 |
1.18 |
190.85% |
194.52% |
195.19% |
|||
|
H114 (=W90) |
Centrum length/height of posterior articular surface |
2.00 |
C |
1.45 |
1.63 |
1.45 |
72.32% |
81.25% |
72.73% |
|
S |
2.09 |
2.33 |
2.38 |
104.65% |
116.67% |
119.23% |
|||
|
CS |
1.44 |
1.23 |
1.20 |
72.00% |
61.32% |
59.80% |
|||
|
H115 |
Height neural arch/height of posterior articular surface |
1.33 |
C |
1.36 |
1.18 |
1.29 |
102.48% |
88.91% |
97.38% |
|
S |
1.33 |
1.31 |
1.34 |
100.00% |
98.65% |
101.25% |
|||
|
CS |
1.42 |
1.43 |
1.40 |
107.35% |
108.18% |
105.90% |
|||
|
H118 (=W87) |
Total height/centrum length |
1.47 |
C |
1.76 |
1.47 |
1.75 |
119.57% |
100.18% |
119.06% |
|
S |
1.28 |
1.16 |
1.23 |
86.93% |
79.13% |
83.40% |
|||
|
CS |
2.05 |
2.22 |
2.37 |
139.52% |
151.18% |
160.92% |
|||
|
U1 |
Total width/total height |
1.31 |
C |
0.87 |
0.94 |
0.91 |
66.17% |
71.50% |
68.96% |
|
S |
1.38 |
1.49 |
1.57 |
104.97% |
113.84% |
119.73% |
|||
|
CS |
0.97 |
0.92 |
0.89 |
73.67% |
69.89% |
68.14% |
|||
TABLE 2 (continued).
|
Character |
Comments on character |
Retrodeformation trends |
Comments on retrodeformation |
|
|
MM |
SAM |
|||
|
H112 |
highly susceptible, should be deleted |
worse |
bad |
increases transverse compression even more, both MM and SAM indicate trend if shear only |
|
good |
better |
|||
|
bad |
bad |
|||
|
H114 (=W90) |
susceptible, use with care |
good |
– |
bad performance if shear involved, MM indicates trend if compression only |
|
bad |
worse |
|||
| bad |
worse |
|||
|
H115 |
relatively constant, can be used |
worse |
bad |
generally wrong, inverted trends, but on a low error level |
|
worse |
bad |
|||
|
bad |
better |
|||
|
H118 (=W87) |
especially susceptible if shear and compression combined, should be deleted in this case (or scored '?') |
better |
good |
bad performance if shear involved, MM indicates trend if compression only |
|
worse |
bad |
|||
|
bad |
worse |
|||
|
U1 |
susceptible, use with care |
better |
good |
bad performance if shear involved, MM indicates trend if compression only |
|
bad |
worse |
|||
|
bad |
worse | |||
TABLE 3. Support values of the performed phylogenetic analyses with and without the questionable characters (H112, H114 for Harris, 2006; W90 for Whitlock, 2011). Abb.: MPT, most parsimonious tree.
|
Phylogenetic analysis |
Tree length |
Number of MPTs |
Consistency index |
Retention index |
|
|
Harris (2006) |
with |
965 |
50 |
44 |
62 |
|
without |
899 |
6 |
47 |
66 |
|
|
Whitlock (2011) |
with |
354 |
1 |
70 |
83 |
|
without |
350 |
1 |
71 |
83b |
|
FIGURE 1. Posterior view of CV 12 showing brittle (arrow) and plastic deformation (lines; indicate the originally horizontal plane of postzygapophyses (above) and transverse processes (below)). Scale bar equals 5 cm.
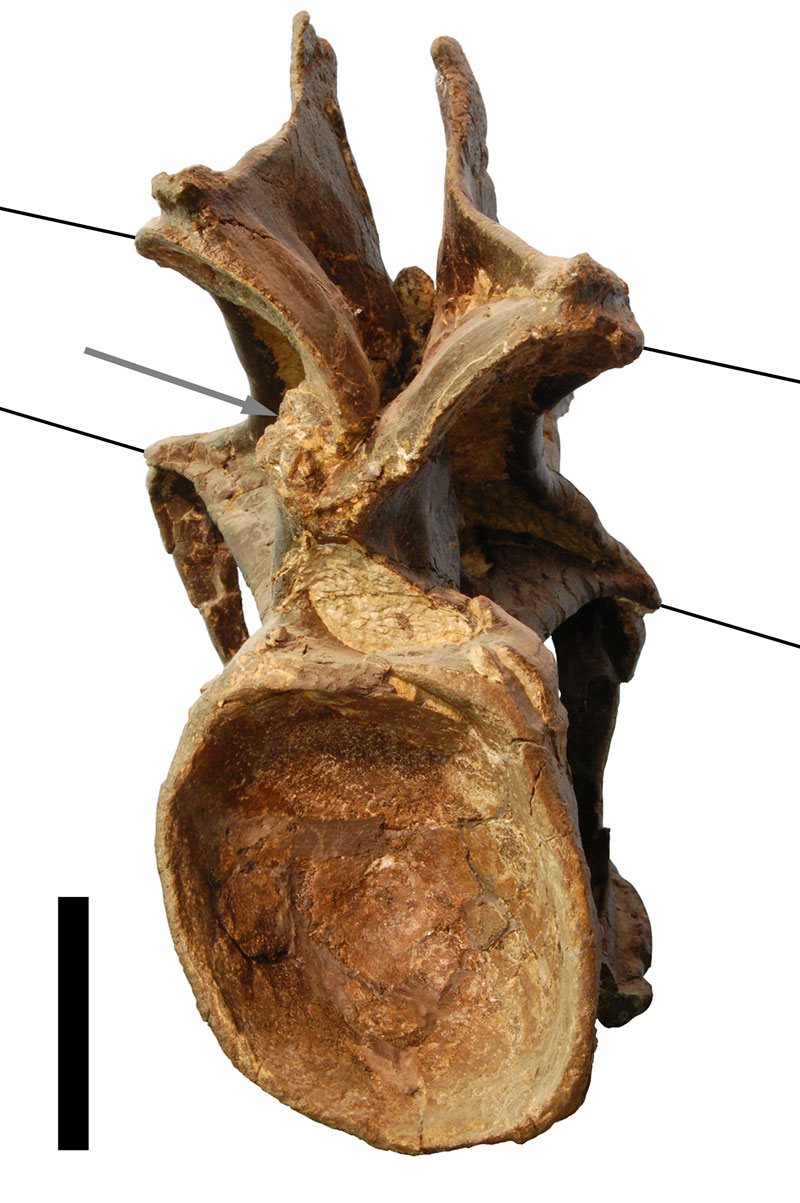
FIGURE 2. Landmarks used for the retrodeformation methods, shown in CV 10 in posterior, right lateral, and anterior view (from left to right). Only landmarks on right side are shown. The landmarks on the centrum are: 1) anteromedial corners of the parapophyses; 2) posterior ends of the parapophyses; 3) dorsolateral corner of the border of the cotyle, where the centropostzygapophyseal laminae converge with the centrum; 4) ventrolateral corner of the cotyle, where the posterolateral flanges of the ventral surface of the centrum merge with the border of the cotyle. The landmarks on the neural arch are: 5) anterior ends of prezygadiapophyseal laminae; 6) anterior-most points of prezygapophyses; 7) medial-most point of prezygapophyses; 8) medial sides of insertion of centroprezygapophyseal laminae into prezygapophyses; 9) posterolateral-most points of transverse processes; 10) anterior-most points of the neural spine summit; 11) small protrusions at the center of the neural spine summit; 12) posterior-most point of the neural spine summit; 13) posteromedial corners of postzygapophyses; 14) anterolateral corners of postzygapophyses; 15) posterior ends of spinopostzygapophyseal laminae. The landmark on the cervical rib is its anterior-most tip (16).
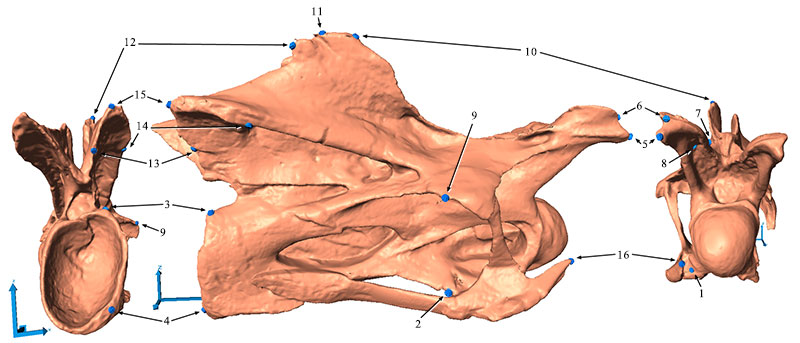
FIGURE 3. Shape changes after two retrodeformation steps in CV 12 in dorsal (A), anterior (B), and left lateral (C) view. The full shape marks the original deformed model, the outlines show the shape of the retrodeformed models (green: SAM, dark and light red: MM, two steps).
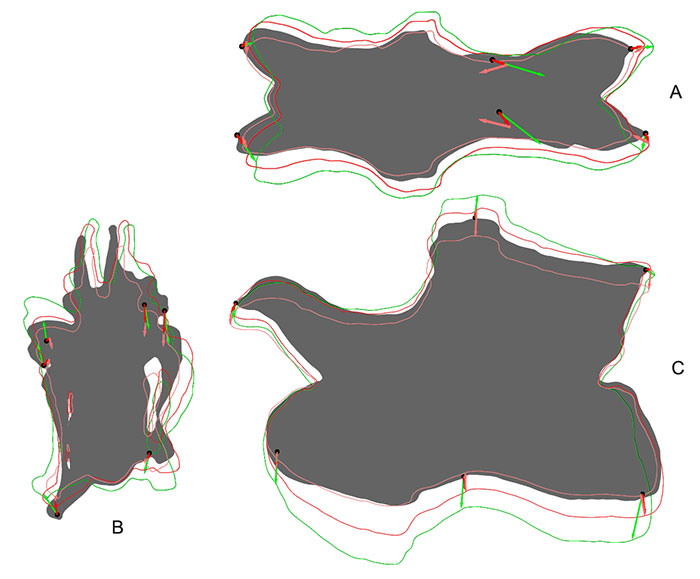
FIGURE 4. Outlines of different retrodeformed models of CV 12 obtained by using 4 (green), 9 (blue), or 16 (red) landmarks to define the midsagittal plane. A: results of the MM, B: results of the SAM.
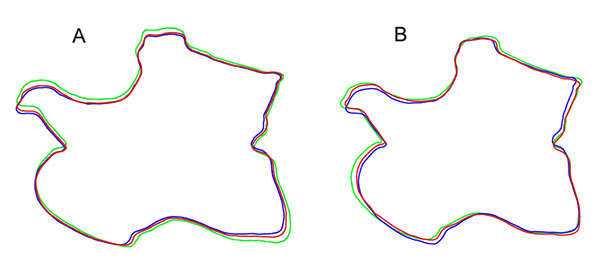
FIGURE 5. Original and retrodeformed models of CV 10 in dorsal (top left), anterior (bottom left), and lateral view (right). Note the elongation of the prezygapophysis in the retrodeformed models (arrow) and the slenderness of the model produced by the MM. Vertebrae not to scale.
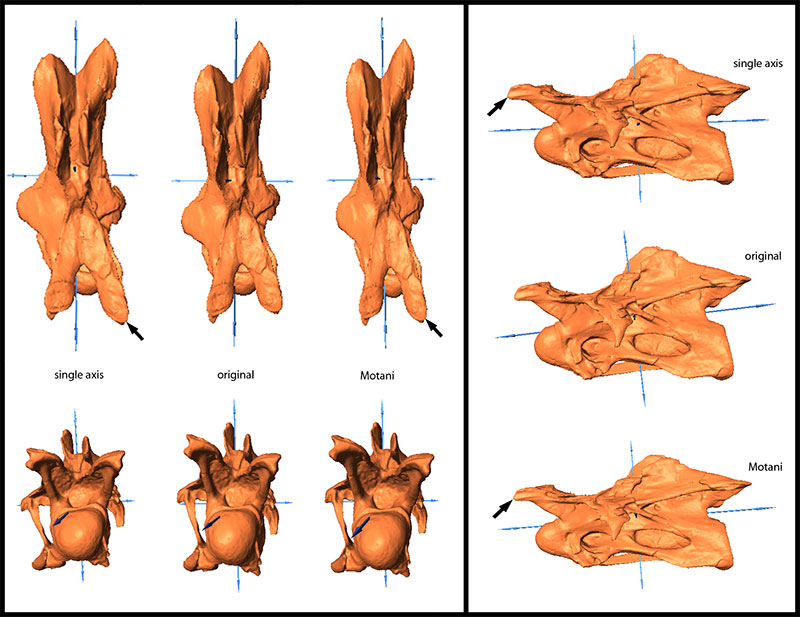
FIGURE 6. Original and retrodeformed models of CV 11 in dorsal (top left), anterior (bottom left), and lateral view (right). Note the levelling of the transverse processes in the retrodeformed models (arrows). Vertebrae not to scale.
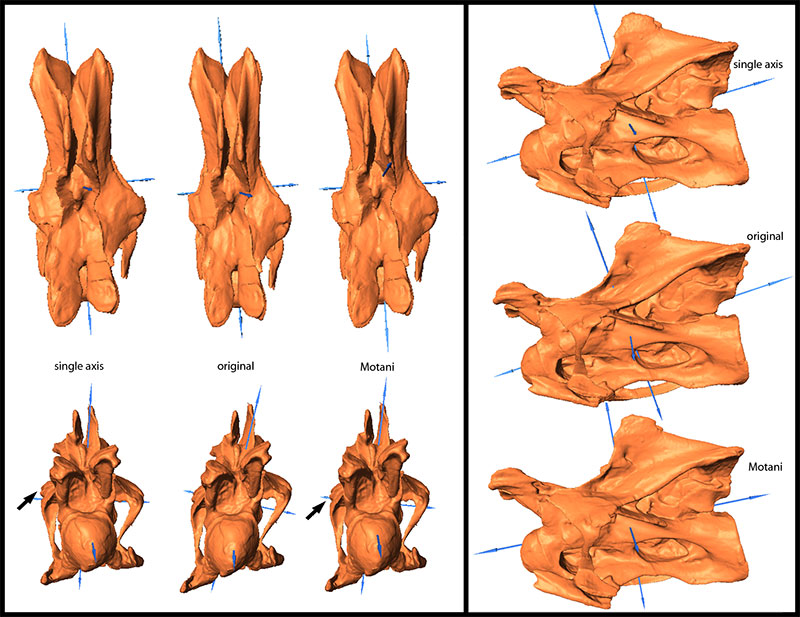
FIGURE 7. Original and retrodeformed models of CV 12 in dorsal (top left), anterior (bottom left), and lateral view (right). Note the more rounded condyles (arrows) and the pronounced robustness of the model produced by the SAM. Vertebrae not to scale.
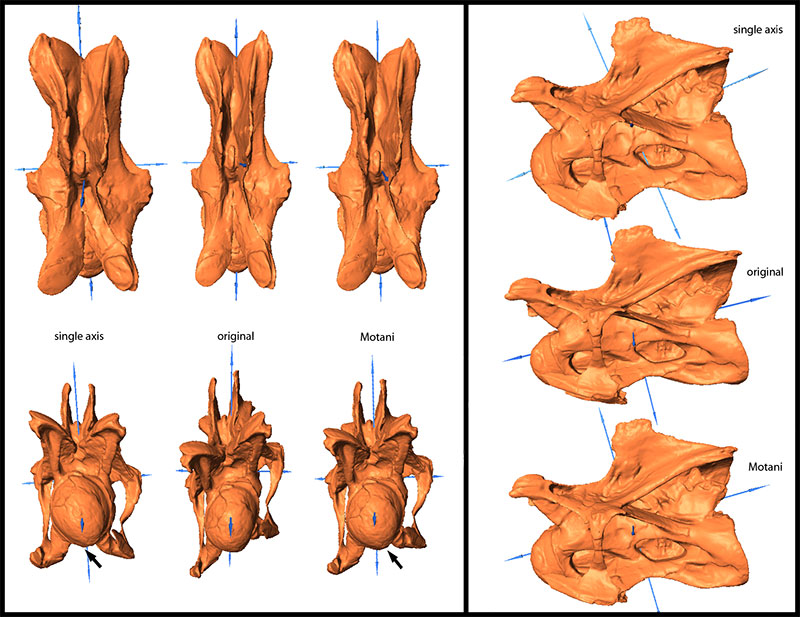
FIGURE 8. Original and retrodeformed models of CV 13 in dorsal (top left), anterior (bottom left), and lateral view (right). Note the more pronounced posteroventral corner in the SAM (arrow). Vertebrae not to scale.
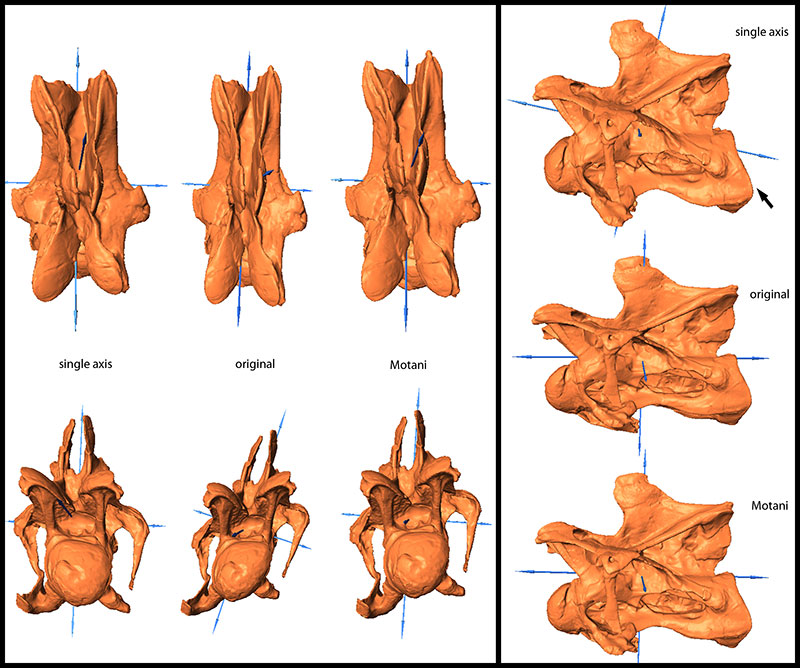
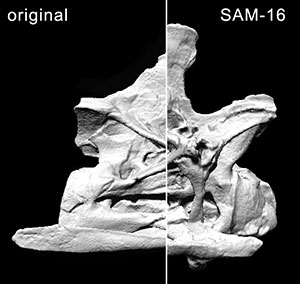
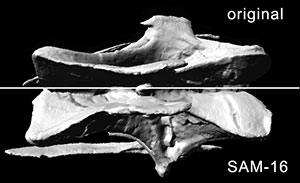
FIGURE 9. Original and retrodeformed models of CV 14 in dorsal (top left), anterior (bottom left), and lateral view (right). Note the retraction of the prezygapophyses in the retrodeformed models (arrows) and the robustness of the model produced by the SAM. Vertebrae not to scale.
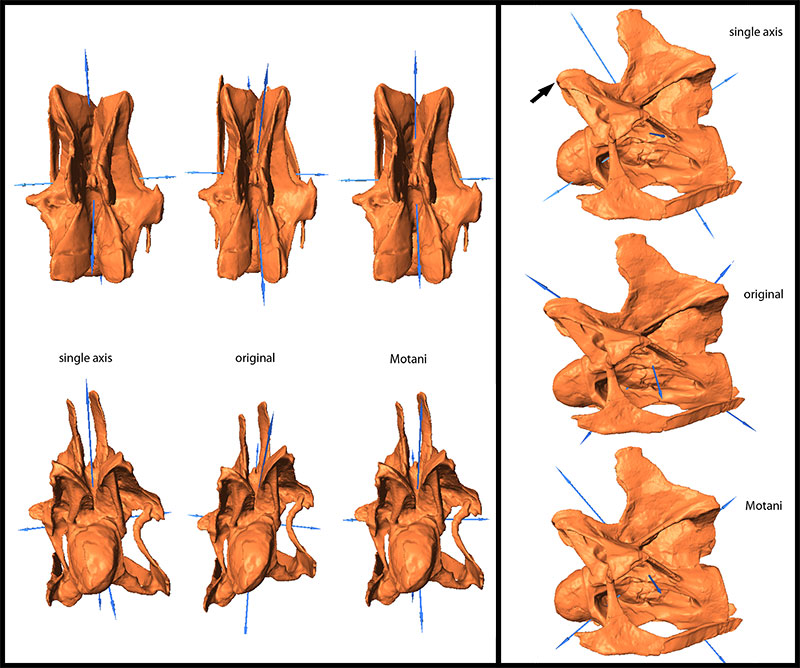
FIGURE 10. Original, deformed (using compression), and retrodeformed models of a cervical vertebra of Raphus cucullatus (DNSM Ornithology 2366) in anterior (top), right lateral (center), and dorsal (bottom) view. Note the transversely more compressed retrodeformed models compared to the deformed model.
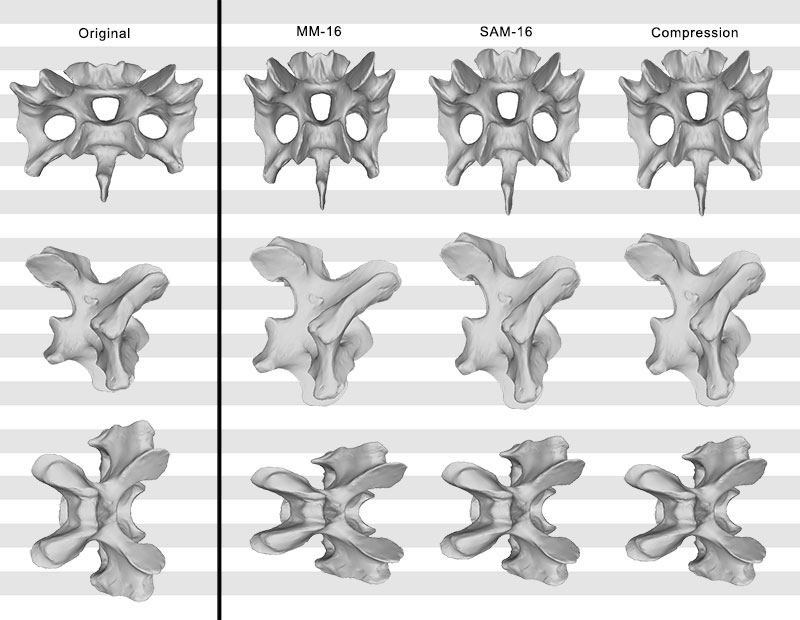
FIGURE 11. Original, deformed (using shear), and retrodeformed models of a cervical vertebra of Raphus cucullatus (DNSM Ornithology 2366) in anterior (top), right lateral (center), and dorsal (bottom) view. Note the dorsoventrally more compressed retrodeformed models compared to the deformed model.
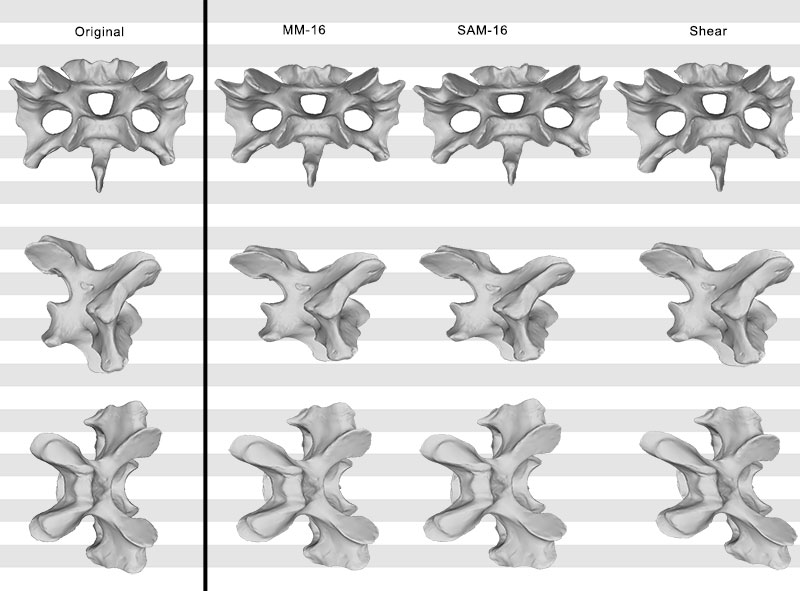
FIGURE 12. Original, deformed (compression and shear combined), and retrodeformed models of a cervical vertebra of Raphus cucullatus (DNSM Ornithology 2366) in anterior (top), right lateral (center), and dorsal (bottom) view. Note the dorsoventrally higher, and anteroposteriorly shorter retrodeformed models compared to the deformed model.
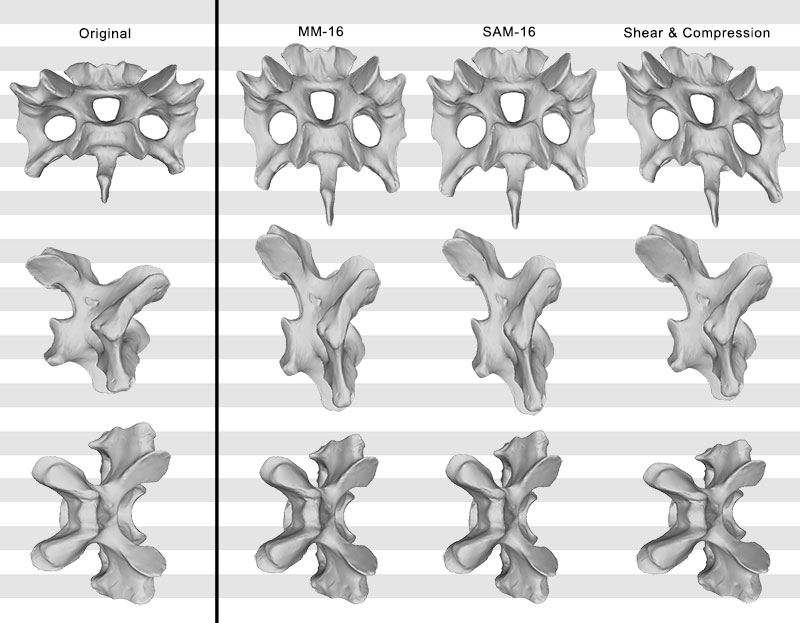
FIGURE 13. Phylogenetic trees (based on Harris, 2006) recovered with (left) and without (right) the questionable characters (H112 and H114). Bootstrap values indicated if > 50. Note the better resolved tree without the questionable characters. Bootstrap values in the right tree are higher for high-level, but lower for low-level taxa.
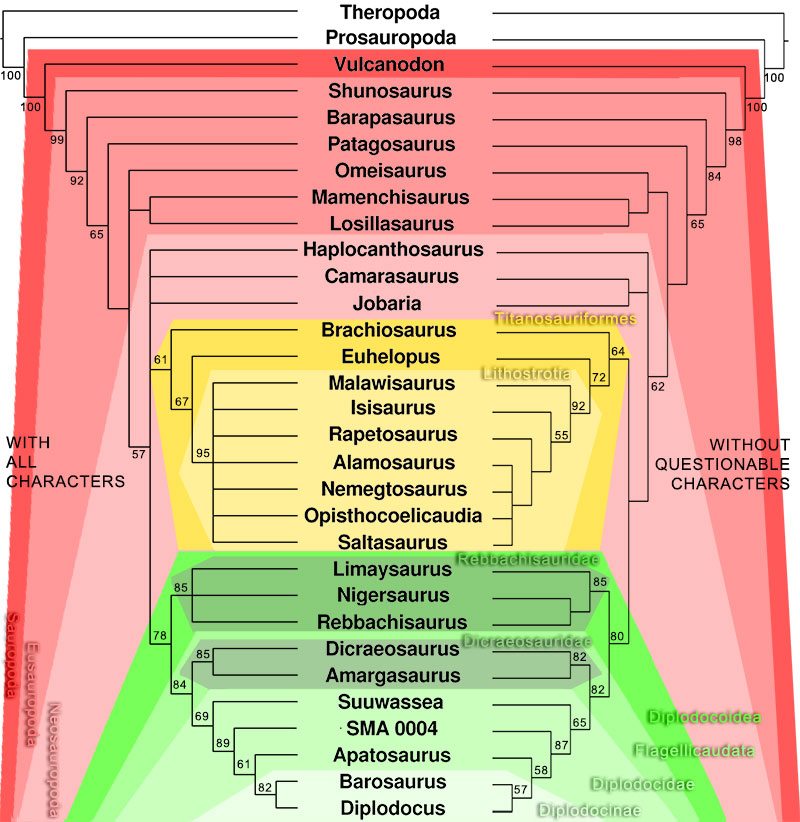
FIGURE 14. Phylogenetic trees (based on Whitlock, 2011) recovered with (left) and without (right) the questionable character (W90). Bootstrap values indicated if > 50. Note the differences in diplodocine intrarelationships. Bootstrap values in the right tree are higher for high-level, but lower for low-level taxa.
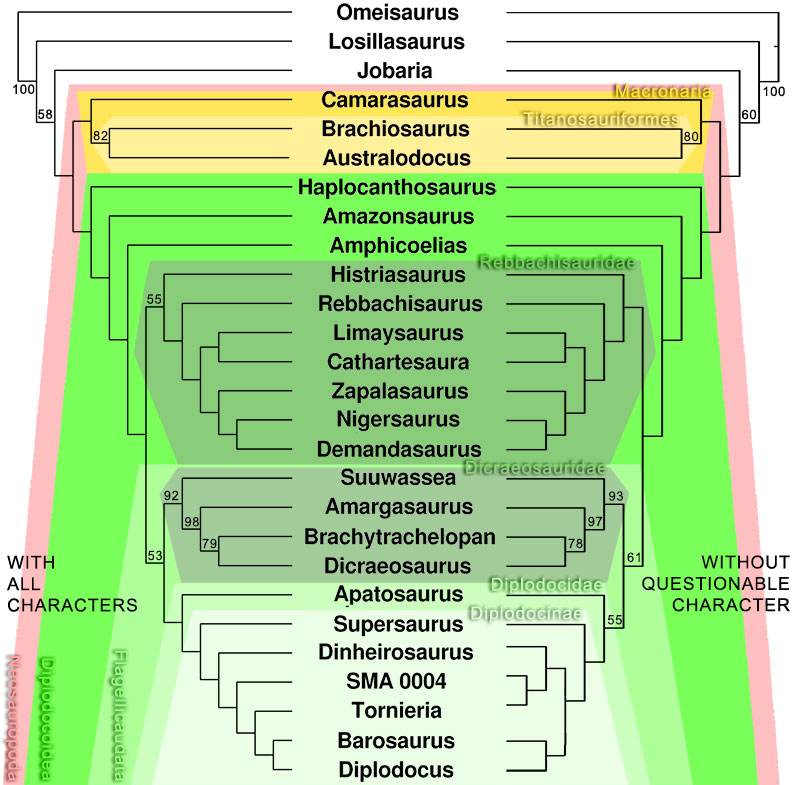
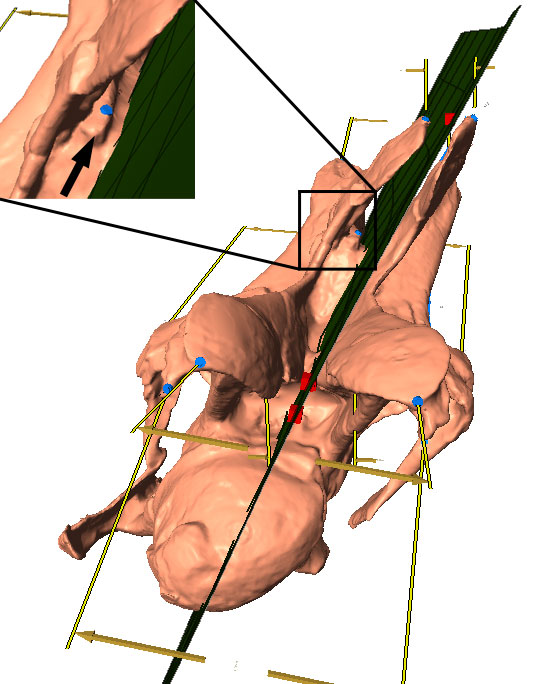
FIGURE 15. Calculated midsagittal plane on original model of CV 13 in oblique anterodorsal view. The used symmetrical pairs of landmarks are indicated in yellow and blue, the midsagittal plane in green. Note the medial tuberosity (arrow in close-up), which is supposed to lie on the midsagittal plane, but the methods used herein do not allow to include single points.
Emanuel Tschopp Universidade Nova de Lisboa
Faculdade de Ciências e Tecnologia-CICEGe
Monte de Caparica
Portugal and Museu da Lourinhã
Rua João Luis de Moura
2530-158 Lourinhã
Portugal
Emanuel Tschopp received his MSc in paleontology 2008 at University of Zurich. In 2010, he started his PhD at the Departement of Geology of the Faculdade de Ciência e Tecnologia of the Universidade Nova de Lisboa, Portugal, under the supervision of Prof. Octávio Mateus. His main research interests are the phylogeny and evolution of sauropod dinosaurs, in particular of the Late Jurassic faunas from the Morrison and the Lourinhã Formations in the USA and Portugal, respectively.
![]()
João Russo Museu da Lourinhã
Rua João Luis de Moura
2530-158 Lourinhã
Portugal
João Russo graduated in September 2010, with a degree in Geology and Natural Resources, at the Faculdade de Ciências da Universidade de Lisboa, Portugal. The final project was entitled “Modeling of Cretaceous uplift and erosion events in the Lusitanian Basin (Portugal)”. In 2012, Russo enrolled in the Master's program in paleontology at the Geology Departement of the Faculdade de Ciência e Tecnologia, Universidade Nova de Lisboa, Portugal.
![]()
Gordon Dzemski Institut für Biologie und Ihre Didaktik
Universität Flensburg
Germany
Gordon Dzemski made his Ph.D. degree at University of Flensburg, Germany, in 2006. Since then, he is working as a middle school teacher, but continues his research on morphometrics and biomechanics of long necks in terrestrial animals.
Retrodeformation as a test for the validity of phylogenetic characters: an example from diplodocid sauropod vertebrae
Emanuel Tschopp, João Russo, and Gordon Dzemski
Plain Language Abstract
Recovered fossils are usually deformed in various ways, due to the different pressures and conditions they went through during the process of fossilization, which can take hundreds of millions of years. Such deformation is difficult to see in some cases, and even when visible, it is hard to quantify how much the element is distorted. As this might affect length ratios used to distinguish species, assessing the degree of deformation is important. In the present study, neck vertebrae of a sauropod dinosaur were subjected to two methods of automated retrodeformation, which are supposed to reconstruct the original shape of the fossil to some degree. As a test, the same methods were applied to a digitally deformed 3D model of a bird vertebra. We were able to show that the retrodeformation methods do not appear to yield accurate reconstructions of the original shape, and that ratios have to be used very carefully in comparisons between extinct species. However, by comparing the sauropod with the bird vertebrae (the best fit for sauropod neck vertebrae in living animals), one can detect ratios that are less prone to certain types of deformations, and more probable to be restored by means of automated retrodeformation tools. This might prove an important technique to test the accuracy of ratios used to distinguish species.
Resumen en Español
La retrodeformación como prueba de la validez de los caracteres filogenéticos: ejemplo a partir de vértebras de saurópodos diplodócidos.
Los esfuerzos tectónicos sobre formaciones rocosas suelen producir deformaciones y fracturaciones tanto a pequeña como a gran escala. Los fósiles incluidos en esas rocas también sufren esas deformaciones y, por lo general, aparecen distorsionados, lo que afecta a las proporciones utilizadas en los análisis filogenéticos. Para este estudio se utilizaron vértebras cervicales de dinosaurios saurópodos diplodócidos, que fueron sometidas a dos métodos diferentes de retrodeformación que, por otra parte, fueron contrastados con un modelo digital deformado manualmente de una vértebra cervical de un dodo (Raphus cucullatus, Linnaeus, 1758). Los resultados indican que la forma cambia en todas las dimensiones. Los análisis llevados a cabo muestran que, por lo general, la retrodeformación restaura la simetría pero incrementa la deformación inducida por compresión. Mediante la comparación de las tendencias observadas en el análisis de Raphus cucullatus con los resultados obtenidos a partir de las vértebras de diplodócidos se han podido identificar los caracteres filogenéticos más susceptibles a diferentes tipos de deformación. Los análisis filogenéticos en los que no se usaron estos caracteres proporcionan, por lo general, una mejor resolución, árboles filogenéticos más cortos y sencillos y una mayor fiabilidad. Las proporciones utilizadas para la definición de caracteres, así como cualquier otra información derivada de caracteres posiblemente afectados por deformación han de ser aplicadas cautelosamente, intentando evitar, a priori, las proporciones altamente susceptibles. Como se muestra en este estudio, la retrodeformación puede emplearse para identificar esas proporciones y caracteres siempre que se contraste simultáneamente con huesos similares de taxones actuales.
Palabras clave: Deformación; Sauropoda; filogenia; modelos digitales; vértebras cervicales
Traducción: Miguel Company
Résumé en Français
La rétrodéformation comme test de validité des caractères phylogénétiques: un exemple à partir des vertèbres de sauropodes diplodocidés
La pression tectonique est omniprésente dans les formations rocheuses, conduisant à des déformations, des failles, et des cassures aussi bien à petite qu'à grande échelle. Les fossiles contenus dans ces strates subissent passivement l'effet de ces déformations, et sont rarement trouvé sans déformation. Cela affecte les proportions utilisées dans les analyses phylogénétiques. Comme cas d'étude, les vertèbres cervicales de diplodocidés (Dinosauria: Sauropoda) ont été soumises à deux différentes méthodes de rétrodéformation, et les mêmes méthodes ont également été testées avec un modèle digital de vertèbre cervicale de Dodo (Raphus cucullatus, Linnaeus, 1758) déformée manuellement. Les résultats montrent que la forme change considérablement dans toutes les dimensions. Les tests montrent que généralement, la rétrodéformation restore la symétrie, mais augmente la déformation induite par compression. En comparant les tendances obtenues par l'analyse de Raphus cucullatus avec les résultats provenant des vertèbres de diplodocidés, les caractères qui sont le plus sujets à différentes types de déformations ont été identifiés. Les analyses réalisées sans ces caractères douteux ont produit généralement des arbres parcimonieux plus courts, et avec une meilleur résolution, et des valeurs de support plus fortes. Les proportions utilisées pour la définition des caractères, de même que les autres informations potentiellement affectées par ces déformations, doivent être appliquées très prudemment, et les proportions hautement sensibles à la déformation devraient être écartées a priori. Comme montré dans cette études, la rétrodéformation fonctionne en tant qu'outil permettant d'identifier de tels proportions et caractères, mais doit être simultanément testé avec des os similaires provenant de taxa actuels.
Mots Clés: Déformation; Sauropoda; phylogénie; modèles digitaux; vertèbres cervicales
Translator: Olivier Maridet
Deutsche Zusammenfassung
Mit Retrodeformation die Aussagekraft von phylogenetischen Merkmalen testen: ein Beispiel mit diplodociden Sauropodenwirbeln
Tektonische Beanspruchung ist in Gesteinsformationen allgegenwärtig und führt zu Deformationen, Störungen und klein-wie großformatigen Brüchen. In solchen Gesteinen eingebettete Fossilien erfahren diese Deformationen passiv und werden deshalb selten undeformiert gefunden. Das beeinträchtigt die in den phylogenetischen Analysen verwendeten Verhältnisse. Als Fallstudie wurden diplodocide (Dinosauria: Sauropoda) Halswirbel mit zwei unterschiedlichen Retrodeformations - Methoden untersucht. Die gleichen Methoden wurden an einem manuell deformierten digitalen Halswirbelmodell eines Dodos (Raphus cucullatus, Linnaeus, 1758) getestet. Die Ergebnisse zeigen, dass sich die Form in allen Dimensionen erheblich verändert. Die Tests zeigten generell, dass Retrodeformation die Symmetrie wieder herstellt, jedoch die durch Druck induzierte Deformation erhöht. Durch den Vergleich der Trends aus der Analyse von Raphus cucullatus mit den Ergebnissen der diplociden Wirbel wurden phylogenetische Merkmale identifiziert, die anfälliger für verschiedenen Arten von Deformation sind. Phylogenetische Analysen ohne diese zweifelhaften Merkmale ergaben allgemein eine bessere Auflösung, Stammbäume mit den sparsamsten Annahmen und höhere Stützwerte. Verhältnisse die zur Merkmalsdefinition genutzt werden, genauso wie andere Merkmalsinformation die möglicherweise durch Deformation beeinflusst wurde, sollten sehr vorsichtig angewendet werden und besonders anfällige Verhältnisse sollten a priori vermieden werden. Wie in dieser Studie gezeigt wurde, kann Retrodeformation als Werkzeug genutzt werden, um solche Verhältnisse und Merkmale zu identifizieren, sie muss jedoch gleichzeitig an ähnlichen Knochen rezenter Taxa getestet werden.
SCHLÜSSELWÖRTER: Deformation; Sauropoda; Phylogenie; digitale Modelle; Halswirbel
Translators: Eva Gebauer
Arabic
Translator: Ashraf M.T. Elewa
-
-
-
Review: The Princeton Field Guide to Mesozoic Sea Reptiles
 The Princeton Field Guide to Mesozoic Sea Reptiles
Article number: 26.1.1R
April 2023
 Poster Winners 2024