

Article Search
Volume 27.1
January–April 2024
Full table of contents
ISSN: 1094-8074, web version;
1935-3952, print version
Recent Research Articles
See all articles in 27.1 January-April 2024
See all articles in 26.3 September-December 2023
See all articles in 26.2 May-August 2023
See all articles in 26.1 January-April 2023
 Lauren B. DeBey. Department of Biology, University of Washington, Box 351800, Seattle, WA 98195-1800, USA. Burke Museum of Natural History and Culture, Box 353010, Seattle, WA 98195-0001, USA. lbdebey@uw.edu
Lauren DeBey received her PhD from the Biology Department at the University of Washington, where she focused on mammalian postcrania across the Cretaceous-Paleogene boundary of northeastern Montana. She co-founded a professional development program called the Discoveries in Geosciences (DIG) Field School, which provides immersive field experiences and curriculum support for K-12 STEM teachers. She is currently a Product Consultant at Tableau Software in Seattle, Washington.

 Gregory P. Wilson. Department of Biology, University of Washington, Box 351800, Seattle, WA 98195-1800, USA. Burke Museum of Natural History and Culture, Box 353010, Seattle, WA 98195-0001, USA. gpwilson@uw.edu
Greg Wilson is a vertebrate paleontologist who specializes in Mesozoic and early Cenozoic mammals and the Cretaceous-Paleogene mass extinction event. He has conducted field research in India, Colombia, Ethiopia, Niger, Mexico, and the United States. He co-founded a professional development program called the Discoveries in Geosciences (DIG) Field School, which provides immersive field experiences and curriculum support for K-12 STEM teachers. Greg is currently an Associate Professor of Biology at the University of Washington and Curator of Vertebrate Paleontology at the Burke Museum. His wife, Caroline Stromberg, and brother, Jeff Wilson, are also paleontologists.
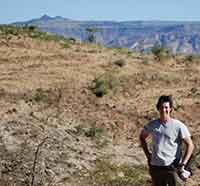
FIGURE 1. Map of humerus-bearing fossil localities from this study. Localities span the Lancian biozone (yellow circles), and early and late Puercan biozones (Pu1 and Pu3, in blue stars and green triangles, respectively), as well as the temporally mixed Lancian-Pu1 localities of the Bug Creek Anthills (red squares). Most localities are in Garfield and McCone counties; Fallon and Carter counties in Montana and Niobrara County in eastern Wyoming (not pictured) each have one locality. Locality names and details are given in Appendix 1. Modified from Wilson et al. 2014.
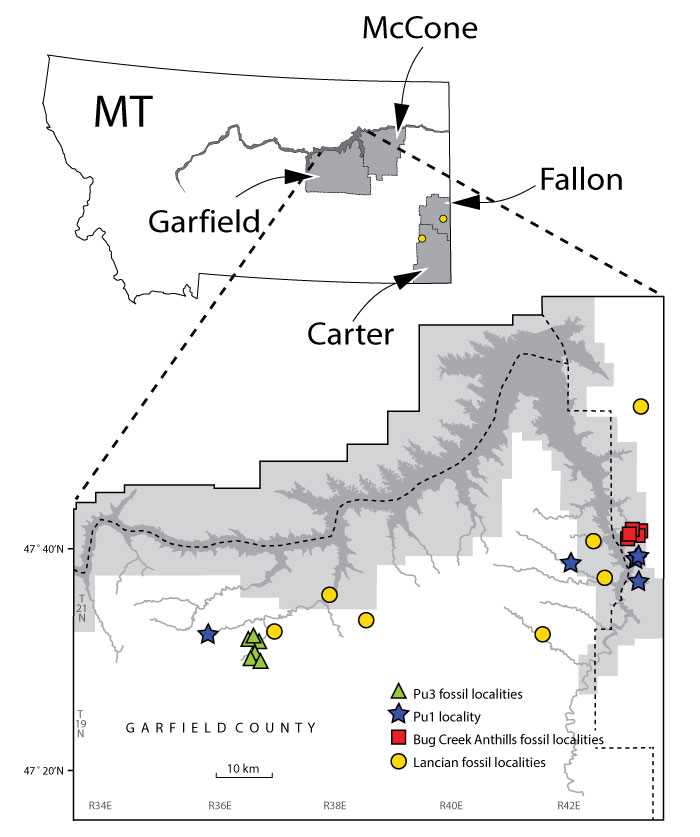
FIGURE 2. Schematic of humerus measurements used in this study. Multituberculate specimen (UCMP 153039; left) in ventral (1), dorsal (2), and distal (3) views; eutherian specimen (UCMP 151964; right, reversed to appear as left) in anterior (4), posterior (5), and distal (6) views. See Table 1 for measurement descriptions. Abbreviations: AW, articular width; C, capitulum; CL, capitulum length; CD, capitulum depth; CW, capitulum width; EC, ectepicondyle; LC, lateral epicondyle (ectepicondyle); MC, medial epicondyle (entepicondyle); NC, entepicondyle; NCW, entepicondylar width; RC, radial condyle; RCL, radial condyle length; RCD, radial condyle depth; RCW, radial condyle width; TDW, total distal width; TL, trochlear length; TD, trochlear depth; TLW, total lateral width; TW; trochlear width; UC, ulnar condyle; UCL, ulnar condyle length; UCD, ulnar condyle depth; UCW, ulnar condyle width; UT, ulnar trochlea.
FIGURE 3. Geometric morphometric scheme and method for placement of landmarks (LMs), curves, and semilandmarks (SLMs) on therian left distal humerus (UWBM 20646, Sciurus carolinensis). All specimens were oriented with anterior up and medial to the left; right specimens were reflected to appear as lefts. (1) LMs 1-6 were plotted (see Table 5 for landmark descriptions). (2) Curves were traced along the anterior, posterior, and medial borders of the articular surface. (3) Curves were re-sampled for equivalent lengths between points, with 11, nine, and five points describing the anterior, posterior, and medial borders of the articular surface, respectively. All resampled points and LMs were used for Procrustes superimposition, with sliders (gray) allowed to slide between helper points (white; see Methods). (4) Helpers were deleted, and all remaining LMs (black) and SLMs (white) were used in PCA analyses.
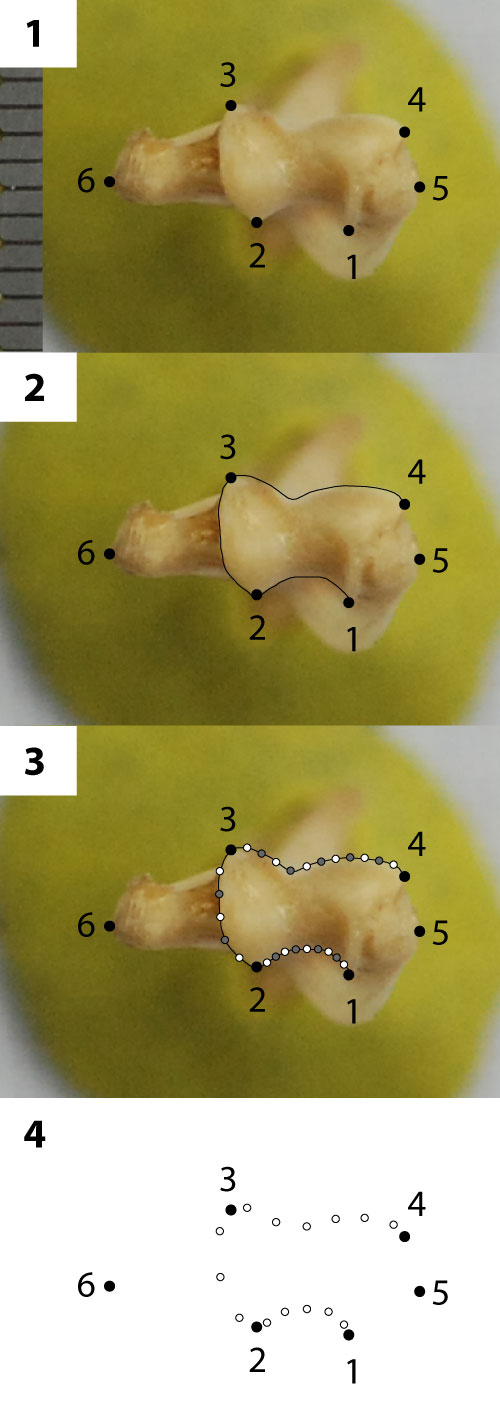
FIGURE 4. Multituberculate morphotype MuA (UCMP specimen 122045, from locality V70201; right), in ventral (1) and dorsal (2) stereopair views, and in lateral (3), medial (4), and distal (5) views.
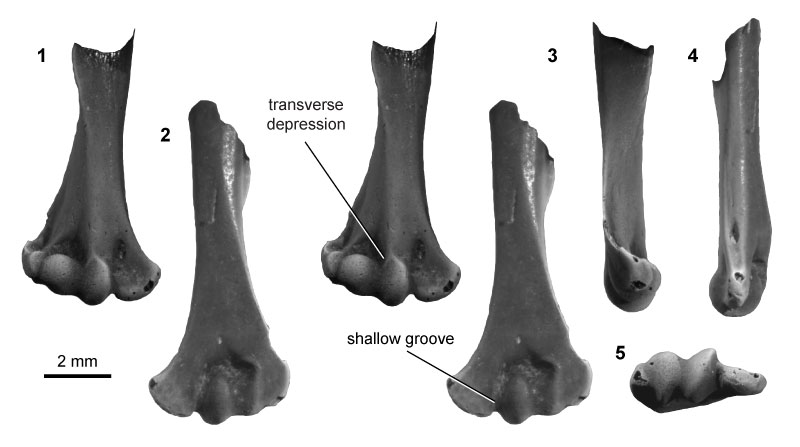
FIGURE 5. Multituberculate morphotype MuB (UCMP specimen 195933, from locality V99438; left), in ventral (1) and dorsal (2) stereopair views, and in distal (3), medial (4), and lateral (5) views.
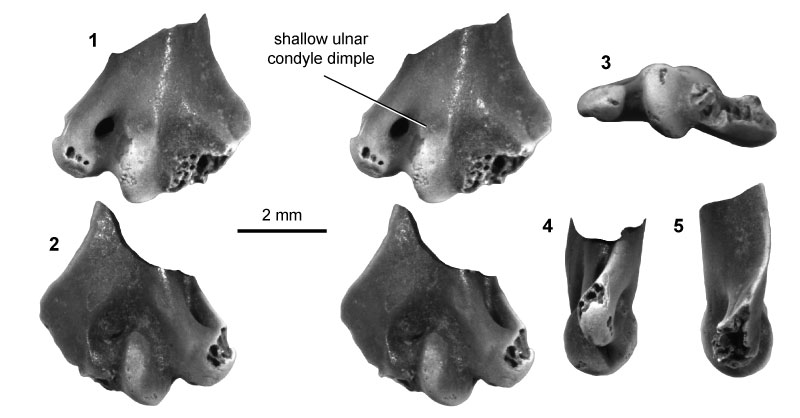
FIGURE 6. Multituberculate morphotype MuC (UCMP specimen 153039, from locality V84193; left), in ventral (1) and dorsal (2) stereopair views, and in lateral (3), medial (4), and distal (5) views.
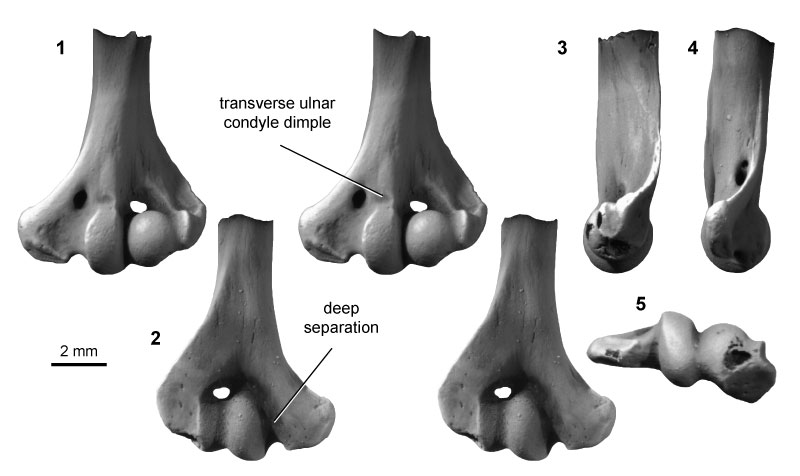
FIGURE 7. Multituberculate morphotype MuD (UCMP specimen 195990, from locality V5620; left), in ventral (1) and dorsal (2) stereopair views, and in medial (3), lateral (4), and distal (5) views.
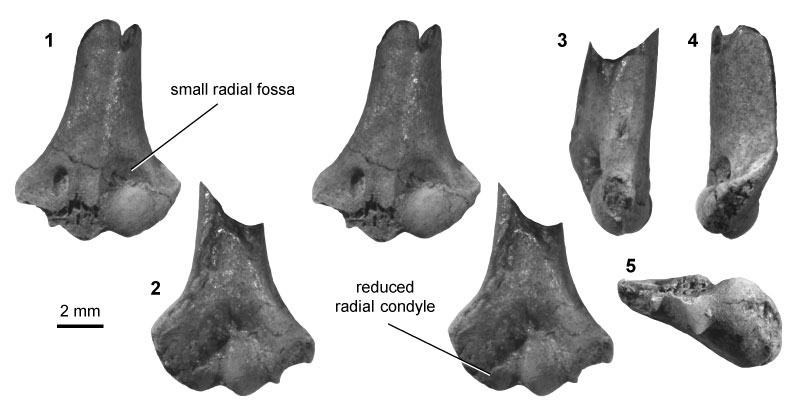
FIGURE 8. Multituberculate morphotype MuE (UWBM specimen 97031, from locality C1845; right), in ventral (1) and dorsal (2) stereopair views, and in lateral (3), medial (4), and distal (5) views.
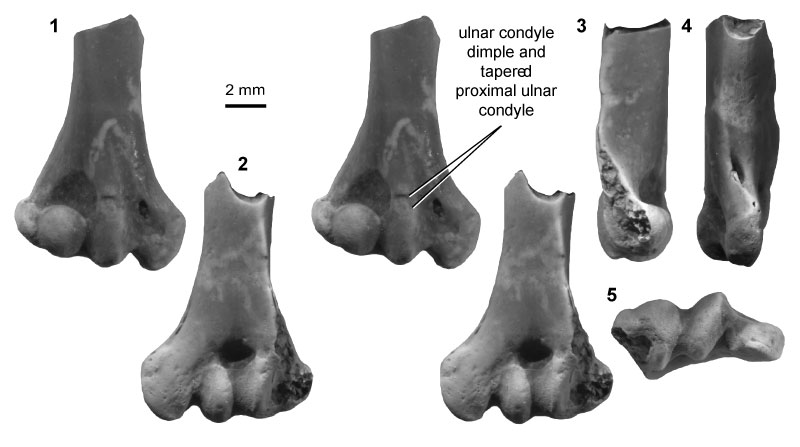
FIGURE 9. Multituberculate morphotype MuF (UCMP specimen 127384, from locality V87001; left), in ventral (1) and dorsal (2) stereopair views, and in lateral (3), medial (4), and distal (5) views.
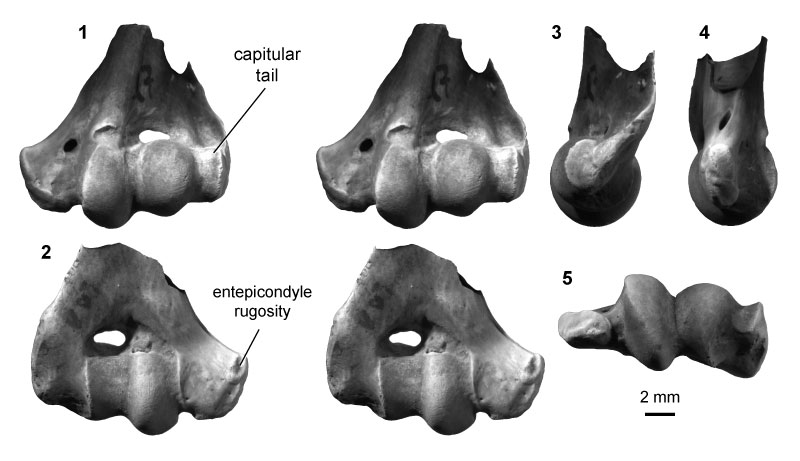
FIGURE 10. Therian morphotype ThA (UCMP specimen 127391, from locality V88007; left) in anterior (1) and posterior (2) stereopair views, and in medial (3) view.
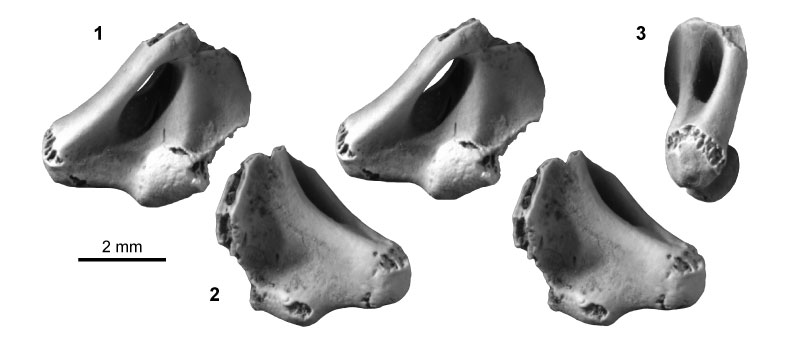
FIGURE 11. Metatherian morphotype MeA (UCMP specimen 152394, from locality V93169; left) in anterior (1) and posterior (2) stereopair views, and in lateral (3), medial (4), and distal (5) views.
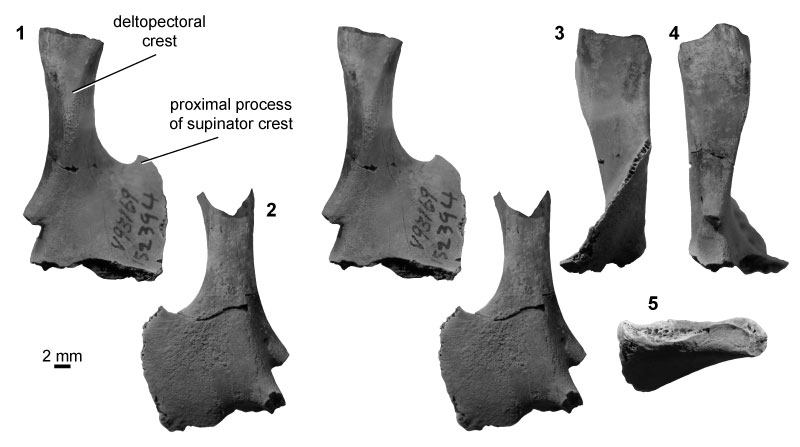
FIGURE 12. Eutherian morphotype EuA (UCMP specimen 153100, from locality V99438; left) in anterior (1) and posterior (2) stereopair views, and in lateral (3), medial (4), and distal (5) views. Specimen images are CT scan views, not photographs; see Methods for details. Rough patches inside the shaft and within the entepicondylar foramen are the result of sediment infilling, whereas other rough areas (i.e., supinator crest, medial entepicondyle, posterior articular surfaces) indicate specimen breakage.
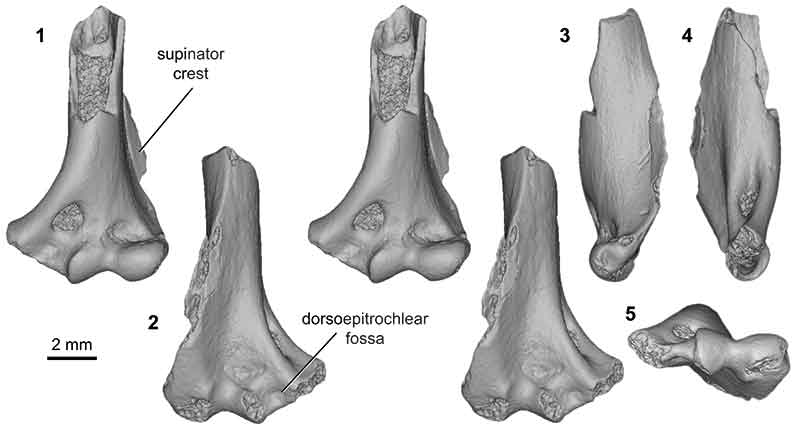
FIGURE 13. Eutherian morphotype EuB (UWBM specimen 97114, from locality C1115; left) in anterior (1) and posterior (2) stereopair views, and in distal (3), lateral (4), and medial (5) views.
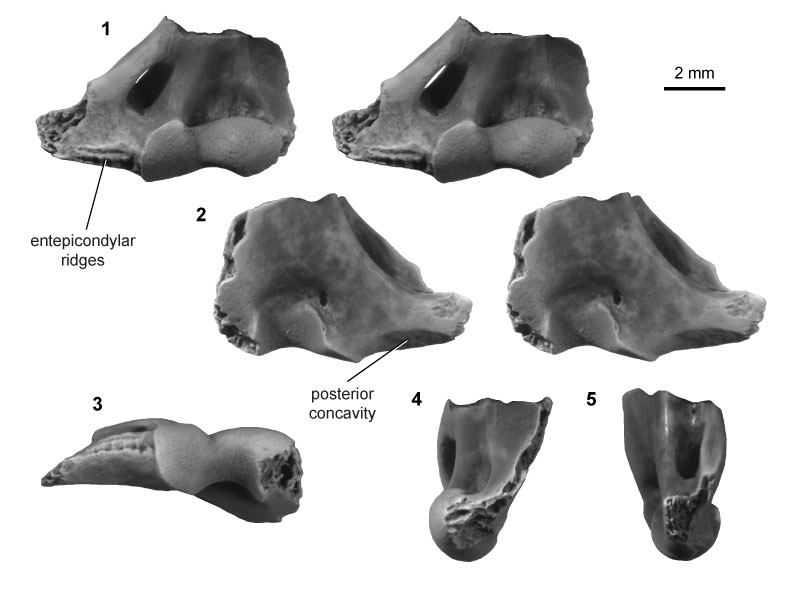
FIGURE 14. Eutherian morphotype EuC (UCMP specimen 151991, from locality V71203; right) in anterior (1) and posterior (2) stereopair views, and in lateral (3), medial (4), and distal (5) views.
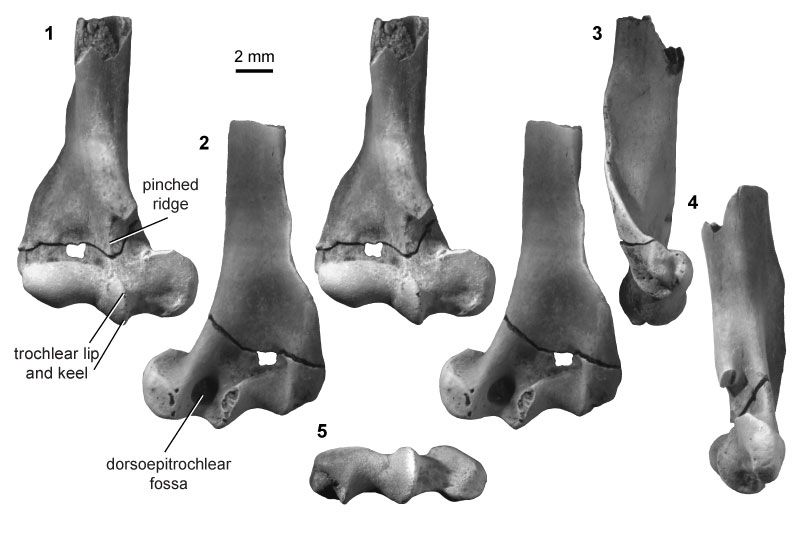
FIGURE 15. Eutherian morphotype EuD (UCMP specimen 151964, from locality V65127; right) in anterior (1) and posterior (2) stereopair views, and in lateral (3), medial (4), and distal (5) views.
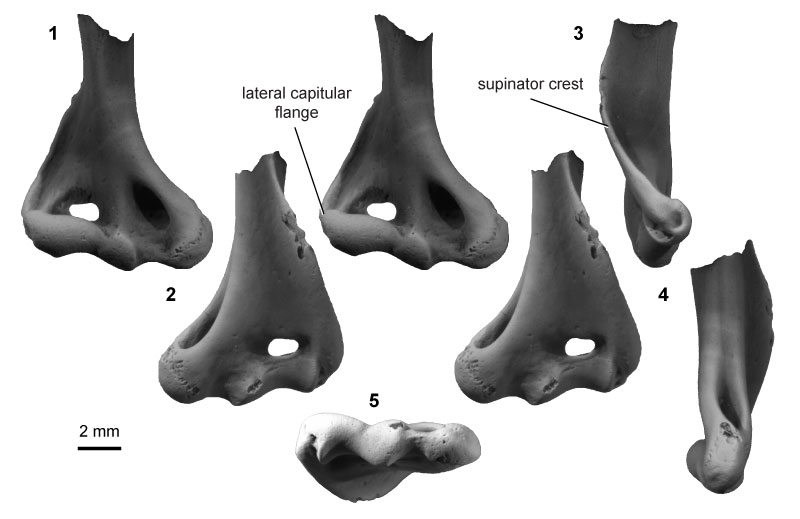
FIGURE 16. Eutherian morphotype EuE (UCMP specimen 218901, from locality V91065; right) in anterior (1) and posterior (2) stereopair views, and in lateral (3), medial (4), and distal (5) views.
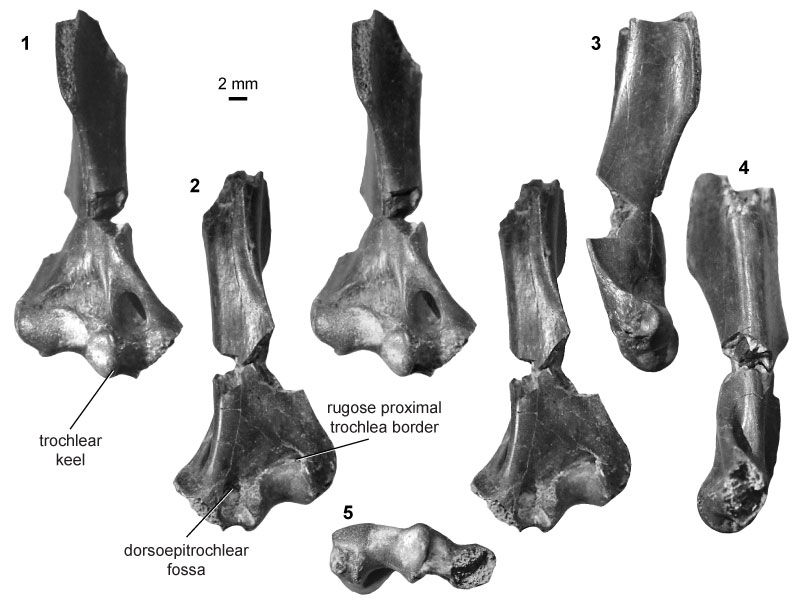
FIGURE 17. Eutherian morphotype EuF (UCMP specimen 92928, from locality V72129; right) in anterior (1) and posterior (2) stereopair views, and in lateral (3), medial (4), and distal (5) views.
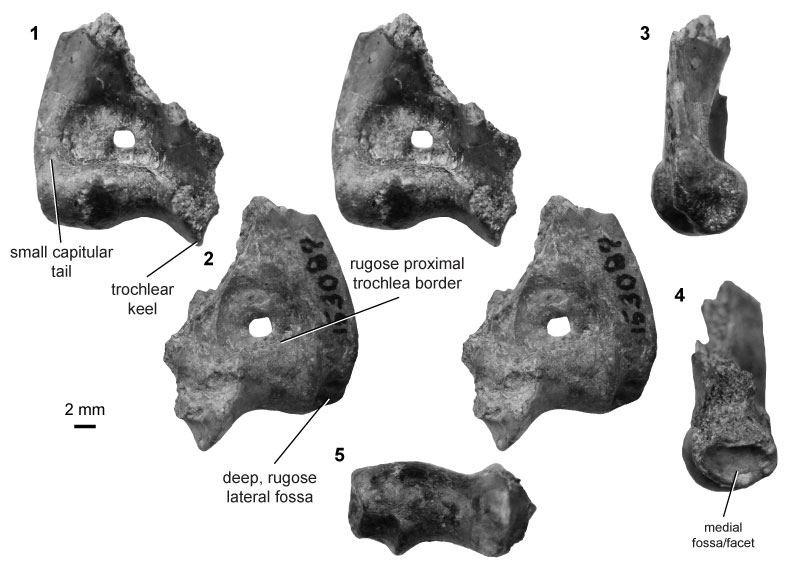
FIGURE 18. Eutherian morphotype EuG (UCMP specimen 192678, from locality V74124; left) in anterior (1) and posterior (2) stereopair views, and in medial (3) and distal (4) views.
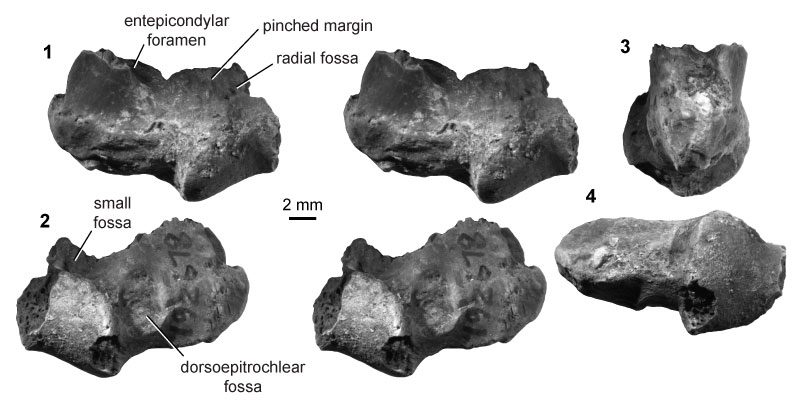
FIGURE 19. Summary of humerus morphotypes and relative sizes in our study area in the Hell Creek and Tullock formations of eastern Montana. Multituberculate morphotypes are shown as black bars, metatherians as gray bars, and eutherians as white bars. Numbers within the bars indicate the sample size for each temporal bin. Morphotypes are arranged left to right according to increasing size (see text for specimen numbers, localities, and details; Appendix 7-Appendix 8 for morphotype mean sizes). Gradients for MuF, EuC, and EuD indicate morphotypes were present in the time-averaged Bug Creek Anthills assemblages, and the morphotype range may extend into the Pu1 and/or the Lancian. Pu2 assemblages are not known from our study area (hashmarks indicate resultant uncertainty of range-through morphotypes; Clemens 2015). The age model is based on previous geochronological work in this study area (Swisher et al., 1993; Renne et al., 2011, 2013; Wilson, 2014; Sprain et al. 2014); note the temporal axis is not to scale. Modified from Sprain et al. (2014). Abbreviations: Fm, Formation; NALMA, North American Land Mammal “age”; Pu1, early Puercan; Pu3, middle/late Puercan; queries (?) indicate specimens that are only tentatively attributed to that morphotype, see Methods.
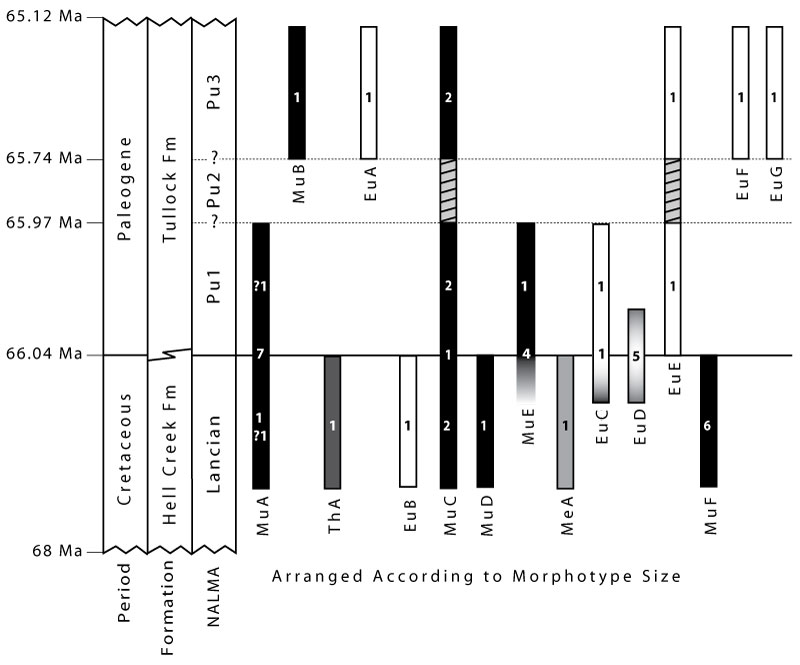
FIGURE 20. Plots of Principal Component Analysis (PCA) of full dataset, color-coded for taxon (top) and locomotor group (bottom), with fossils (open circles) projected into the morphospace. (1) PC1 vs. PC2 and (2) PC2 vs. PC3 for all taxa (legend top right), and the same data for locomotor group (3-4; legend bottom right). Also included are the deformation grids for the extreme ends of PC1 and PC2 on right humerus in distal view (identical to Appendix 32-Appendix 33).
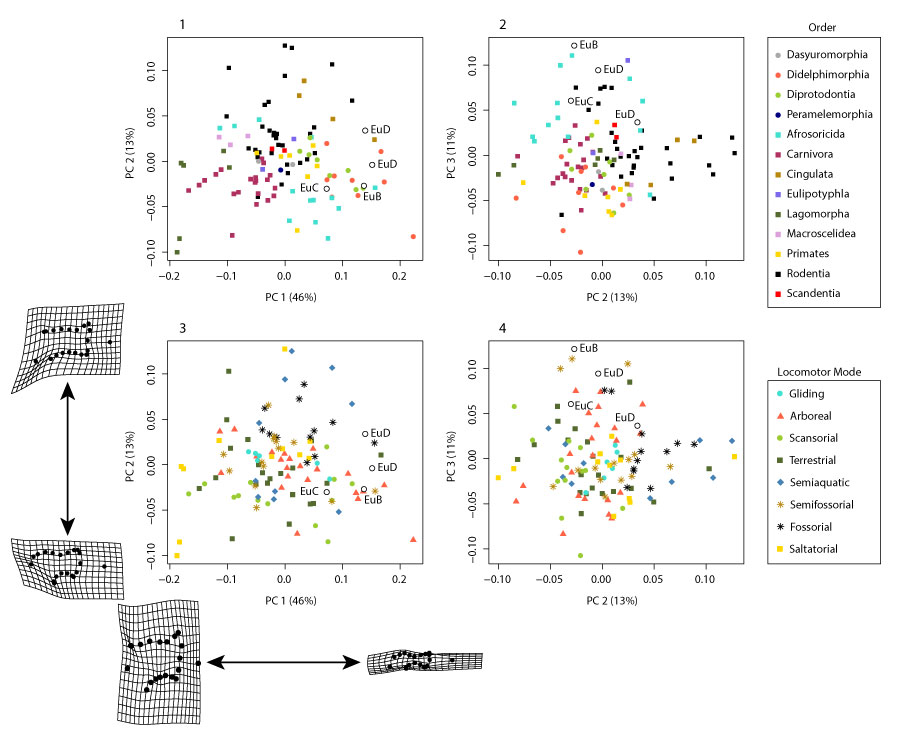
FIGURE 21. Plots of PCA of pruned dataset, color-coded for taxon (top) and locomotor group (bottom), with fossils (open circles) projected into the morphospace. (1) PC1 vs. PC2 and (2) PC2 vs. PC3 for all taxa (legend top right), and the same data for locomotor group (3-4; legend bottom right). Also included are the deformation grids for the extreme ends of PC1 and PC2.
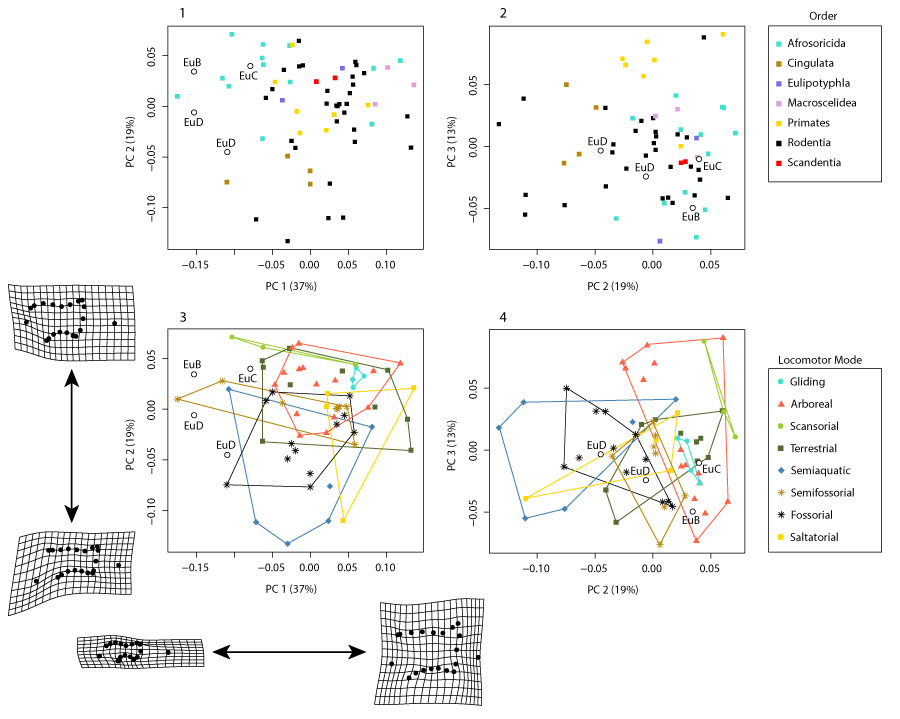
FIGURE 22. Plot of PC1 vs. PC2 for the pruned dataset with (1-8) each locomotor group plotted separately (data, legend, and fossil placement identical to Figure 21.3).
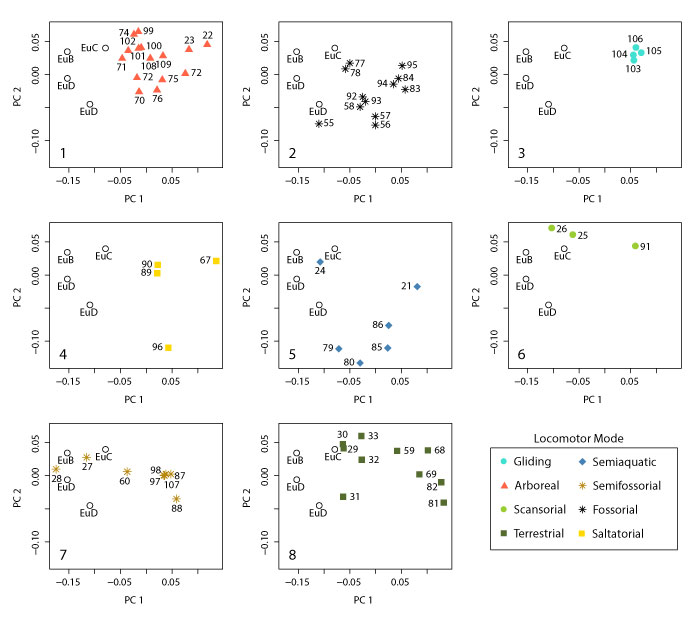
FIGURE 23. Plot of PC2 vs. PC3 for the pruned dataset with (1-8) each locomotor group plotted separately (data, legend, and fossil placement identical to Figure 21.4).
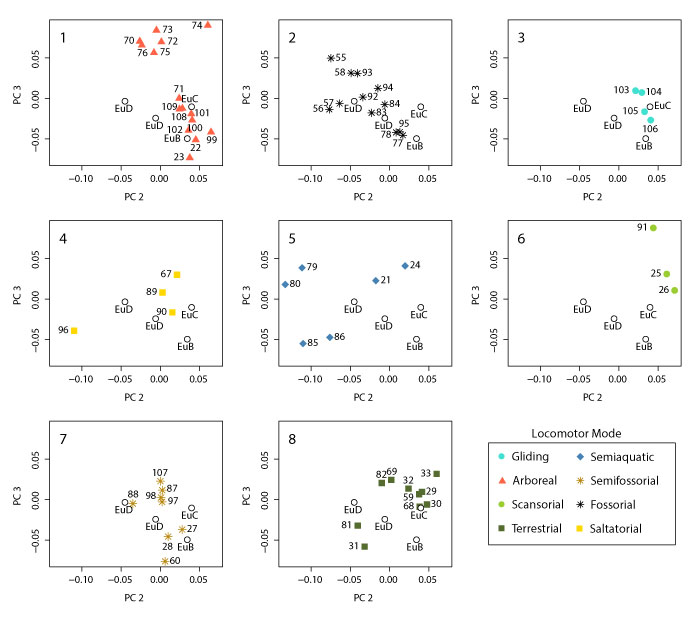
FIGURE 24. Plots of Linear Discriminant Analysis of the pruned dataset according to locomotor group. (1) LD1 vs. LD2; (2) LD1 vs. LD3; and (3) LD2 vs. LD3.
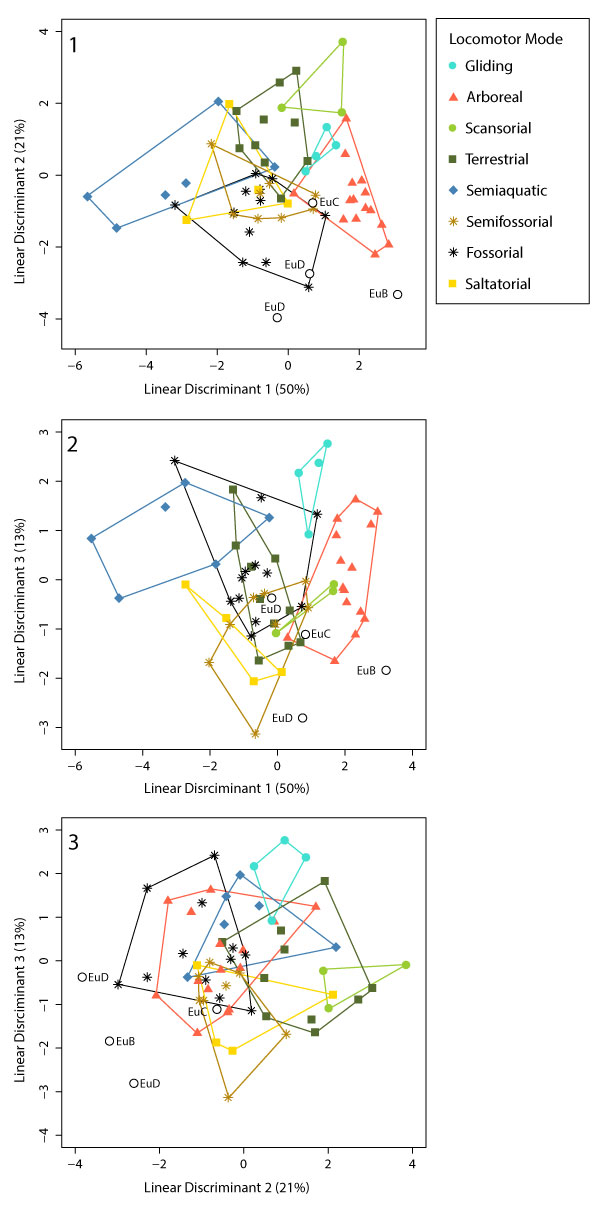
TABLE 1. Measurements taken on distal humeri in this study. Columns (from left to right) are: measurements (abbreviation and name); measurement description; taxon of study; and source reference for each measurement. We took the following measurements (Figure 2) on all multituberculate and therian specimens, contingent upon specimen completeness (see Table 2). The anatomical view from which the measurement was taken is indicated in parentheses in the description, as it relates to either multituberculate (Mu) or therian (Th) humeri, see text for more details. Measurements are identical to those in the indicated sources, with the following exceptions: our measurement TDW is ‘BW’ of Szalay and Dagosto (1980) and measurement 5 of Argot (2001); NCW is measurement 6 of Argot (2001) and ‘EEC’ of Boyer et al. (2010); TLW is ‘TLE’ of Szalay and Dagosto (1980); measurements TD and CD are modified from Szalay and Dagosto (1980) and Boyer et al. (2010). Multituberculate measurements lacking references are based on the structurally (but not necessarily functional) analogous measurement for therian humeri (see Figure 2).
| Measurements | Description | Taxon | Source | |
| TDW | Total Distal Width | Medial edge of specimen to lateral edge, measured at the maximum extensions of the entepicondyle and ectepicondyle; parallel to other distal width measures (anterior view in therians; ventral view in multituberculates) | Th, Mu | Deischl 1964; Szalay and Dagosto 1980; Argot 2001 |
| AW | Articular Surface Width | Eu: Lateral edge of capitulum to medial edge of trochlea (anterior)
Mu: Lateral edge of radial condyle to medial edge of ulnar condyle (ventral) |
Th, Mu | Szalay and Dagosto 1980; Szalay and Sargis 2001 |
| TLW | Total Lateral Width | Eu: Medial edge of trochlea to lateral edge of ectepicondyle (anterior)
Mu: Medial edge of ulnar condyle to lateral edge of ectepicondyle (ventral) |
Th, Mu | Szalay and Dagosto 1980 |
| NCW | Entepicondylar Width | Eu: Medial edge of trochlear lip to medial edge of entepicondyle (anterior)
Mu: From midpoint of groove between entepicondyle and ulnar condyle to medial edge of entepicondyle (ventral) |
Th, Mu | Argot 2001; Boyer et al. 2010 |
| TW | Trochlear Width | Medial edge of trochlea (trochlear lip) to lateral edge of trochlea (medial edge of intercondylar groove) (anterior) | Th | Szalay and Dagosto 1980; Boyer et al. 2010 |
| CW | Capitulum Width | Lateral edge of capitulum to medial edge of intercondylar groove (anterior) | Th | Szalay and Dagosto 1980; Boyer et al. 2010 |
| TL | Trochlear Length | Length from proximal margin to distal margin of trochlear lip (anterior) | Th | Szalay and Dagosto 1980; Boyer et al. 2010 |
| CL | Capitulum Length | Length from proximal margin to distal margin of capitulum (anterior) | Th | this study |
| TD | Trochlear Depth | Maximum length from anterior surface to posterior surface of trochlea, parallel to CD (distal) | Th | Szalay and Dagosto 1980; Boyer et al. 2010 |
| CD | Capitulum Depth | Length of capitulum articular surface, from anterior to posterior extent, parallel to TD (distal) | Th | Szalay and Dagosto 1980; Boyer et al. 2010 |
| UCW | Ulnar Condyle Width | Medial edge of ulnar condyle to lateral edge of ulnar condyle (ventral) | Mu | this study |
| RCW | Radial Condyle Width | Medial edge of radial condyle to lateral edge of radial condyle (ventral) | Mu | this study |
| UCL | Ulnar Condyle Length | Length from proximal margin to distal margin of ulnar condyle (ventral) | Mu | this study |
| RCL | Radial Condyle Length | Length from proximal margin to distal margin of radial condyle (ventral) | Mu | this study |
| UCD | Ulnar Condyle Depth | Maximum length from ventral surface to dorsal surface ulnar condyle, parallel to RCD (distal) | Mu | this study |
| RCD | Radial Condyle Depth | Maximum length from ventral surface to dorsal surface radial condyle, parallel to UCD (distal) | Mu | this study |
TABLE 2. Linear measurements of multituberculate distal humeri specimens. See Table 1 for measurement descriptions; all measurements on multituberculate humeri are taken in ventral view except for RCD and UCD, which are taken in distal view. All measurements are in millimeters. Abbreviations: Fm, Formation; HC, Hell Creek Formation; La, Lancian Biozone; Lan, Lance Formation; Morph., Morphotype; Pu1, Puercan 1 Biozone; Pu3, Puercan 3 Biozone; Tu, Tullock Formation. Asterisks indicate minimum size values, where preserved morphology was measured but the full measurement was not possible, due to specimen breakage; “-” indicates specimen was too broken for measurement; “?” indicates more tentative assignment to morphotype, due to specimen breakage. Locality numbers follow the system of each institution; those beginning with “V” are UCMP localities; those beginning with “C” are UWBM localities (see Appendix 1 for additional locality details).
| Specimen | Locality | Fm | Biozone | Morph. | TDW | AW | TDW | NCW | UCW | RCW | UCL | RCL | UCD | RCD |
| 195999 | V5620 | Lan | La | MuA | 3.695 | 2.060 | 2.550 | 1.045 | 0.950 | 1.115 | 1.365 | 1.195 | 1.625 | 1.525 |
| 195974 | V65127 | Tu | BCA | MuA | 3.995 | 2.005 | 2.455 | 1.255 | 0.765 | 1.000 | 1.305 | 1.140 | 1.530 | 1.510 |
| 195982 | V65127 | Tu | BCA | MuA | - | 2.040 | 2.210 | - | 0.865 | 1.170 | 1.405 | 1.055 | 1.445 | - |
| 122045 | V70201 | Tu | BCA | MuA | 4.120 | 2.105 | 2.565 | 1.375 | 0.875 | 1.235 | 1.315 | 1.165 | 1.650 | 1.580 |
| 196956 | V70201 | Tu | BCA | MuA | - | 1.960* | - | - | 0.780 | 1.120* | 1.225 | 1.005 | 1.275 | - |
| 196957 | V70201 | Tu | BCA | MuA | 3.915 | 2.090 | 2.615 | 1.175 | 0.840 | 1.160 | 1.465 | 1.240 | 1.460 | 1.455 |
| 70976 | C0338 | Tu | BCA | MuA | - | 1.850 | 2.420 | - | 0.855 | 1.070 | 1.345 | 1.150 | 1.440 | 1.400 |
| 70977 | C0338 | Tu | BCA | MuA | 3.695 | - | 2.580 | 1.075 | 1.065 | - | 1.480 | - | 1.415 | - |
| 195998 | V5620 | Lan | La | ?MuA | - | - | - | - | 0.690 | - | 0.805 | - | 1.805 | - |
| 153016 | V74111 | Tu | Pu1 | ?MuA | - | 2.165* | - | - | - | 1.240 | 1.475* | 1.240* | 1.585 | 1.475* |
| 195933 | V99438 | Tu | Pu3 | MuB | - | - | - | 1.240 | 1.080 | - | 1.465 | - | 1.670 | - |
| 174490 | V73087 | HC | La | MuC | - | 3.555* | - | - | 1.690 | 2.055 | 2.440 | 1.980 | 2.845 | 2.445 |
| 195997 | V5620 | Lan | La | MuC | - | 2.525 | 3.150 | - | 0.985 | 1.360 | 1.925 | 1.600 | 2.145 | 2.000 |
| 174420 | V70209 | Tu | BCA | MuC | 5.290 | 2.975 | 3.595 | 1.480 | 1.295 | 1.630 | 1.975 | 2.030* | 2.130 | 1.975 |
| 153039 | V84193 | HC | Pu1 | MuC | 6.460 | 3.090 | 4.250 | 1.960 | 1.570 | 1.700 | 2.185 | 1.830 | 2.555 | 2.335 |
| 197687 | V74111 | Tu | Pu1 | MuC | - | 3.565* | - | - | 1.480* | 2.050* | 2.240 | 1.885 | 2.330 | - |
| 195932 | V99438 | Tu | Pu3 | MuC | 5.350* | 3.035 | 3.820 | 1.460* | 1.505 | 1.640 | 2.180 | 1.765 | 2.515 | 2.295 |
| 195945 | V74122 | Tu | Pu3 | MuC | 5.590* | 3.040 | 3.815 | 1.480 | 1.270 | 1.420 | 2.455 | 1.755 | 2.345 | 2.305 |
| 195990 | V5620 | Lan | La | MuD | 7.310* | 4.230* | 5.470* | 1.835* | - | 2.160 | - | 2.135 | - | 2.350 |
| 174439 | V70209 | Tu | BCA | MuE | - | - | - | 2.385 | 1.855 | - | 3.265 | - | 3.200 | - |
| 174442 | V70209 | Tu | BCA | MuE | - | - | - | - | 1.965 | - | 2.730* | - | 2.600* | 2.680 |
| 195973 | V65127 | Tu | BCA | MuE | 8.130 | 4.025 | 5.080 | 2.445 | 1.485 | 2.410 | 2.810 | 2.265 | 3.200 | 3.145 |
| 97031 | C1845 | Tu | BCA | MuE | 8.420 | 4.400 | 5.230 | 2.595 | 2.000 | 2.565 | 2.695 | 2.485 | 3.355 | 3.335 |
| 174412 | V84162 | HC | Pu1 | MuE | - | - | - | - | 2.360 | - | 3.535 | - | 3.910 | - |
| 127384 | V87001 | HC | La | MuF | 14.025 | 7.730 | 9.990 | 3.970 | 3.865 | 4.435 | 5.440 | 5.095 | 6.420 | 5.580 |
| 174400 | V85092 | HC | La | MuF | - | 6.900 | - | - | 3.135 | 3.945 | 4.985 | 4.260 | 5.180 | 4.530 |
| 174232 | V72207 | HC | La | MuF | - | - | - | - | - | 5.050 | - | 5.655 | - | 6.365 |
| 174225 | V72207 | HC | La | MuF | - | 6.815* | - | 3.255 | 3.435 | 4.215* | 5.045 | 4.900 | 5.835 | - |
| 174218 | V73097 | HC | La | MuF | - | 7.820* | - | - | 2.450 | 4.325 | 5.605 | 5.145 | 6.420 | - |
| 101970 | C1521 | HC | La | MuF | 13.705 | 6.945 | 9.105 | 3.995 | 2.985 | 3.915 | 5.030 | 3.900 | 5.030 | 4.405 |
TABLE 3. Linear measurements of therian distal humeri specimens. See Table 1 for measurement descriptions; all measurements on therian humeri are taken in anterior view except for CD and TD, which are taken in distal view . All measurements are in millimeters. Abbreviations: Fm, Formation; HC, Hell Creek Formation; La, Lancian Biozone; Morph., Morphotype; Pu1, Puercan 1 Biozone; Pu3, Puercan 3 Biozone; Tu, Tullock Formation. Asterisks indicate minimum size values, where preserved morphology was measured but the full measurement was not possible, due to specimen breakage; “-” indicates specimen was broken; “?” indicates more tentative assignment to morphotype; “‡” indicates specimen was used in 2D GM locomotor analyses.Locality numbers follow the system of each institution: those beginning with “V” are UCMP localities; those beginning with “C” are UWBM localities (see Appendix 1 for additional locality details). Five additional specimens from the BCA biozone (UCMP 151945, 151965, 151983, and 151984 from loc. V65127, and UCMP 174429 from loc. V70209) are tentatively attributed to EuD but are not listed below as they lack preservation sufficient for measurement, see text for more details.
| Specimen | Locality | Fm | Biozone | Morph. | TDW | AW | TLW | NCW | TW | CW | TL | CL | TD | CD |
| 127391 | V88007 | HC | La | ThA | 4.900* | - | - | 2.380 | 1.210 | - | 1.340 | - | 1.380 | - |
| 152394 | V93169 | HC | La | MeA | 18.235* | - | - | - | - | - | - | - | - | - |
| 153100 | V99438 | Tu | Pu3 | EuA | 6.400* | 3.850 | 3.850 | 2.900* | 1.330 | 2.406 | 1.630 | 1.579 | 1.756 | 1.920 |
| 97114‡ | C1115 | HC | La | EuB | 8.53* | 4.765 | 5.120 | 3.400* | 1.705 | 2.895 | 1.960 | 1.945 | 2.355 | 2.335* |
| 151991‡ | V71203 | HC | BCA | EuC | 9.520 | 5.635 | 5.735 | 3.820 | 1.670 | 3.945 | 2.680 | 2.515 | 3.030 | 3.310 |
| 153023 | V74111 | Tu | Pu1 | EuC | - | - | - | 4.015 | 1.510* | - | 2.500* | - | 3.160 | - |
| 151985 | V70201 | Tu | BCA | EuD | 7.810* | 5.295 | 5.285 | - | 1.890 | 3.255 | 2.175 | .720 | 2.235 | 2.495 |
| 151944 | V65127 | Tu | BCA | EuD | 8.845* | 5.735 | 6.005 | 2.190* | 2.185 | 3.655 | 1.940 | 2.320 | 2.230* | 2.575* |
| 151946 | V65127 | Tu | BCA | EuD | 8.800* | 5.270 | 6.060 | - | 1.970 | 3.255 | 1.665 | 2.080 | 2.185 | 2.510* |
| 151964‡ | V65127 | Tu | BCA | EuD | 9.225 | 5.340 | 5.700 | 3.550 | 1.750 | 3.585 | 1.645 | 2.005 | 2.225 | 2.380 |
| 153036‡ | V65127 | Tu | BCA | EuD | 9.935 | 5.675 | 5.850 | 4.210 | 1.820 | 3.800 | 1.775 | 2.155 | 2.470 | 2.710 |
| 218901 | V91065 | Tu | Pu1 | EuE | 17.925* | 10.685 | 10.850 | 7.175* | 2.950 | 7.620 | 4.575 | 5.110 | 6.280 | 7.525 |
| 92928 | C1163 | Tu | Pu3 | EuE | 15.030* | 9.550 | 9.700 | - | 2.640 | 6.960 | 4.330 | 4.580 | 5.120* | 5.320 |
| 153089 | V72129 | Tu | Pu3 | EuF | 19.415* | 17.280 | 17.395 | - | 5.480 | 11.820 | 6.945 | 7.280 | 8.735* | 9.670 |
| 192678 | V72124 | Tu | Pu3 | EuG | - | - | - | 10.300 | 5.095 | - | 7.435 | - | 9.425* | - |
TABLE 4. Modern mammalian specimens used in geometric morphometrics analyses. Species list and locomotor references are modified from Chen and Wilson 2015; see text for more details. All specimens are from the UWBM except for those with specimen numbers A2001 and S2008, which are taken from images of specimens in distal view in Argot (2001, figure 8) and Salton and Sargis (2008, figure 4.10), respectively. Code number assigned (and table sorted) as follows: clade, order, family, and locomotor mode. Locomotor mode abbreviations are as follows: A, arboreal; F, fossorial; G, gliding; S, saltatorial; Sa, semiaquatic; Sc, scansorial; Sf, semifossorial; T, terrestrial. Other abbreviations: F, female; LM, locomotor mode; M, male; Spec., specimen number; U, sex unknown.
| Clade | Order | Code | LM | Genus | Species | Family | Spec. | Sex | Locomotor Reference |
| Metatheria | |||||||||
| Dasyuromorphia | |||||||||
| 1 | T | Antechinus | swainsonii | Dasyuridae | 68900 | M | Nowak 1999 | ||
| 2 | T | Sarcophilus | harrisii | Dasyuridae | 20671 | M | Van Valkenburgh 1987 | ||
| Didelphimorphia | |||||||||
| 3 | A | Caluromys | philander | Didelphidae | A2001 | U | Argot 2001; Nowak 1999 | ||
| 4 | A | Caluromys | derbianus | Didelphidae | 32255 | U | Argot 2001 | ||
| 5 | A | Micoureus | demerarae | Didelphidae | A2001 | U | Argot 2001 | ||
| 6 | Sc | Didelphis | virginiana | Didelphidae | 35525 | F | Argot 2001 | ||
| 7 | Sc | Didelphis | virginiana | Didelphidae | 74661 | M | Argot 2001 | ||
| 8 | Sc | Didelphis | marsupialis | Didelphidae | A2001 | U | Argot 2001; Nowak 1999 | ||
| 9 | Sc | Marmosa | murina | Didelphidae | A2001 | U | Argot 2001; Nowak 1999 | ||
| 10 | T | Metachirus | nudicaudatus | Didelphidae | 35438 | F | Argot 2001; Delciellos and Vieira 2006 | ||
| 11 | T | Monodelphis | brevicaudata | Didelphidae | A2001 | U | Argot 2001; Nowak 1999 | ||
| Diprotodontia | |||||||||
| 12 | G | Petaurus | breviceps | Petauridae | 34181 | M | Smith 1973; Nowak 1999; Körtner and Geiser 2000 | ||
| 13 | G | Petaurus | breviceps | Petauridae | 72928 | U | Smith 1973; Nowak 1999; Körtner and Geiser 2000 | ||
| 14 | A | Trichosurus | vulpecula | Phalangeridae | 68913 | M | Nowak 1999 | ||
| 15 | S | Potorous | tridactylus | Potoroidae | 41025 | F | Bassarova et al. 2009 | ||
| 16 | S | Potorous | tridactylus | Potoroidae | 34200 | M | Bassarova et al. 2009 | ||
| 17 | S | Aepyprymnus | rufescens | Potoroidae | 68898 | F | Bassarova et al. 2009 | ||
| 18 | A | Pseudocheirus | peregrinus | Pseudocheiridae | 68924 | F | Bassarova et al. 2009 | ||
| 19 | A | Pseudocheirus | peregrinus | Pseudocheiridae | 68908 | M | Bassarova et al. 2009 | ||
| Peramelemorphia | |||||||||
| 20 | T | Perameles | nasuta | Peramelidae | 68919 | F | Nowak 1999 | ||
| Eutheria | |||||||||
| Afrosoricida | |||||||||
| 21 | Sa | Potamogale | velox | Potamogalidae | S2008 | U | Nowak 1999; Salton and Sargis 2008 | ||
| 22 | A | Dendrohyrax | arboreus | Procaviidae | 39039 | F | Nowak 1999 | ||
| 23 | A | Dendrohyrax | arboreus | Procaviidae | 39038 | M | Nowak 1999 | ||
| 24 | Sa | Limnogale | mergulus | Tenrecidae | S2008 | U | Nowak 1999; Salton and Sargis 2008 | ||
| 25 | Sc | Echinops | telfairi | Tenrecidae | 34168 | F | Endo et al. 2006; Salton and Sargis 2008 | ||
| 26 | Sc | Echinops | telfairi | Tenrecidae | S2008 | U | Endo et al. 2006; Salton and Sargis 2008 | ||
| 27 | Sf | Hemicentetes | semispinosus | Tenrecidae | S2008 | U | Nowak 1999; Salton and Sargis 2008 | ||
| 28 | Sf | Oryzorictes | sp. | Tenrecidae | S2008 | U | Nowak 1999; Salton and Sargis 2008 | ||
| 29 | T | Setifer | setosus | Tenrecidae | S2008 | U | Salton and Sargis 2008 | ||
| 30 | T | Tenrec | ecaudatus | Tenrecidae | S2008 | U | Salton and Sargis 2008 | ||
| 31 | T | Microgale | cowani | Tenrecidae | S2008 | U | Nowak 1999; Salton and Sargis 2008 | ||
| 32 | T | Microgale | dobsoni | Tenrecidae | S2008 | U | Nowak 1999; Salton and Sargis 2008 | ||
| 33 | T | Microgale | talazaci | Tenrecidae | S2008 | U | Nowak 1999; Salton and Sargis 2008 | ||
| Carnivora | |||||||||
| 34 | T | Vulpes | vulpes | Canidae | 39490 | F | Lariviére and Pasitschniak-Arts 1996; Meachen-Samuels 2010 | ||
| 35 | T | Vulpes | vulpes | Canidae | 39489 | M | Lariviére and Pasitschniak-Arts 1996; Meachen-Samuels 2010 | ||
| 36 | Sc | Urocyon | cinereoargenteus | Felidae | 77676 | F | Van Valkenburgh 1987; Meachen-Samuels 2010 | ||
| 37 | Sc | Urocyon | cinereoargenteus | Felidae | 35221 | M | Van Valkenburgh 1987; Meachen-Samuels 2010 | ||
| 38 | Sc | Suricata | suricatta | Herpestidae | 35470 | F | van Staaden 1994; Iwaniuk et al. 1999 | ||
| 39 | Sc | Suricata | suricatta | Herpestidae | 35469 | M | van Staaden 1994; Iwaniuk et al. 1999 | ||
| 40 | Sf | Mephitis | mephitis | Mephitidae | 35951 | F | Wade-Smith and Verts 1982; Van Valkenburgh 1987; Samuels and Van Valkenburgh 2008 | ||
| 41 | Sf | Mephitis | mephitis | Mephitidae | 39321 | M | Wade-Smith and Verts 1982; Van Valkenburgh 1987; Samuels and Van Valkenburgh 2008 | ||
| 42 | Sa | Lontra | canadensis | Mustelidae | 32226 | F | Gingerich 2003 | ||
| 43 | Sa | Lontra | canadensis | Mustelidae | 32230 | M | Gingerich 2003 | ||
| 44 | Sa | Mustela | vison | Mustelidae | 41780 | F | Howell 1930; Larivié́re 1999; Gingerich 2003 | ||
| 45 | Sa | Mustela | vison | Mustelidae | 35223 | M | Howell 1930; Larivié́re 1999; Gingerich 2003 | ||
| 46 | Sc | Gulo | gulo | Mustelidae | 14200 | F | Van Valkenburgh 1987; Pasitschniak-Arts and Larivié́re 1995 | ||
| 47 | Sc | Gulo | gulo | Mustelidae | 34417 | M | Van Valkenburgh 1987; Pasitschniak-Arts and Lariviére 1995 | ||
| 48 | Sf | Spilogale | putorius | Mustelidae | 39331 | F | Heinrich and Houde 2006 | ||
| 49 | Sf | Spilogale | putorius | Mustelidae | 39155 | M | Heinrich and Houde 2006 | ||
| 50 | T | Mustela | erminea | Mustelidae | 39366 | F | Nowak 1999 | ||
| 51 | T | Mustela | erminea | Mustelidae | 72863 | M | Nowak 1999 | ||
| 52 | T | Mustela | putorius | Mustelidae | 32599 | F | Nowak 1999 | ||
| 53 | T | Mustela | putorius | Mustelidae | 58727 | M | Nowak 1999 | ||
| 54 | A | Paguma | larvata | Viverridae | 73281 | U | Nowak 1999 | ||
| Cingulata | |||||||||
| 55 | F | Cabassous | centralis | Dasypodidae | 34167 | F | Nowak 1999 | ||
| 56 | F | Dasypus | novemcinctus | Dasypodidae | 20735 | F | Samuels and Van Valkenburgh 2008 | ||
| 57 | F | Dasypus | novemcinctus | Dasypodidae | 22458 | M | Samuels and Van Valkenburgh 2008 | ||
| 58 | F | Euphractus | sexcinctus | Dasypodidae | 35468 | M | Redford and Wetzel 1985; Nowak 1999 | ||
| Eulipotyphla | |||||||||
| 59 | T | Echinosorex | gymnurus | Erinaceidae | S2008 | U | Nowak 1999; Salton and Sargis 2008 | ||
| 60 | Sf | Solenodon | paradoxus | Solenodontidae | S2008 | U | Nowak 1999; Salton and Sargis 2008 | ||
| Lagomorpha | |||||||||
| 61 | S | Brachylagus | idahoensis | Leporidae | 38628 | F | Nowak 1999 | ||
| 62 | S | Brachylagus | idahoensis | Leporidae | 38631 | M | Nowak 1999 | ||
| 63 | S | Lepus | americanus | Leporidae | 21111 | F | Nowak 1999 | ||
| 64 | S | Lepus | americanus | Leporidae | 33263 | M | Nowak 1999 | ||
| 65 | Sf | Ochotona | princeps | Ochtonidae | 18435 | F | Nowak 1999 | ||
| 66 | Sf | Ochotona | princeps | Ochtonidae | 60068 | M | Nowak 1999 | ||
| Macroscelidea | |||||||||
| 67 | S | Petrodromus | tetradactylus | Macroscelididae | S2008 | U | Salton and Sargis 2008 | ||
| 68 | T | Elephantulus | rufescens | Macroscelididae | 35475 | F | Nowak 1999 | ||
| 69 | T | Elephantulus | rufescens | Macroscelididae | 34189 | M | Nowak 1999 | ||
| Primates | |||||||||
| 70 | A | Callithrix | pygmaea | Cebidae | 39003 | F | Nowak 1999 | ||
| 71 | A | Callithrix | pygmaea | Cebidae | 39005 | M | Nowak 1999 | ||
| 72 | A | Leontopithecus | rosalia | Cebidae | 75541 | F | Nowak 1999 | ||
| 73 | A | Saguinus | oedipus | Cebidae | 35406 | F | Nyakatura et al. 2008 | ||
| 74 | A | Saguinus | oedipus | Cebidae | 35405 | M | Nyakatura et al. 2008 | ||
| 75 | A | Saimiri | sciureus | Cebidae | 82302 | F | Nowak 1999 | ||
| 76 | A | Saimiri | sciureus | Cebidae | 39014 | M | Nowak 1999 | ||
| Rodentia | |||||||||
| 77 | F | Aplodontia | rufa | Aplodontiidae | 34071 | F | Samuels and Van Valkenburgh 2008 | ||
| 78 | F | Aplodontia | rufa | Aplodontiidae | 34058 | M | Samuels and Van Valkenburgh 2008 | ||
| 79 | Sa | Castor | canadensis | Castoridae | 34116 | F | Nowak 1999 | ||
| 80 | Sa | Castor | canadensis | Castoridae | 34588 | M | Nowak 1999 | ||
| 81 | T | Cavia | porcellus | Caviidae | 72830 | F | Nowak 1999 | ||
| 82 | T | Cavia | porcellus | Caviidae | 72831 | M | Nowak 1999 | ||
| 83 | F | Microtus | pennsylvanicus | Cricetidae | 76622 | F | Nowak 1999 | ||
| 84 | F | Microtus | pennsylvanicus | Cricetidae | 34326 | M | Nowak 1999 | ||
| 85 | Sa | Ondatra | zibethicus | Cricetidae | 34324 | F | Howell 1930; Gingerich 2003 | ||
| 86 | Sa | Ondatra | zibethicus | Cricetidae | 72879 | M | Howell 1930; Gingerich 2003 | ||
| 87 | Sf | Synaptomys | borealis | Cricetidae | 66559 | F | Nowak 1999 | ||
| 88 | Sf | Synaptomys | borealis | Cricetidae | 66561 | M | Nowak 1999 | ||
| 89 | S | Zapus | princeps | Dipodidae | 76721 | F | Nowak 1999 | ||
| 90 | S | Zapus | princeps | Dipodidae | 75136 | M | Nowak 1999 | ||
| 91 | Sc | Coendou | prehensilis | Erethizontidae | 34176 | F | Nowak 1999 | ||
| 92 | F | Thomomys | bottae | Geomyidae | 44624 | F | Nowak 1999 | ||
| 93 | F | Thomomys | bottae | Geomyidae | 38261 | M | Nowak 1999 | ||
| 94 | F | Chaetodipus | fallax | Heteromyidae | 47378 | F | Lackey 1996 | ||
| 95 | F | Chaetodipus | fallax | Heteromyidae | 47379 | M | Lackey 1996 | ||
| 96 | S | Dipodomys | deserti | Heteromyidae | 78740 | F | Samuels and Van Valkenburgh 2008 | ||
| 97 | Sf | Octodon | degus | Octodontidae | 48984 | F | Nowak 1999 | ||
| 98 | Sf | Octodon | degus | Octodontidae | 39501 | M | Nowak 1999 | ||
| 99 | A | Sciurus | aberti | Sciuridae | 35278 | F | Nowak 1999 | ||
| 100 | A | Sciurus | aberti | Sciuridae | 82349 | M | Nowak 1999 | ||
| 101 | A | Sciurus | carolinensis | Sciuridae | 20646 | F | Nowak 1999 | ||
| 102 | A | Sciurus | carolinensis | Sciuridae | 30010 | M | Nowak 1999 | ||
| 103 | G | Glaucomys | sabrinus | Sciuridae | 36334 | F | Samuels and Van Valkenburgh 2008 | ||
| 104 | G | Glaucomys | sabrinus | Sciuridae | 35129 | M | Samuels and Van Valkenburgh 2008 | ||
| 105 | G | Glaucomys | volans | Sciuridae | 43897 | F | Nowak 1999 | ||
| 106 | G | Glaucomys | volans | Sciuridae | 32254 | M | Nowak 1999 | ||
| 107 | Sf | Cynomys | ludovicianus | Sciuridae | 75774 | M | Nowak 1999 | ||
| Scandentia | |||||||||
| 108 | Sc | Tupaia | glis | Tupaiidae | 34227 | F | Van Valkenburgh 1987 | ||
| 109 | Sc | Tupaia | glis | Tupaiidae | 34225 | M | Van Valkenburgh 1987 | ||
TABLE 5. Landmark number, location, type, and source reference for two-dimensional geometric morphometrics (2D GM) points on therian distal humeri. All points were digitized on distal images of specimens; see Figure 3 for more details. Numbers in parentheses are the landmark number for the point within the referenced source. Abbreviations: LM, landmark; Type, landmark type according to Zelditch et al. 2004.
| LM | Location | Type | Source Reference |
| 1 | Lateral point on the posterior trochlea | II | Steiner-Souza et al. 2010 |
| 2 | Medial point on the posterior trochlea | II | Steiner-Souza et al. 2010 |
| 3 | Medial point on the anterior trochlea | II | Steiner-Souza et al. 2010 |
| 4 | Lateral point on the anterior capitulum | II | Steiner-Souza et al. 2010 |
| 5 | Most lateral point on the ectepicondyle | III | Schutz and Guralnick 2007 (5); Steiner-Souza et al. 2010 |
| 6 | Most medial point on the entepicondyle | III | Milne et al. 2009 (12); Steiner-Souza et al. 2010 |
APPENDIX 1.
Localities containing specimens used in this study. Locality numbers follow the system of each institution; those beginning with “V” are UCMP localities; those beginning with “C” are UWBM localities. All localities are in Montana except for V5620, which is in Wyoming. Abbreviations: Fm, formation; La, Lancian; n, number of specimens from the locality; Pu1, Puercan 1; Pu3, Puercan 3.
| Loc. Number | Locality NAme | County | Fm | Biozone | n |
| C0338 | Bug Creek A | McCone | Hell Creek | mixed | 2 |
| C1115 | Celeste's Magnificent Microsite | Garfield | Hell Creek | Lancian | 1 |
| C1163 | MacDonald | Garfield | Tullock | Pu3 | 1 |
| C1521 | Wake Up | Garfield | Hell Creek | Lancian | 1 |
| C1845 | Bug Creek | McCone | Hell Creek | mixed | 1 |
| V5620 | Lull 2 | Niobrara | Lance | Lancian | 4 |
| V65127 | Bug Creek Anthills General | McCone | Hell Creek | mixed | 11 |
| V70201 | Bug Creek Anthills C | McCone | Hell Creek | mixed | 4 |
| V70209 | Bug Creek W | McCone | Hell Creek | mixed | 4 |
| V71203 | Harbicht Hill 1 | McCone | Hell Creek | mixed | 1 |
| V72129 | Garbani 04-Nw-S Level 1 | Garfield | Tullock | Pu3 | 1 |
| V72207 | Windy Hill | Garfield | Hell Creek | Lancian | 2 |
| V73087 | Flat Creek 5 | Garfield | Hell Creek | Lancian | 1 |
| V73097 | Brownie Butte | Garfield | Hell Creek | Lancian | 1 |
| V74111 | Worm Coulee 1 | Garfield | Tullock | Pu1 | 3 |
| V74122 | Biscuit Springs | Garfield | Tullock | Pu3 | 1 |
| V74124 | Yellow Sand Hill 2 | Garfield | Tullock | Pu3 | 1 |
| V84162 | Sand Cave | Garfield | Hell Creek | Pu1 | 1 |
| V84193 | Z-Line Quarry | McCone | Hell Creek | Pu1 | 1 |
| V85092 | Kmark II | McCone | Hell Creek | Lancian | 1 |
| V87001 | O’Connor Site | Fallon | Hell Creek | Lancian | 1 |
| V88007 | Spigot Bottle | Carter | Hell Creek | Lancian | 1 |
| V91065 | Capping Channel | Garfield | Tullock | Pu1 | 1 |
| V93169 | Anne’s Beast | Garfield | Hell Creek | Lancian | 1 |
| V99438 | Garbani Sandy Channel | Garfield | Tullock | Pu3 | 3 |
APPENDIX 2.
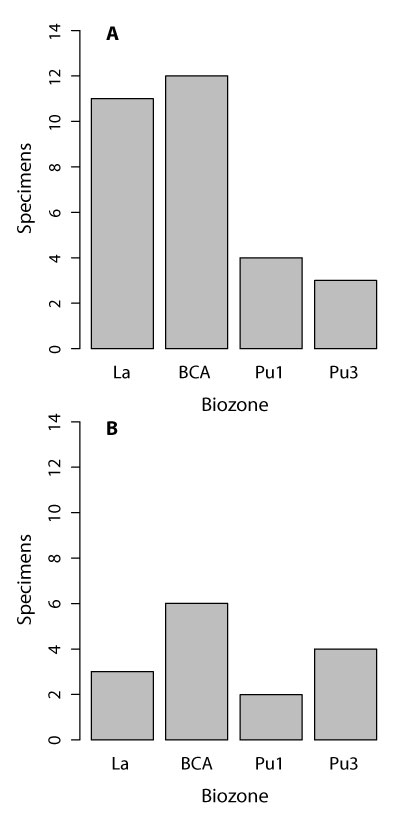
Histograms illustrating the number of multituberculate (1) and therian (2) specimens in each biozone. Abbreviations: BCA, Bug Creek Anthills mixed-age assemblage; La, Lancian; Pu1, early Puercan; Pu3; middle-late Puercan. See text for morphotype details.
APPENDIX 3.
Comparative multituberculate distal humeri used in this study. We follow the convention of Krause and Jenkins (1983) with regards to prefacing unassociated attributions with a query (e.g., for isolated material). Age data for Late Cretaceous and Paleogene North American taxa are given as NALMAs, respectively; ages of Asian taxa are given as geologic stages. Specimens from the Bug Creek Anthills localities (e.g., Deischl 1964; Krause and Jenkins 1983) are given a “Lancian-Pu1 mixed” age. All families are in the Infraorder Cimolodonta. See text for museum abbreviations.
| Specimen Number | Taxon NAme | Family | Age | Location | Reference |
| AMNH 77175 | ?Mesodma primaeva | Neoplagaiulacidae | Judithian | North America | Sahni, 1972 |
| AMNH 3011a | ?Meniscoessus conquistus | Cimolomyidae | Lancian | North America | Cope, 1884; Krause and Jenkins, 1983 |
| YPM 10612a | ?Meniscoessus robustus (formerly Dipriodon lunatus) | Cimolomyidae | Lancian | North America | Marsh, 1889; Krause and Jenkins, 1983 |
| MCZ 20786-20789 | ?Mesodma sp. | Neoplagaiulacidae | Lancian-Pu1 mixed | North America | Krause and Jenkins, 1983 |
| UMVP 1405 | ?Mesodma formosa | Neoplagaiulacidae | Lancian-Pu1 mixed | North America | Deischl,1964 |
| UMVP 1403, 1406 | ?Mesodma thompsoni | Neoplagaiulacidae | Lancian-Pu1 mixed | North America | Deischl,1964 |
| UMVP 1404 | ?Cimexomys minor | Neoplagaiulacidae | Lancian-Pu1 mixed | North America | Deischl,1964 |
| UMVP 1407 | ?Stygimys kuszmauli | Eucosmodontidae | Lancian-Pu1 mixed | North America | Deischl,1964; Krause and Jenkins, 1983 |
| UA 11994 | ?Stygimys kuszmauli | Eucosmodontidae | Lancian-Pu1 mixed | North America | Krause and Jenkins, 1983 |
| MCZ 19529 | ?Catopsalis | Taeniolabididae | Lancian-Pu1 mixed | North America | Jenkins, 1973 |
| AMNH 3036 | ?Taeniolabis taoensis | Taeniolabididae | Puercan | North America | Sloan, 1981 |
| Cope 1884: Figure 4b | Taeniolabis taoensis (formerly Polymastodon taoensis) | Taeniolabididae | Puercan | North America | Cope, 1884 |
| IVPP V8408, V9051 | ?Lambdopsalis bulla | Taeniolabididae | Late Paleocene | Asia | Kielan-Jaworowska and Qi, 1990 |
| USNM 9735 | ?Ptilodus montanus | Ptilodontidae | Torrejonian | North America | Krause and Jenkins, 1983 |
| USNM 6076 | Ptilodus montanus | Ptilodontidae | Torrejonian | North America | Gidley, 1909; Krause and Jenkins, 1983 |
| UA 9001 | Ptilodus kummae | Ptilodontidae | Tiffanian | North America | Krause and Jenkins, 1983 |
| UA 11300 | ?Ptilodus kummae | Ptilodontidae | Tiffanian | North America | Krause and Jenkins, 1983 |
| UALVP 42816 | Microcosmodon conus | Microcosmodontidae | Tiffanian | North America | Fox, 2005 |
| GISPS 8-2 PST | Tugrigbaatar saichanensis | Djadochtatheriidae | Campanian | Asia | Kielan-Jaworowska and Dashzeveg, 1978 |
| PSS-MAE 103 | Kryptobaatar dashzevegi | Djadochtatheriidae | Campanian | Asia | Sereno 2006 |
| PM 120/107 | Catopsbaatar catopsaloides | Djadochtatheriidae | Campanian | Asia | Hurum and Kielan-Jaworowska, 2008 |
| URBAC 03-076 | Multituberculata | Turonian | Asia | Chester et al., 2010 | |
| AMNH 118267 | Multituberculata | Lancian-Pu1 mixed | North America | Kielan-Jaworowska and Gambaryan, 1994 |
APPENDIX 4.
Comparative therian fossils specimens used in this study. List of fossil specimens used for comparative study. We follow the convention of Krause and Jenkins with regards to prefacing unassociated attributions with a query (e.g., for isolated material). Age data for Late Cretaceous and Paleogene North and South American taxa are given as NALMAs and SALMAs, respectively; ages of European taxa are given as geologic stages. Specimens from the Bug Creek Anthills localities (e.g., Szalay and Dagosto, 1980; Boyer et al., 2010) are given a “Lancian-Pu1 mixed” age. See text for museum abbreviations.
| Specimen Number | Taxon Name | Higher Taxon | Family | Age | Location | References |
| Marsh,1889: Plate V, figs. 5-6 | Didelphodon vorax | Didelphimorphia | Stagodontidae | Lancian | North America | Marsh,1889 |
| MHNC 1249 | Mayulestes ferox | Didelphimorphia | Mayulestidae | Tiupampan | South America | Muizon, 1998 |
| YPFB 6105, 6106, 6110, 6111 | Pucadelphys andinus | Didelphimorphia | Didelphidae | Tiupampan | South America | Marshall et al., 1995 |
| AMNH 118456 | ?Procerberus formicarum | Cimolestidae | Lancian-Pu1 mixed | North America | Boyer et al., 2010 | |
| UMVP 1837 | ?Procerberus formicarum | Cimolestidae | Lancian-Pu1 mixed | North America | Szalay and Dagosto, 1980 | |
| UM 88105 | ?Prodiacodon tauricinerei | Leptictida | Leptictidae | Wasatchian | North America | Rose, 1999 |
| AMNH 16614 | Protoselene opisthacus | archaic ungulate | Hyopsodontidae | Torrejonian | North America | Matthew, 1937 |
| NMMNH P-20949 | Tetraclaenodon puercensis | archaic ungulate | Phenacodontidae | Torrejonian | North America | Kondrashov and Lucas, 2012 |
| AMNH 119994 | ?Protungulatum donnae | archaic ungulate | Arctocyonidae | Lancian-Pu1 mixed | North America | Boyer et al., 2010 |
| UM 1836 | ?Protungulatum donnae | archaic ungulate | Arctocyonidae | Lancian-Pu1 mixed | North America | Szalay and Dagosto, 1980 |
| AMNH 16343 | Loxolophus hyattianus | archaic ungulate | Artocyonidae | Puercan | North America | Matthew, 1937 |
| AMNH 16543 | Arctocyon corrugatus (formerly Claenodon corrugatus) | archaic ungulate | Artocyonidae | Torrejonian | North America | Matthew, 1937 |
| AMNH 16591 | Chriacus sp. | archaic ungulate | Artocyonidae | Torrejonian | North America | Matthew, 1937 |
| MNHN.F.CR17, MNHN.F.CR16 | Arctocyon primaevus | archaic ungulate | Artocyonidae | Thanetian | Europe | Russell, 1964; Argot, 2013 |
| USGS 2353 | Chriacus sp. | archaic ungulate | Artocyonidae | Wasatchian | North America | Rose, 1987; O’Leary and Rose, 1995 |
| AMNH 16500 | Ectoconus ditrigonus (formerly E. majusculus) | archaic ungulate | Periptychidae | Puercan | North America | Matthew, 1937 |
| UNM-B029 | Mithrandir gillianus (formerly Gillisonchus gillianus) | archaic ungulate | Periptychidae | Puercan | North America | Rigby, 1981 |
| AMNH 3636 | ?Periptychus carinidens (formerly P. rhabdodon) | archaic ungulate | Periptychidae | Torrejonian | North America | Matthew, 1937 |
| AMNH 17075 | ?Periptychus carinidens (formerly P. rhabdodon) | archaic ungulate | Periptychidae | Torrejonian | North America | Matthew, 1937 |
| USGS 2352 | Diacodexis metsiacus | Artiodactyla | Diacodexeidae | Wasatchian | North America | Rose, 1982 |
| UALVP 49114 | Pronothodectes gaoi | “Plesiadapiformes” | Plesiadapidae | Tiffanian | North America | Boyer et al., 2010 |
| AMNH 17379 | ?NAnnodectes gidleyi (formerly Plesiadapis gidleyi) | “Plesiadapiformes” | Plesiadapidae | Tiffanian | North America | Simpson, 1935 |
| UM 64588 | Plesiadapis rex | “Plesiadapiformes” | Plesiadapidae | Tiffanian | North America | Boyer et al., 2010 |
| MNHN BR 3L and B4L | Plesiadapis tricuspidens | “Plesiadapiformes” | Plesiadapidae | Thanetian | Europe | Szalay et al., 1975 |
| UM 87990 | Plesiadapis cookei | “Plesiadapiformes” | Plesiadapidae | Clarkforkian | North America | Bloch et al., 2007 |
| UM 108210 and 82606 | Ignacius clarkforkensis | “Plesiadapiformes” | Paramomyidae | Clarkforkian | North America | Bloch et al., 2007 |
| UM 101963 | Carpolestes simpsoni | “Plesiadapiformes” | Carpolestidae | Clarkforkian | North America | Bloch and Boyer,2002 |
| AMNH 2549 | Pantolambda bathmodon | Pantodonta | Torrejonian | North America | Matthew, 1937 | |
| AMNH 16663 | Pantolambda bathmodon | Pantodonta | Torrejonian | North America | Matthew, 1937 | |
| AMNH 16410 | Onychodectes tisonensis | Taeniodonta | Conoryctidae | Puercan | North America | Schoch, 1986 |
| TMM 41364-1 | Psittacotheriummultifragum | Taeniodonta | Stylinodontidae | Torrejonian | North America | Schoch, 1986 |
| FMNH P 26090 | Ectoganusgliriformis | Taeniodonta | Stylinodontidae | Tiffanian-Clarkforkian | North America | Schoch, 1986 |
| FMNH P 26083 | Ectoganus lobdelli (formerly Lampadophorus expectatus) | Taeniodonta | Stylinodontidae | Tiffanian-Clarkforkian | North America | Schoch, 1986 |
| YPM 27201 | Ectoganus sp. | Taeniodonta | Stylinodontidae | Wasatchian | North America | Schoch, 1986 |
| YPM 11096 | Stylinodon mirus | Taeniodonta | Stylinodontidae | Bridgerian | North America | Schoch, 1986 |
| AMNH 16610 | Deltherium | Tillodontia | Deltatheriidae | Torrejonian | North America | Matthew, 1937 |
| PU 14389 | Theria indet. | Fort Union Formation | North America | Jenkins, 1973 | ||
| LSUMG V-802 | Theria indet. | Puercan | North America | Standhardt, 1986 |
APPENDIX 5.
Intraobserver error results. We performed five trials in which we plotted all six landmarks (LMs) on five specimens for each trial. Specimens were chosen to represent the overall variation in the study (i.e., at the maxima and minima of PC1 and PC2, see Appendix 32). We report the variances for each LM placement for each specimen across the five trials, as well as the mean variance across all LMs for a single specimen, and the mean variance across all specimens for a single LM. See Appendix 6 for F test comparison of differences in variance across all LMs. We report the genus and species, sex (in parentheses), and specimen number for each specimen used in this repeatability study. The specimen for Caluromys philander was taken from Argot (2001, figure 8) and lacks sex information; see Methods. Specimen ID Numbers used in this study are the same throughout; see Table 4 for additional specimen information.
| Specimen Number | ID Number | LM1 | LM2 | LM3 | LM4 | LM5 | LM6 | Mean of Variances Across LMs | |
| Cavia porcellus (F) | UWBM 72830 | 80 | 5.453E-04 | 1.599E-04 | 1.096E-05 | 6.610E-05 | 1.795E-04 | 4.135E-05 | 1.672E-04 |
| Caluromys philander (NA) | Argot, 2001, fig. 8 | 3 | 3.751E-05 | 4.613E-05 | 9.017E-05 | 2.406E-05 | 2.586E-05 | 6.837E-05 | 4.868E-05 |
| Dipodomys deserti (F) | UWBM 78740 | 95 | 7.200E-05 | 1.451E-05 | 3.171E-05 | 8.272E-05 | 1.913E-04 | 6.401E-06 | 6.643E-05 |
| Lepus americanus (F) | UWBM 21111 | 62 | 8.579E-06 | 4.393E-05 | 2.749E-04 | 1.938E-05 | 4.885E-05 | 5.885E-04 | 1.640E-04 |
| Mustela erminea (M) | UWBM 72863 | 51 | 9.250E-05 | 1.794E-04 | 3.547E-05 | 1.169E-05 | 7.590E-05 | 6.506E-05 | 7.668E-05 |
| Mean of Variances Across Specimens | 1.512E-04 | 8.878E-05 | 8.864E-05 | 4.079E-05 | 1.043E-04 | 1.539E-04 | |||
APPENDIX 6.
Results from F tests of variances pairwise across all landmarks. Specimens are those used in the repeatability study for measurement error (Appendix 5), variances were calculated across Euclidean distances from the centroid for each landmark (LM), and across all five trials for a single specimen. P-values are reported for each pairwise F test, with significance as follows: * for p < 0.05; ** for p < 0.01.
| LM1 | LM2 | LM3 | LM4 | LM5 | LM6 | ||
| Cavia porcellus | |||||||
| LM1 | - | 0.262 | ** | 0.065 | 0.307 | * | |
| LM2 | 0.262 | - | * | 0.413 | 0.913 | 0.219 | |
| LM3 | ** | * | - | 0.110 | * | 0.227 | |
| LM4 | 0.065 | 0.413 | 0.110 | - | 0.357 | 0.661 | |
| LM5 | 0.307 | 0.913 | * | 0.357 | - | 0.184 | |
| LM6 | * | 0.219 | 0.227 | 0.661 | 0.184 | - | |
| Caluromys philander | |||||||
| LM1 | - | 0.846 | 0.416 | 0.677 | 0.727 | 0.575 | |
| LM2 | 0.846 | - | 0.532 | 0.544 | 0.589 | 0.712 | |
| LM3 | 0.416 | 0.532 | - | 0.229 | 0.254 | 0.795 | |
| LM4 | 0.677 | 0.544 | 0.229 | - | 0.946 | 0.336 | |
| LM5 | 0.727 | 0.589 | 0.254 | 0.946 | - | 0.369 | |
| LM6 | 0.575 | 0.712 | 0.795 | 0.336 | 0.369 | - | |
| Dipodomys deserti | |||||||
| LM1 | - | 0.150 | 0.447 | 0.896 | 0.367 | * | |
| LM2 | 0.150 | - | 0.468 | 0.120 | * | 0.447 | |
| LM3 | 0.447 | 0.468 | - | 0.376 | 0.110 | 0.150 | |
| LM4 | 0.896 | 0.120 | 0.376 | - | 0.437 | * | |
| LM5 | 0.367 | * | 0.110 | 0.437 | - | ** | |
| LM6 | * | 0.447 | 0.150 | * | ** | - | |
| Lepus americanus | |||||||
| LM1 | - | 0.143 | ** | 0.449 | 0.121 | ** | |
| LM2 | 0.143 | - | 0.103 | 0.447 | 0.921 | * | |
| LM3 | ** | 0.103 | - | * | 0.123 | 0.479 | |
| LM4 | 0.449 | 0.447 | * | - | 0.392 | ** | |
| LM5 | 0.121 | 0.921 | 0.123 | 0.392 | - | * | |
| LM6 | ** | * | 0.479 | ** | * | - | |
| Mustela erminea | |||||||
| LM1 | - | 0.537 | 0.376 | 0.070 | 0.853 | 0.741 | |
| LM2 | 0.537 | - | 0.145 | * | 0.425 | 0.350 | |
| LM3 | 0.376 | 0.145 | - | 0.308 | 0.479 | 0.571 | |
| LM4 | 0.070 | * | 0.308 | - | 0.097 | 0.125 | |
| LM5 | 0.853 | 0.425 | 0.479 | 0.097 | - | 0.885 | |
| LM6 | 0.741 | 0.350 | 0.571 | 0.125 | 0.885 | - | |
APPENDIX 7.
Means, standard deviations, and percent preservation for multituberculate measurements by morphotype. We include all specimens except for the two specimens tentatively attributed to morphotype MuA (i.e., ?MuA), see text for more details. See Table 1 for measurement descriptions; see Table 2 for data (data excludes minimum values). NA indicates no specimens preserved the measurement (i.e., NA for means) or only one specimen preserved the measurement (i.e., NA for SD). Bold values indicate specimen percent preservation (i.e., the number of specimens that preserve that measurement divided by the total number of specimens in the morphotype) greater than or equal to 80%. We calculate the coefficient of variation (CV) for morphotypes containing more than two specimens. Abbreviations: CV, coefficient of variation; n, number of specimens; SD, standard deviation.
| TDW | AW | TLW | NCW | UCW | RCW | UCL | RCL | UCD | RCD | |
| Full Dataset (n= 28) | ||||||||||
| Mean | 6.86 | 3.55 | 4.09 | 2.05 | 1.68 | 2.27 | 2.65 | 2.48 | 2.92 | 2.80 |
| SD | 3.86 | 1.95 | 2.33 | 1.02 | 0.90 | 1.32 | 1.46 | 1.55 | 1.64 | 1.44 |
| % Preservation | 39.29 | 57.14 | 57.14 | 53.57 | 89.29 | 71.43 | 89.29 | 78.57 | 89.29 | 67.86 |
| MuA (n= 8) | ||||||||||
| Mean | 3.884 | 2.025 | 2.485 | 1.185 | 0.874 | 1.125 | 1.363 | 1.136 | 1.480 | 1.494 |
| SD | 0.187 | 0.093 | 0.140 | 0.135 | 0.096 | 0.083 | 0.085 | 0.081 | 0.121 | 0.069 |
| % Preservation | 62.50 | 75.00 | 87.50 | 62.50 | 100.00 | 75.00 | 100.00 | 87.50 | 100.00 | 62.50 |
| CV | 0.048 | 0.046 | 0.056 | 0.114 | 0.110 | 0.073 | 0.063 | 0.071 | 0.082 | 0.046 |
| MuB (n= 1) | ||||||||||
| Mean | NA | NA | NA | 1.240 | 1.080 | NA | 1.465 | NA | 1.670 | NA |
| SD | NA | NA | NA | NA | NA | NA | NA | NA | NA | NA |
| % Preservation | 0.00 | 0.00 | 0.00 | 100.00 | 100.00 | 0.00 | 100.00 | 0.00 | 100.00 | 0.00 |
| MuC (n= 7) | ||||||||||
| Mean | 5.875 | 2.933 | 3.726 | 1.640 | 1.386 | 1.634 | 2.200 | 1.803 | 2.409 | 2.226 |
| SD | 0.827 | 0.232 | 0.400 | 0.277 | 0.254 | 0.246 | 0.205 | 0.129 | 0.252 | 0.192 |
| % Preservation | 28.57 | 71.43 | 71.43 | 42.86 | 85.71 | 85.71 | 100.00 | 85.71 | 100.00 | 85.71 |
| CV | 0.141 | 0.079 | 0.107 | 0.169 | 0.183 | 0.151 | 0.093 | 0.072 | 0.105 | 0.086 |
| MuD (n= 1) | ||||||||||
| Mean | NA | NA | NA | NA | NA | 2.160 | NA | 2.135 | NA | 2.350 |
| SD | NA | NA | NA | NA | NA | NA | NA | NA | NA | NA |
| % Preservation | 0.00 | 0.00 | 0.00 | 0.00 | 0.00 | 100.00 | 0.00 | 100.00 | 0.00 | 100.00 |
| MuE (n= 5) | ||||||||||
| Mean | 8.275 | 4.213 | 5.155 | 2.475 | 1.933 | 2.488 | 3.076 | 2.375 | 3.416 | 3.053 |
| SD | 0.205 | 0.265 | 0.106 | 0.108 | 0.314 | 0.110 | 0.393 | 0.156 | 0.337 | 0.337 |
| % Preservation | 40.00 | 40.00 | 40.00 | 60.00 | 100.00 | 40.00 | 80.00 | 40.00 | 80.00 | 60.00 |
| CV | 0.025 | 0.063 | 0.021 | 0.044 | 0.162 | 0.044 | 0.128 | 0.066 | 0.099 | 0.110 |
| MuF (n= 6) | ||||||||||
| Mean | 13.865 | 7.192 | 9.548 | 3.740 | 3.174 | 4.334 | 5.221 | 4.826 | 5.777 | 5.220 |
| SD | 0.226 | 0.467 | 0.626 | 0.420 | 0.526 | 0.461 | 0.282 | 0.639 | 0.660 | 0.928 |
| % Preservation | 33.33 | 50.00 | 33.33 | 50.00 | 83.33 | 83.33 | 83.33 | 100.00 | 83.33 | 66.67 |
| CV | 0.016 | 0.065 | 0.066 | 0.112 | 0.166 | 0.106 | 0.054 | 0.133 | 0.114 | 0.178 |
APPENDIX 8.
Means, standard deviations, and percent preservation for therian measurements by morphotype. We include all specimens except for the specimen in morphotype MeA, which lacked any measureable features. See Table 1 for measurement descriptions; see Table 3 for data (data excludes minimum values). NA indicates no specimens preserved the measurement (i.e., NA for means) or only one specimen preserved the measurement (i.e., NA for SD). Bold values indicate specimen percent preservation (i.e., the number of specimens that preserve that measurement divided by the total number of specimens in the morphotype) greater than or equal to 80%. We calculate the coefficient of variation (CV) for morphotypes containing more than two specimens (i.e., only EuD). Abbreviations: CV, coefficient of variation; n, number of specimens; SD, standard deviation.
| TDW | AW | TLW | NCW | TW | CW | TL | CL | TD | CD | |
| Full Dataset (n = 14) | ||||||||||
| Mean | 9.560 | 7.189 | 7.414 | 4.713 | 2.438 | 4.836 | 3.084 | 3.026 | 2.708 | 4.416 |
| SD | 0.357 | 3.926 | 3.888 | 2.812 | 1.351 | 2.838 | 2.084 | 1.824 | 1.360 | 2.836 |
| % Preservation | 21.43 | 78.57 | 78.57 | 42.86 | 92.86 | 78.57 | 92.86 | 78.57 | 71.43 | 57.14 |
| EuA (n = 1) | ||||||||||
| Mean | NA | 3.850 | 3.850 | NA | 1.330 | 2.406 | 1.630 | 1.579 | 1.756 | 1.920 |
| SD | NA | NA | NA | NA | NA | NA | NA | NA | NA | NA |
| % Preservation | 0.00 | 100.00 | 100.00 | 0.00 | 100.00 | 100.00 | 100.00 | 100.00 | 100.00 | 100.00 |
| EuB (n = 1) | ||||||||||
| Mean | NA | 4.765 | 5.120 | NA | 1.705 | 2.895 | 1.960 | 1.945 | 2.355 | NA |
| SD | NA | NA | NA | NA | NA | NA | NA | NA | NA | NA |
| % Preservation | 0.00 | 100.00 | 100.00 | 0.00 | 100.00 | 100.00 | 100.00 | 100.00 | 100.00 | 0.00 |
| EuC (n = 2) | ||||||||||
| Mean | 9.520 | 5.635 | 5.735 | 3.918 | 1.670 | 3.945 | 2.680 | 2.515 | 3.095 | 3.310 |
| SD | NA | NA | NA | 0.138 | NA | NA | NA | NA | 0.092 | NA |
| % Preservation | 50.00 | 50.00 | 50.00 | 100.00 | 50.00 | 50.00 | 50.00 | 50.00 | 100.00 | 50.00 |
| EuD (n = 5) | ||||||||||
| Mean | 9.580 | 5.463 | 5.780 | 3.880 | 1.923 | 3.510 | 1.840 | 2.056 | 2.279 | 2.528 |
| SD | 0.502 | 0.223 | 0.310 | 0.467 | 0.168 | 0.245 | 0.221 | 0.221 | 0.129 | 0.168 |
| % Preservation | 40.00 | 100.00 | 100.00 | 40.00 | 100.00 | 100.00 | 100.00 | 100.00 | 80.00 | 60.00 |
| CV | 0.052 | 0.041 | 0.054 | 0.120 | 0.087 | 0.070 | 0.120 | 0.108 | 0.057 | 0.066 |
| EuE (n = 2) | ||||||||||
| Mean | NA | 10.118 | 10.275 | NA | 2.795 | 7.290 | 4.453 | 4.845 | 6.280 | 6.423 |
| SD | NA | 0.803 | 0.813 | NA | 0.219 | 0.467 | 0.173 | 0.375 | NA | 1.559 |
| % Preservation | 0.00 | 100.00 | 100.00 | 0.00 | 100.00 | 100.00 | 100.00 | 100.00 | 50.00 | 100.00 |
| EuF (n = 1) | ||||||||||
| Mean | NA | 17.280 | 17.395 | NA | 5.480 | 11.820 | 6.945 | 7.280 | NA | 9.670 |
| SD | NA | NA | NA | NA | NA | NA | NA | NA | NA | NA |
| % Preservation | 0.00 | 100.00 | 100.00 | 0.00 | 100.00 | 100.00 | 100.00 | 100.00 | 0.00 | 100.00 |
| EuG (n = 1) | ||||||||||
| Mean | NA | NA | NA | 10.300 | 5.095 | NA | 7.435 | NA | NA | NA |
| SD | NA | NA | NA | NA | NA | NA | NA | NA | NA | NA |
| % Preservation | 0.00 | 0.00 | 0.00 | 100.00 | 100.00 | 0.00 | 100.00 | 0.00 | 0.00 | 0.00 |
| ThA (n = 1) | ||||||||||
| Mean | NA | NA | NA | 2.380 | 1.210 | NA | 1.340 | NA | 1.380 | NA |
| SD | NA | NA | NA | NA | NA | NA | NA | NA | NA | NA |
| % Preservation | 0.00 | 0.00 | 0.00 | 100.00 | 100.00 | 0.00 | 100.00 | 0.00 | 100.00 | 0.00 |
APPENDIX 9.
The results of One-Way ANOVAs of difference for all multituberculate measurements across all morphotypes. Asterisks (****) indicate significant p-values (< 0.0001). Both biozone (b) and residuals (r) values are given for Sum of Squares, df, and Mean Squares. See Table 1 for measurement details; see Table 3 for data.
| TDW | AW | TLW | NCW | UCW | RCW | UCL | RCL | UCD | RCD | |||||||||||
| b | r | b | r | b | r | b | r | b | r | b | r | b | r | b | r | b | r | b | r | |
| Sum of Squares | 148.368 | 0.918 | 56.520 | 0.764 | 80.532 | 1.160 | 14.012 | 0.603 | 17.551 | 1.889 | 31.699 | 1.198 | 49.847 | 1.083 | 48.562 | 2.192 | 61.774 | 2.568 | 34.327 | 3.012 |
| df | 3 | 7 | 3 | 12 | 3 | 12 | 4 | 10 | 4 | 20 | 4 | 15 | 4 | 20 | 4 | 17 | 4 | 20 | 4 | 14 |
| Mean Squares | 49.456 | 0.131 | 18.840 | 0.064 | 26.844 | 0.097 | 3.503 | 0.060 | 4.388 | 0.094 | 7.925 | 0.080 | 12.462 | 0.054 | 12.141 | 0.129 | 15.444 | 0.128 | 8.582 | 0.215 |
| F | 377.07 | 295.97 | 277.59 | 58.10 | 46.45 | 99.19 | 230.16 | 94.17 | 120.27 | 39.89 | ||||||||||
| p-value | **** | **** | **** | **** | **** | **** | **** | **** | **** | **** | ||||||||||
APPENDIX 10.
Probabilities from Tukey honest significant difference (HSD) post hoc test of multituberculate measurements by morphotype. All measurements had significant ANOVA results, and therefore all measurements were subjected to the Tukey HSD test and have results below. Significance indicated by the following: * for p < 0.05; ** for p < 0.01; *** for p < 0.001; **** for p < 0.0001. NA indicates the morphotype did not include that particular measurement and therefore could not be subjected to ANOVA or Tukey tests.
| Measurement | MuA | MuB | MuC | MuD | MuE | MuF | |
| TDW | MuA | - | NA | ** | NA | **** | **** |
| MuB | NA | - | NA | NA | NA | NA | |
| MuC | ** | NA | - | NA | ** | **** | |
| MuD | NA | NA | NA | - | NA | NA | |
| MuE | **** | NA | ** | NA | - | **** | |
| MuF | **** | NA | **** | NA | **** | - | |
| AW | MuA | - | NA | *** | NA | **** | **** |
| MuB | NA | - | NA | NA | NA | NA | |
| MuC | *** | NA | - | NA | *** | **** | |
| MuD | NA | NA | NA | - | NA | NA | |
| MuE | **** | NA | *** | NA | - | **** | |
| MuF | **** | NA | **** | NA | **** | - | |
| TLW | MuA | - | NA | *** | NA | **** | **** |
| MuB | NA | - | NA | NA | NA | NA | |
| MuC | *** | NA | - | NA | *** | **** | |
| MuD | NA | NA | NA | - | NA | NA | |
| MuE | **** | NA | *** | NA | - | **** | |
| MuF | **** | NA | **** | NA | **** | - | |
| NCW | MuA | - | 1.000 | 0.158 | NA | *** | **** |
| MuB | 1.000 | - | 0.635 | NA | ** | **** | |
| MuC | 0.158 | 0.635 | - | NA | * | **** | |
| MuD | NA | NA | NA | - | NA | NA | |
| MuE | *** | ** | * | NA | - | *** | |
| MuF | **** | **** | **** | NA | *** | - | |
| UCW | MuA | - | 0.968 | * | NA | *** | **** |
| MuB | 0.968 | - | 0.885 | NA | 0.123 | **** | |
| MuC | * | 0.885 | - | NA | 0.056 | **** | |
| MuD | NA | NA | NA | - | NA | NA | |
| MuE | *** | 0.123 | 0.056 | NA | - | **** | |
| MuF | **** | **** | **** | NA | **** | - | |
| RCW | MuA | - | NA | * | * | *** | **** |
| MuB | NA | - | NA | NA | NA | NA | |
| MuC | * | NA | - | 0.451 | * | **** | |
| MuD | * | NA | 0.451 | - | 0.874 | **** | |
| MuE | *** | NA | * | 0.874 | - | **** | |
| MuF | **** | NA | **** | **** | **** | - | |
| UCL | MuA | - | 0.993 | **** | NA | **** | **** |
| MuB | 0.993 | - | 0.054 | NA | **** | **** | |
| MuC | **** | 0.054 | - | NA | *** | **** | |
| MuD | NA | NA | NA | - | NA | NA | |
| MuE | **** | **** | *** | NA | - | **** | |
| MuF | **** | **** | **** | NA | **** | - | |
| RCL | MuA | - | NA | * | 0.114 | ** | **** |
| MuB | NA | - | NA | NA | NA | NA | |
| MuC | * | NA | - | 0.908 | 0.329 | **** | |
| MuD | 0.114 | NA | 0.908 | - | 0.981 | **** | |
| MuE | ** | NA | 0.329 | 0.981 | - | **** | |
| MuF | **** | NA | **** | **** | **** | - | |
| UCD | MuA | - | 0.986 | *** | NA | **** | **** |
| MuB | 0.986 | - | 0.335 | NA | ** | **** | |
| MuC | *** | 0.335 | - | NA | ** | **** | |
| MuD | NA | NA | NA | - | NA | NA | |
| MuE | **** | ** | ** | NA | - | **** | |
| MuF | **** | **** | **** | NA | **** | - | |
| RCD | MuA | - | NA | 0.123 | 0.473 | ** | **** |
| MuB | NA | - | NA | NA | NA | NA | |
| MuC | 0.123 | NA | - | 0.999 | 0.141 | **** | |
| MuD | 0.473 | NA | 0.999 | - | 0.688 | *** | |
| MuE | ** | NA | 0.141 | 0.688 | - | *** | |
| MuF | **** | NA | **** | *** | *** | - |
APPENDIX 11.
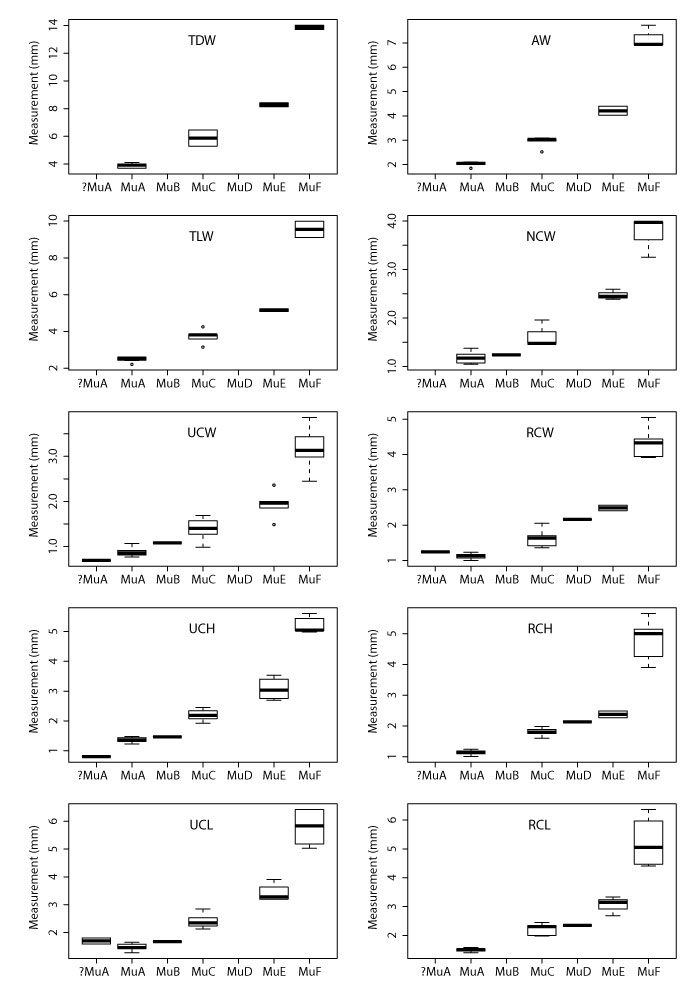
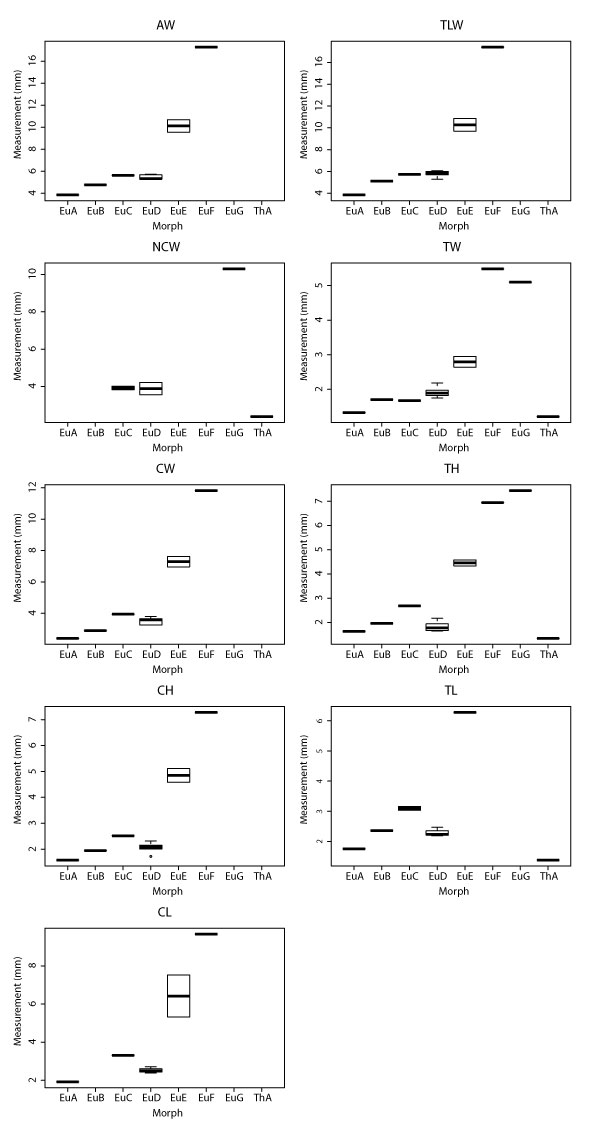
Boxplots for all multituberculate measurement with significant ANOVA results according to morphotype. Boxplots include minimum, quartiles, median, and maximum values. See Table 1 for measurements, Table 2 for data, and Appendix 9-Appendix 10 for ANOVA and Tukey HSD results, respectively. Specimens tentatively attributed to morphotype MuA (i.e., ?MuA), were not included in ANOVA and Tukey tests.
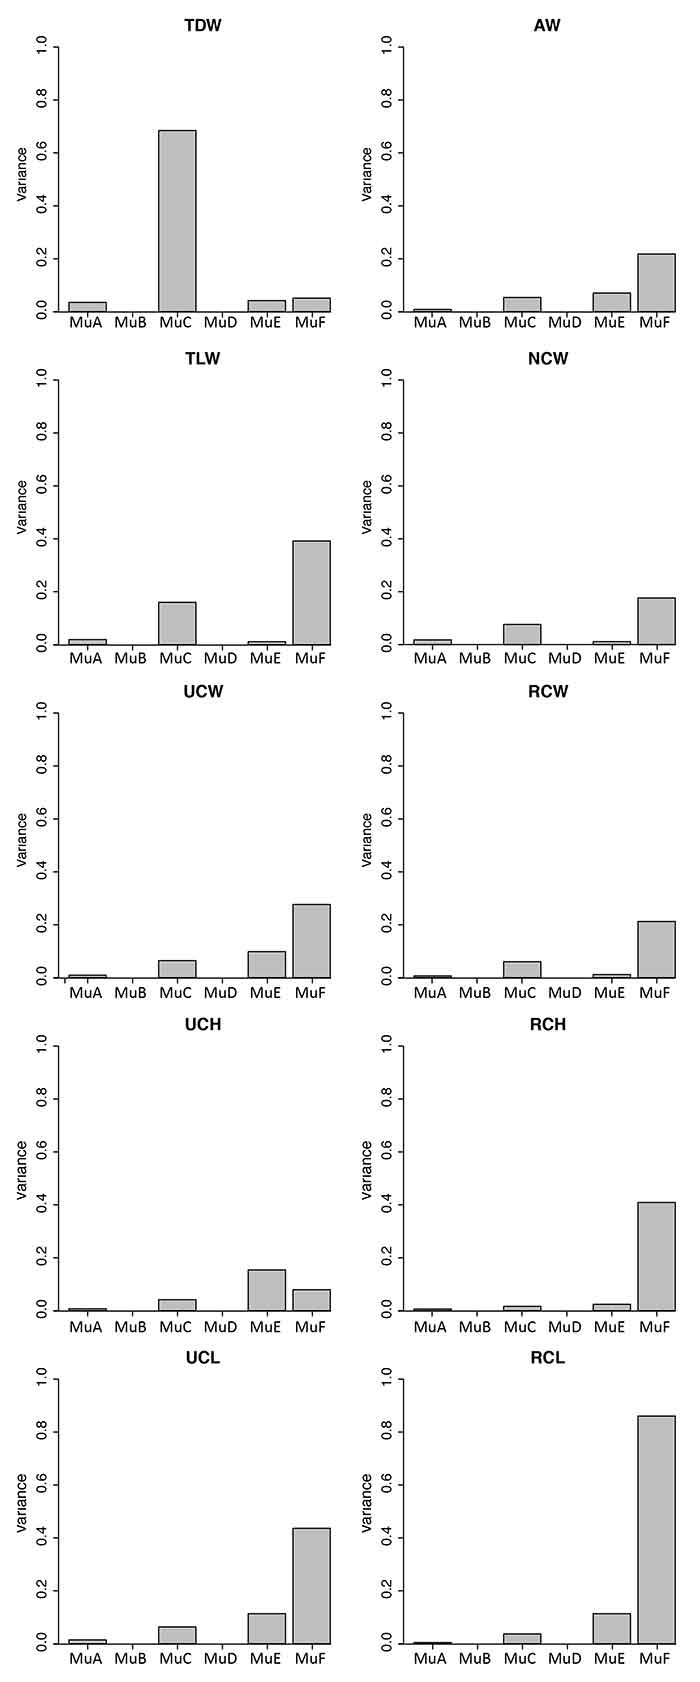
APPENDIX 12.
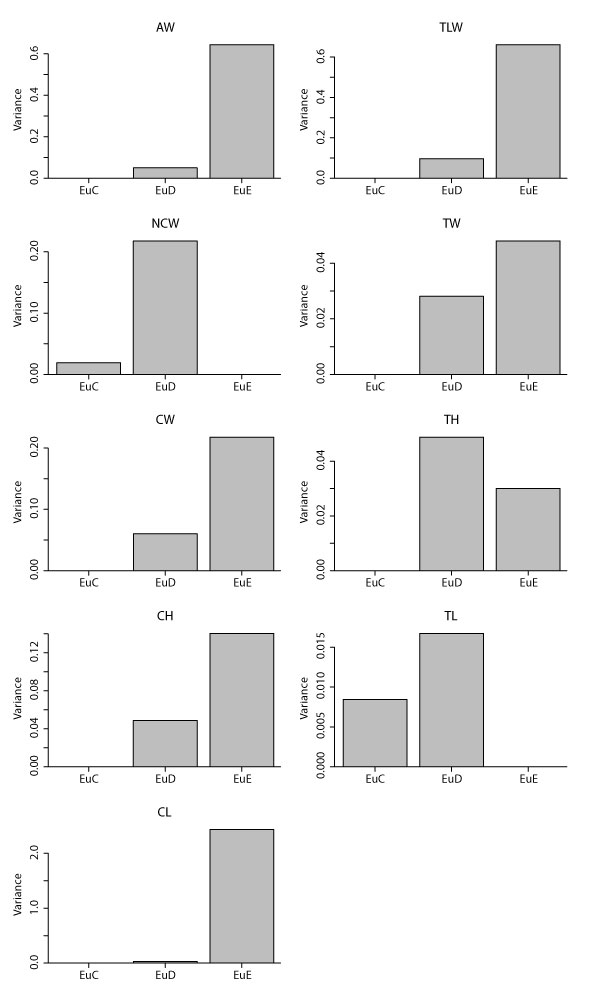
Variances for all multituberculate measurement with significant ANOVA results according to morphotype. See Appendix 2 for means, maxima, minima, and quartiles. See Table 1 for measurements, Table 2 for data, and Appendix 9-Appendix 10 for ANOVA and Tukey HSD results, respectively.
APPENDIX 13.
Principal Components 1 and 2 on the full set of variables (i.e., measurements; excluding TDW, AW, and TLW; n = 10 specimens). All measurements are standardized to (i.e., “relative to”) RCW. The first and second principal components explain 64% and 20% of the variation, respectively. See Appendix 14 for all principal component loadings and variances. Plotted multituberculate morphotypes include: MuA (blue), MuC (red), MuE (orange), and MuF (green). See Table 1 for measurements and Table 2 for data.
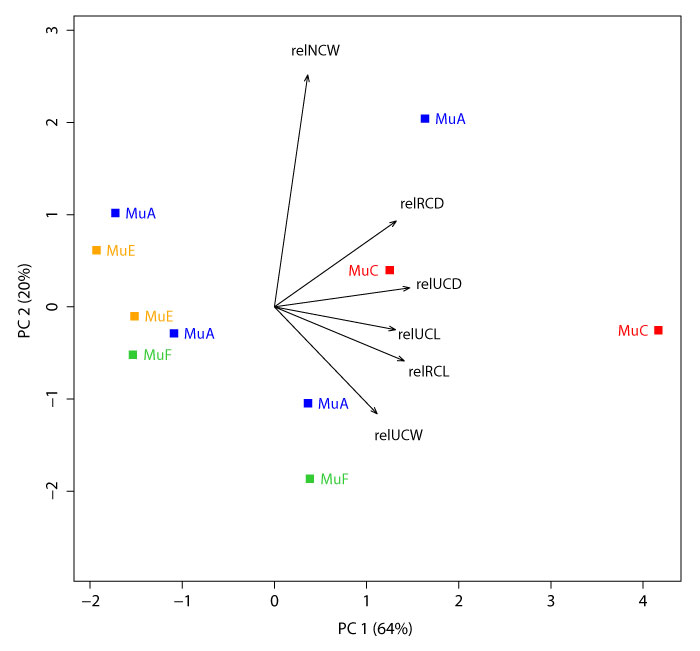
APPENDIX 14.
Measurement loading and variance results of Principal Components Analysis on linear measurements of multituberculate specimens from our assemblage (n = 10). Measurements include NCW, RCL, RCD, UCL, UCD, and UCW, all standardized to RCW (Table 1; Appendix 13). Loadings in bold represent dominant loadings for each principal component (i.e., values greater than (1/(number of columns)2).
| PC1 | PC2 | PC3 | PC4 | PC5 | PC6 | |
| Loadings | ||||||
| relUCD | 0.490 | 0.069 | 0.120 | 0.354 | -0.130 | 0.774 |
| relRCL | 0.470 | -0.196 | -0.096 | -0.236 | 0.822 | -0.019 |
| relRCD | 0.441 | 0.311 | -0.206 | 0.597 | -0.044 | -0.556 |
| relUCL | 0.438 | -0.083 | -0.537 | -0.527 | -0.485 | -0.027 |
| relNCW | 0.121 | 0.839 | 0.329 | -0.413 | 0.050 | -0.004 |
| relUCW | 0.372 | -0.387 | 0.733 | -0.122 | -0.261 | -0.303 |
| Variance | ||||||
| Percent Variance | 0.637 | 0.199 | 0.085 | 0.048 | 0.022 | 0.009 |
| Cumulative Variance | 0.637 | 0.836 | 0.921 | 0.969 | 0.991 | 1.000 |
APPENDIX 15.
Principal Components 1 and 2 on measurements NCW, RCL, UCL, and UCW, and standardized to (i.e., “relative to”) RCW. The first and second principal components explain 61% and 23% of the variation, respectively. See Appendix 16 for all principal component loadings and variances. Plotted multituberculate morphotypes include: MuA (blue), MuC (red), MuE (orange), and MuF (green). This dataset is similar to that of Appendix 13, but excludes measurement RCD and includes one additional specimen (n = 11). See Table 1 for measurements and Table 2 for data.
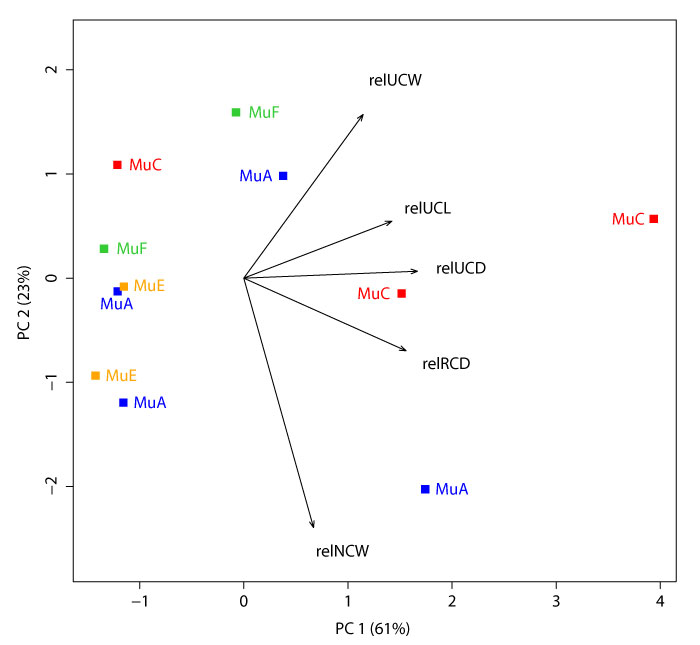
APPENDIX 16.
Measurement loading and variance results of Principal Components Analysis on linear measurements of multituberculate specimens from our assemblage (n = 11). Measurements include NCW, RCD, UCL, UCD, and UCW, all standardized to RCW (Table 1; Appendix 15). Loadings in bold represent dominant loadings for each principal component.
| PC1 | PC2 | PC3 | PC4 | PC5 | |
| Loadings | |||||
| relUCD | 0.556 | 0.022 | 0.092 | -0.309 | -0.766 |
| relRCD | 0.519 | -0.232 | -0.201 | -0.557 | 0.571 |
| relUCL | 0.474 | 0.183 | -0.602 | 0.615 | 0.030 |
| relNCW | 0.223 | -0.798 | 0.366 | 0.423 | 0.012 |
| relUCW | 0.382 | 0.524 | 0.674 | 0.196 | 0.294 |
| Variance | |||||
| Percent Variance | 0.608 | 0.231 | 0.099 | 0.052 | 0.010 |
| Cumulative Variance | 0.608 | 0.839 | 0.938 | 0.990 | 1.000 |
APPENDIX 17.
Principal Components 1 and 2 on measurements NCW, RCL, UCL, and UCW, and standardized to (“relative to”) RCW, see Table 1 for measurements. The first and second principal components explain 44% and 24% of the variation, respectively. See Appendix 18 for all principal component loadings and variances. Plotted multituberculate morphotypes include: MuA (blue), MuC (red), MuE (orange), and MuF (green; Table 2); published specimens include: ?Cimexomys minor, UMVP 1404 (Deischl 1964); Microcosmodon conus, UALVP 42816 (Fox 2005); Mesodma formosa, UMVP 1405 (Deischl 1964); M. thompsoni (A), UMVP 1406 (Deischl 1964); M. thompsoni (B), UMVP 1403 (Deischl 1964); Multituberculata, AMNH 118267 (Kielan-Jaworowska and Gambaryan 1994); Stygimys kuszmauli (C), UA 11994 (Krause and Jenkins 1983); and S. kuszmauli (D), UMVP 1407 (Deischl 1964; Krause and Jenkins 1983); see Appendix 3 for additional details on published material.
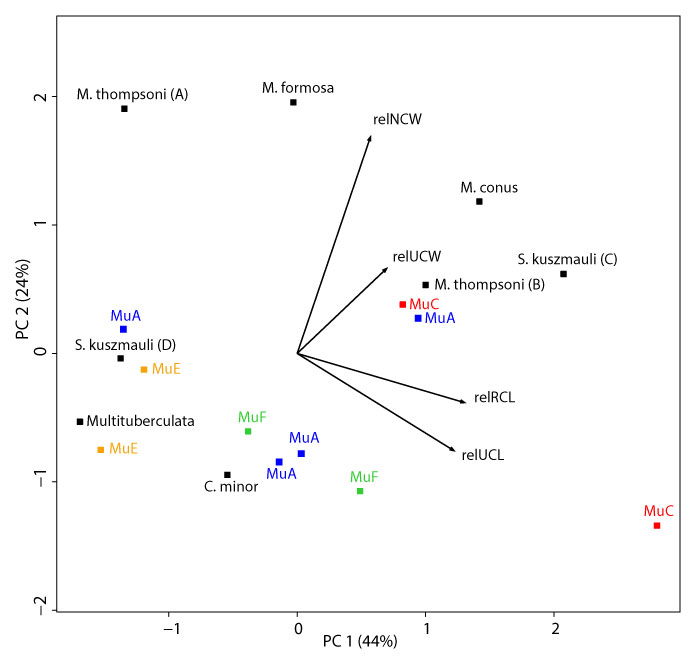
APPENDIX 18.
Measurement loading and variance results of Principal Components Analysis on linear measurements of multituberculate specimens. Measurements include NCW, RCL, UCL, and UCW, all standardized to RCW (Table 1; Appendix 17). Specimens include nine specimens from our assemblage and seven specimens from the published literature (see Appendix 17 for more details). Loadings in bold represent dominant loadings for each principal component.
| PC1 | PC2 | PC3 | PC4 | |
| Loadings | ||||
| relRCL | 0.652 | -0.191 | -0.100 | -0.727 |
| relUCL | 0.610 | -0.379 | -0.182 | 0.672 |
| relNCW | 0.285 | 0.843 | -0.446 | 0.095 |
| relUCW | 0.348 | 0.331 | 0.871 | 0.106 |
| Variance | ||||
| Percent Variance | 0.435 | 0.238 | 0.224 | 0.103 |
| Cumulative Variance | 0.435 | 0.673 | 0.897 | 1.000 |
APPENDIX 19.
The results of One-Way ANOVAs of difference for all therians measurements across all morphotypes. Significance indicated by the following: * for p < 0.05; ** for p < 0.01; *** for p < 0.001; **** for p < 0.0001. Both biozone (b) and residuals (r) values are given for Sum of Squares, df, and Mean Squares. See Table 1 for measurement details; see Table 3 for data.
| TDW | AW | TLW | NCW | UCW | RCW | UCL | RCL | UCD | RCD | |||||||||||
| b | r | b | r | b | r | b | r | b | r | b | r | b | r | b | r | b | r | b | r | |
| Sum of Squares | 0.002 | 0.252 | 153.315 | 0.844 | 150.124 | 1.047 | 39.311 | 0.237 | 21.757 | 0.161 | 80.078 | 0.459 | 51.904 | 0.225 | 32.942 | 0.336 | 16.590 | 0.059 | 53.800 | 2.487 |
| df | 1 | 1 | 5 | 5 | 5 | 5 | 3 | 2 | 7 | 5 | 5 | 5 | 7 | 5 | 5 | 5 | 5 | 4 | 4 | 3 |
| Mean Squares | 0.002 | 0.252 | 30.663 | 0.169 | 30.025 | 0.209 | 13.104 | 0.118 | 3.108 | 0.032 | 16.016 | 0.092 | 7.415 | 0.045 | 6.588 | 0.067 | 3.318 | 0.015 | 13.450 | 0.829 |
| F | 0.010 | 181.730 | 143.440 | 110.667 | 96.810 | 174.614 | 164.692 | 98.036 | 226.415 | 16.223 | ||||||||||
| p-value | 0.938 | **** | **** | ** | **** | **** | **** | **** | **** | * | ||||||||||
APPENDIX 20.
Probabilities from Tukey honest significant difference (HSD) post hoc test of therian measurements by morphotype. Measurements subjected to the Tukey HSD test are those with significant ANOVA results (i.e., all measurements except TDW); see Table 1 for measurements and Table 3 for data. Significance indicated by the following: * for p < 0.05; ** for p < 0.01; *** for p < 0.001; **** for p < 0.0001. NA indicates the morphotype did not include that particular measurement and therefore could not be subjected to ANOVA or Tukey tests.
| EuA | EuB | EuC | EuD | EuE | EuF | EuG | ThA | ||
| AW | EuA | - | 0.643 | 0.155 | 0.094 | *** | **** | NA | NA |
| EuB | 0.643 | - | 0.681 | 0.655 | *** | **** | NA | NA | |
| EuC | 0.155 | 0.681 | - | 0.998 | ** | **** | NA | NA | |
| EuD | 0.094 | 0.655 | 0.998 | - | *** | **** | NA | NA | |
| EuE | *** | *** | ** | *** | - | *** | NA | NA | |
| EuF | **** | **** | **** | **** | *** | - | NA | NA | |
| EuG | NA | NA | NA | NA | NA | NA | - | NA | |
| ThA | NA | NA | NA | NA | NA | NA | NA | - | |
| TLW | EuA | - | 0.463 | 0.182 | 0.073 | *** | **** | NA | NA |
| EuB | 0.463 | - | 0.916 | 0.769 | ** | **** | NA | NA | |
| EuC | 0.182 | 0.916 | - | 1.000 | ** | *** | NA | NA | |
| EuD | 0.073 | 0.769 | 1.000 | - | *** | **** | NA | NA | |
| EuE | *** | ** | ** | *** | - | *** | NA | NA | |
| EuF | **** | **** | *** | **** | *** | - | NA | NA | |
| EuG | NA | NA | NA | NA | NA | NA | - | NA | |
| ThA | NA | NA | NA | NA | NA | NA | NA | - | |
| NCW | EuA | - | NA | NA | NA | NA | NA | NA | NA |
| EuB | NA | - | NA | NA | NA | NA | NA | NA | |
| EuC | NA | NA | - | 0.999 | NA | NA | * | 0.162 | |
| EuD | NA | NA | 0.999 | - | NA | NA | * | 0.169 | |
| EuE | NA | NA | NA | NA | - | NA | NA | NA | |
| EuF | NA | NA | NA | NA | NA | - | NA | NA | |
| EuG | NA | NA | * | * | NA | NA | - | ** | |
| ThA | NA | NA | 0.162 | 0.169 | NA | NA | ** | - | |
| TW | EuA | - | 0.794 | 0.852 | 0.219 | * | *** | *** | 0.999 |
| EuB | 0.794 | - | 1.000 | 0.929 | * | *** | *** | 0.574 | |
| EuC | 0.852 | 1.000 | - | 0.872 | * | *** | *** | 0.638 | |
| EuD | 0.219 | 0.929 | 0.872 | - | * | *** | *** | 0.126 | |
| EuE | * | * | * | * | - | *** | ** | ** | |
| EuF | *** | *** | *** | *** | *** | - | 0.776 | *** | |
| EuG | *** | *** | *** | *** | ** | 0.776 | - | *** | |
| ThA | 0.999 | 0.574 | 0.638 | 0.123 | ** | *** | *** | - | |
| CW | EuA | - | 0.847 | 0.093 | 0.121 | *** | **** | NA | NA |
| EuB | 0.847 | - | 0.289 | 0.511 | *** | **** | NA | NA | |
| EuC | 0.093 | 0.289 | - | 0.771 | ** | *** | NA | NA | |
| EuD | 0.121 | 0.511 | 0.771 | - | *** | **** | NA | NA | |
| EuE | *** | *** | ** | *** | - | *** | NA | NA | |
| EuF | **** | **** | *** | **** | *** | - | NA | NA | |
| EuG | NA | NA | NA | NA | NA | NA | - | NA | |
| ThA | NA | NA | NA | NA | NA | NA | NA | - | |
| TL | EuA | - | 0.932 | 0.139 | 0.972 | ** | *** | *** | 0.962 |
| EuB | 0.932 | - | 0.391 | 0.999 | ** | *** | *** | 0.524 | |
| EuC | 0.139 | 0.391 | - | 0.125 | * | *** | *** | 0.059 | |
| EuD | 0.972 | 0.999 | 0.125 | - | *** | **** | **** | 0.487 | |
| EuE | ** | ** | * | *** | - | ** | *** | *** | |
| EuF | *** | *** | *** | **** | ** | - | 0.724 | *** | |
| EuG | *** | *** | *** | **** | *** | 0.724 | - | **** | |
| ThA | 0.962 | 0.524 | 0.059 | 0.487 | *** | *** | **** | - | |
| CL | EuA | - | 0.901 | 0.261 | 0.592 | ** | *** | NA | NA |
| EuB | 0.901 | - | 0.653 | 0.998 | ** | *** | NA | NA | |
| EuC | 0.261 | 0.653 | - | 0.623 | ** | *** | NA | NA | |
| EuD | 0.592 | 0.998 | 0.623 | - | *** | *** | NA | NA | |
| EuE | ** | ** | ** | *** | - | ** | NA | NA | |
| EuF | *** | *** | *** | *** | ** | - | NA | NA | |
| EuG | NA | NA | NA | NA | NA | NA | - | NA | |
| ThA | NA | NA | NA | NA | NA | NA | NA | - | |
| TD | EuA | - | 0.128 | ** | 0.096 | *** | NA | NA | 0.393 |
| EuB | 0.128 | - | * | 0.989 | *** | NA | NA | * | |
| EuC | ** | * | - | ** | *** | NA | NA | ** | |
| EuD | 0.096 | 0.989 | ** | - | *** | NA | NA | * | |
| EuE | *** | *** | *** | *** | - | NA | NA | *** | |
| EuF | NA | NA | NA | NA | NA | - | NA | NA | |
| EuG | NA | NA | NA | NA | NA | NA | - | NA | |
| ThA | 0.393 | * | ** | * | *** | NA | NA | - | |
| CD | EuA | - | NA | 0.810 | 0.970 | 0.101 | * | NA | NA |
| EuB | NA | - | NA | NA | NA | NA | NA | NA | |
| EuC | 0.810 | NA | - | 0.932 | 0.235 | 0.060 | NA | NA | |
| EuD | 0.970 | NA | 0.932 | - | 0.069 | * | NA | NA | |
| EuE | 0.101 | NA | 0.235 | 0.069 | - | 0.215 | NA | NA | |
| EuF | * | NA | 0.060 | * | 0.215 | - | NA | NA | |
| EuG | NA | NA | NA | NA | NA | NA | - | NA |
APPENDIX 21.
Boxplots for all therian measurement with significant ANOVA results according to morphotype (i.e., all measurement except TDW). Boxplots include minimum, quartiles, median, and maximum values. See Table 1 for measurements, Table 3 for data, and Appendix 19-Appendix 20 for ANOVA and Tukey HSD results, respectively. The specimen attributed to morphotype MeA was not included in ANOVA and Tukey tests because it lacked any morphologies preserving our measurements.
APPENDIX 22.
Variances for therian measurements with significant ANOVA results according to morphotype (i.e., all measurements except TDW) and preserving at least two specimens (i.e., only EuC, EuD, and EuE; see Appendix 8). See Appendix 21 for means, maxima, minima, and quartiles. See Table 1 for measurements, Table 3 for data, and Appendix 19-Appendix 20 for ANOVA and Tukey HSD results, respectively.
APPENDIX 23.
Means and standard deviations for multituberculate measurements for entire dataset and by biozone. For measurement descriptions see Table 1; for data see Table 2. NA indicates no specimens preserved the measurement (i.e., NA for mean) or only one specimen preserved the measurement (i.e., NA for SD). Bold values indicate specimen percent preservation (i.e., the number of specimens that preserve that measurement divided by the total number of specimens) greater than or equal to 80%. Abbreviations: BCA, Bug Creek Anthills specimens of mixed age (see text for details); n, number of specimens; Pu1, early Puercan 1 biozone; Pu3, late Puercan biozone; SD, standard deviation.
| TDW | AW | TLW | NCW | UCW | RCW | UCL | RCL | UCD | RCD | |
| Full Dataset (n = 30) | ||||||||||
| Mean | 6.859 | 3.551 | 4.089 | 2.049 | 1.639 | 2.219 | 2.576 | 2.482 | 2.826 | 2.801 |
| SD | 3.864 | 1.954 | 2.334 | 1.022 | 0.903 | 1.302 | 1.472 | 1.555 | 1.607 | 1.440 |
| % Preservation | 36.67 | 53.33 | 53.33 | 50.00 | 86.67 | 70.00 | 86.67 | 73.33 | 90.00 | 63.33 |
| Lancian (n = 11) | ||||||||||
| Mean | 10.475 | 5.232 | 6.199 | 3.066 | 2.243 | 3.151 | 3.627 | 3.587 | 4.145 | 3.650 |
| SD | 5.874 | 2.709 | 3.891 | 1.390 | 1.194 | 1.474 | 1.950 | 1.687 | 2.018 | 1.806 |
| % Preservation | 27.27 | 45.45 | 36.36 | 36.36 | 81.82 | 81.82 | 81.82 | 90.91 | 81.82 | 72.73 |
| BCA (n = 12) | ||||||||||
| Mean | 5.366 | 2.686 | 3.194 | 1.723 | 1.220 | 1.530 | 1.844 | 1.438 | 2.009 | 2.135 |
| SD | 2.054 | 1.006 | 1.177 | 0.637 | 0.485 | 0.621 | 0.732 | 0.586 | 0.828 | 0.800 |
| % Preservation | 58.33 | 66.67 | 75.00 | 66.67 | 100.00 | 66.67 | 91.67 | 66.67 | 91.67 | 66.67 |
| Pu1 (n = 4) | ||||||||||
| Mean | 6.460 | 3.090 | 4.250 | 1.960 | 1.965 | 1.470 | 2.653 | 1.858 | 2.595 | 2.335 |
| SD | NA | NA | NA | NA | 0.559 | 0.325 | 0.764 | 0.039 | 0.970 | NA |
| % Preservation | 25.00 | 25.00 | 25.00 | 25.00 | 50.00 | 50.00 | 75.00 | 50.00 | 100.00 | 25.00 |
| Pu3 (n = 3) | ||||||||||
| Mean | NA | 3.038 | 3.818 | 1.360 | 1.285 | 1.530 | 2.033 | 1.760 | 2.177 | 2.300 |
| SD | NA | 0.004 | 0.004 | 0.170 | 0.213 | 0.156 | 0.511 | 0.007 | 0.447 | 0.007 |
| % Preservation | 0.00 | 66.67 | 66.67 | 66.67 | 100.00 | 66.67 | 100.00 | 66.67 | 100.00 | 66.67 |
APPENDIX 24.
Means and standard deviations for therian measurements by biozone. We include all specimens except for the specimen in morphotype MeA, which lacked any measureable features. For measurement descriptions see Table 1; for data see Table 3 (data excludes minimum values). NA indicates no specimens preserved the measurement (i.e., NA for means) or only one specimen preserved the measurement (i.e., NA for SD). Bold values indicate specimen percent preservation (i.e., the number of specimens that preserve that measurement divided by the total number of specimens) greater than or equal to 80%. Abbreviations: BCA, Bug Creek Anthills specimens of mixed age (see text for details); n, number of specimens; Pu1, early Puercan 1 biozone; Pu3, late Puercan biozone; SD, standard deviation.
| TDW | AW | TLW | NCW | TW | CW | TL | CL | TD | CD | |
| Full Dataset (n = 14) | ||||||||||
| Mean | 9.560 | 7.189 | 7.414 | 4.713 | 2.438 | 4.836 | 3.084 | 3.026 | 2.708 | 4.416 |
| SD | 0.357 | 3.926 | 3.888 | 2.812 | 1.351 | 2.838 | 2.084 | 1.824 | 1.360 | 2.836 |
| % Preservation | 21.43 | 78.57 | 78.57 | 42.86 | 92.86 | 78.57 | 92.86 | 78.57 | 71.43 | 57.14 |
| Lancian (n = 2) | ||||||||||
| Mean | NA | 4.765 | 5.120 | 2.380 | 1.458 | 2.895 | 1.650 | 1.945 | 1.868 | NA |
| SD | NA | NA | NA | NA | 0.350 | NA | 0.438 | NA | 0.689 | NA |
| % Preservation | 0.00 | 50.00 | 50.00 | 50.00 | 100.00 | 50.00 | 100.00 | 50.00 | 100.00 | 0.00 |
| BCA (n = 6) | ||||||||||
| Mean | 9.560 | 5.492 | 5.773 | 3.860 | 1.881 | 3.583 | 1.980 | 2.133 | 2.429 | 2.724 |
| SD | 0.357 | 0.212 | 0.278 | 0.332 | 0.182 | 0.282 | 0.396 | 0.272 | 0.354 | 0.414 |
| % Preservation | 50.00 | 100.00 | 100.00 | 50.00 | 100.00 | 100.00 | 100.00 | 100.00 | 83.33 | 66.67 |
| Pu1 (n = 2) | ||||||||||
| Mean | NA | 10.685 | 10.850 | 4.015 | 2.950 | 7.620 | 4.575 | 5.110 | 4.720 | 7.525 |
| SD | NA | NA | NA | NA | NA | NA | NA | NA | 2.206 | NA |
| % Preservation | 0.00 | 50.00 | 50.00 | 50.00 | 50.00 | 50.00 | 50.00 | 50.00 | 100.00 | 50.00 |
| Pu3 (n = 4) | ||||||||||
| Mean | NA | 10.227 | 10.315 | 10.300 | 3.636 | 7.062 | 5.085 | 4.480 | 1.756 | 5.637 |
| SD | NA | 6.741 | 6.793 | NA | 1.987 | 4.708 | 2.676 | 2.852 | NA | 3.885 |
| % Preservation | 0.00 | 75.00 | 75.00 | 25.00 | 100.00 | 75.00 | 100.00 | 75.00 | 25.00 | 75.00 |
APPENDIX 25.
The results of One-Way ANOVAs of difference for all multituberculate measurements across all biozones. Asterisk indicates significant p-values (< 0.05). Both biozone (b) and residuals (r) values are given for Sum of Squares, df, and Mean Squares. See Table 1 for measurement details; see Table 2 for data and Appendix 26 for Tukey HSD results.
| TDW | AW | TLW | NCW | UCW | RCW | UCL | RCL | UCD | RCD | |||||||||||
| b | r | b | r | b | r | b | r | b | r | b | r | b | r | b | r | b | r | b | r | |
| Sum of Squares | 54.980 | 94.306 | 20.851 | 36.433 | 25.180 | 56.513 | 5.946 | 8.669 | 5.972 | 14.405 | 13.689 | 20.215 | 16.729 | 37.464 | 22.739 | 28.015 | 24.477 | 42.655 | 10.034 | 27.305 |
| df | 2 | 8 | 3 | 12 | 3 | 12 | 3 | 11 | 3 | 22 | 3 | 17 | 3 | 22 | 3 | 18 | 3 | 23 | 3 | 15 |
| Mean Squares | 27.490 | 11.788 | 6.950 | 3.036 | 8.393 | 4.709 | 1.982 | 0.788 | 1.991 | 0.655 | 4.563 | 1.189 | 5.576 | 1.703 | 7.580 | 1.556 | 8.159 | 1.855 | 3.345 | 1.820 |
| F | 2.332 | 2.289 | 1.782 | 2.515 | 3.040 | 3.837 | 3.275 | 4.870 | 4.399 | 1.837 | ||||||||||
| p-value | 0.159 | 0.130 | 0.130 | 0.112 | 0.050 | * | * | * | * | 0.184 | ||||||||||
APPENDIX 26.
Probabilities from Tukey honest significant difference (HSD) post hoc test of multituberculate measurements by biozones. Measurements subjected to the Tukey HSD test are those with significant ANOVA results: radial condyle width (RCW), ulnar condyle length (UCL), radial condyle length (RCL), and ulnar condyle depth (UCD). Significance indicated by the following: * for p < 0.05; ** for p < 0.01.
| Measurement | Lancian | BCA | Pu1 | Pu3 | |
| RCW | Lancian | - | * | 0.237 | 0.264 |
| BCA | * | - | 1.000 | 1.000 | |
| Pu1 | 0.237 | 1.000 | - | 1.000 | |
| Pu3 | 0.264 | 1.000 | 1.000 | - | |
| UCL | Lancian | - | * | 0.682 | 0.286 |
| BCA | * | - | 0.777 | 0.996 | |
| Pu1 | 0.682 | 0.777 | - | 0.936 | |
| Pu3 | 0.286 | 0.996 | 0.936 | - | |
| RCL | Lancian | - | ** | 0.310 | 0.267 |
| BCA | ** | - | 0.973 | 0.988 | |
| Pu1 | 0.310 | 0.973 | - | 1.000 | |
| Pu3 | 0.267 | 0.988 | 1.000 | - | |
| UCD | Lancian | - | * | 0.258 | 0.162 |
| BCA | * | - | 0.881 | 0.998 | |
| Pu1 | 0.258 | 0.881 | - | 0.977 | |
| Pu3 | 0.162 | 0.998 | 0.977 | - | |
APPENDIX 27.
Boxplots (above) and variances (below) for each multituberculate measurement with significant ANOVA results according to biozone. Boxplots include minimum, quartiles, median, and maximum values. See Table 1 for measurements, Table 2 for data, Appendix 7 for means, and Appendix 25-Appendix 26 for ANOVA and Tukey HSD results, respectively. Asterisks indicate pairs of significantly different values in Tukey tests (i.e., Lancian specimens are significantly larger than BCA specimens for all measurements).
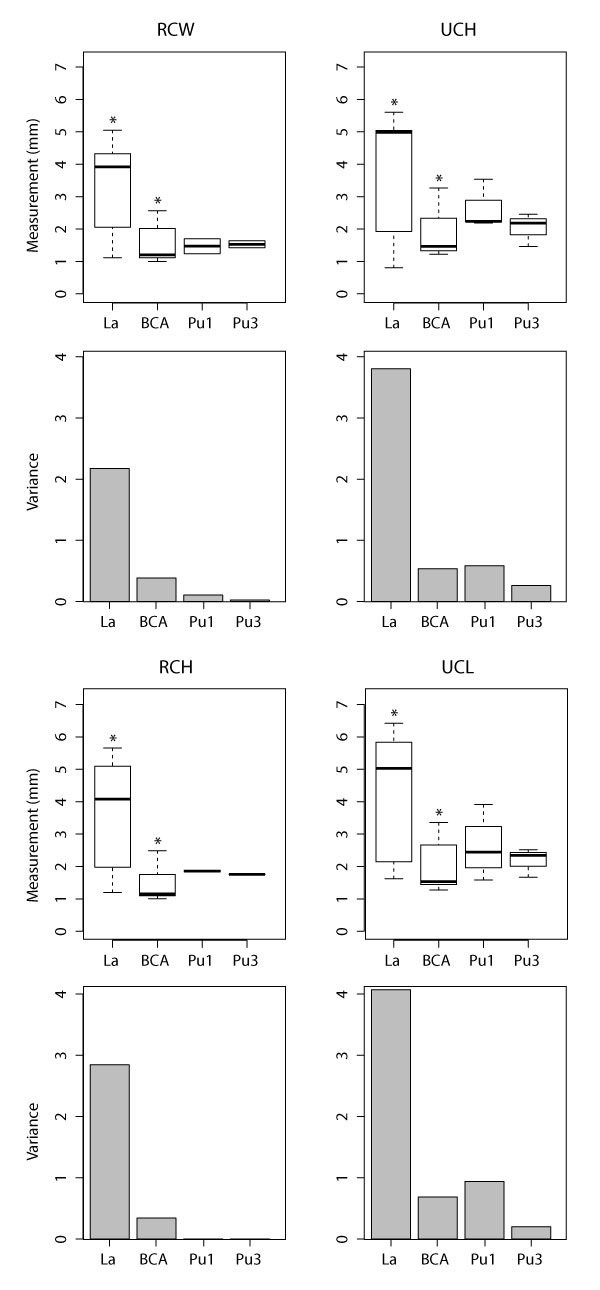
APPENDIX 28.
The results of One-Way ANOVAs of difference for all therians measurements across all biozones (for all measurements with specimens in at least three biozones, i.e., excluding TDW). Significance is as follows: * for p < 0.05; ** for p < 0.01. Both biozone (b) and residuals (r) values are given for Sum of Squares, df, and Mean Squares. See Table 1 for measurement details and Table 3 for data.
| AW | TLW | NCW | TW | CW | TL | CL | TD | CD | ||||||||||
| b | r | b | r | b | r | b | r | b | r | b | r | b | r | b | r | b | r | |
| Sum of Squares | 63.066 | 91.093 | 58.483 | 92.688 | 39.327 | 0.220 | 9.791 | 12.127 | 35.811 | 44.726 | 29.665 | 22.464 | 16.641 | 16.637 | 10.805 | 5.844 | 25.591 | 30.696 |
| df | 3 | 7 | 3 | 7 | 3 | 2 | 3 | 9 | 3 | 7 | 3 | 9 | 3 | 7 | 3 | 6 | 2 | 5 |
| Mean Squares |
21.022 | 13.013 | 19.494 | 13.241 | 13.109 | 0.110 | 3.264 | 1.347 | 11.937 | 6.389 | 9.888 | 2.496 | 5.547 | 2.377 | 3.602 | 0.974 | 12.795 | 6.139 |
| F | 1.615 | 1.472 | 119.066 | 2.422 | 1.868 | 3.962 | 2.334 | 3.698 | 2.084 | |||||||||
| p-value | 0.270 | 0.302 | ** | 0.133 | 0.223 | * | 0.160 | 0.081 | 0.220 | |||||||||
APPENDIX 29.
Probabilities from Tukey honest significant difference (HSD) post hoc test of therian measurements by biozones. Measurements subjected to the Tukey HSD test are those with significant ANOVA results, only entepicondyle condyle width (NCW) and trochlea depth (TL). Significance is as follows: * for p < 0.05; ** for p < 0.01.
| Measurement | Lancian | BCA | Pu1 | Pu3 | |
| NCW | Lancian | - | 0.147 | 0.176 | ** |
| BCA | 0.147 | - | 0.973 | ** | |
| Pu1 | 0.176 | 0.973 | - | * | |
| Pu3 | ** | ** | * | - | |
| TL | Lancian | - | 0.994 | 0.470 | 0.125 |
| BCA | 0.994 | - | 0.465 | 0.056 | |
| Pu1 | 0.470 | 0.465 | - | 0.991 | |
| Pu3 | 0.125 | 0.056 | 0.991 | - | |
APPENDIX 30.
Boxplot (left) and variance (right) for eutherian NCW measurement, which had significant ANOVA results according to biozone. Boxplot includes minimum, quartiles, median, and maximum values; variance shown for biozones with n > 1. See Table 1 for measurements, Table 3 for data, Appendix 8 for means, and Appendix 28-Appendix 29 for ANOVA and Tukey HSD results, respectively. Asterisks indicate pairs of significantly different values in Tukey tests (i.e., Pu3 specimens are significantly larger than Lancian and BCA specimens).
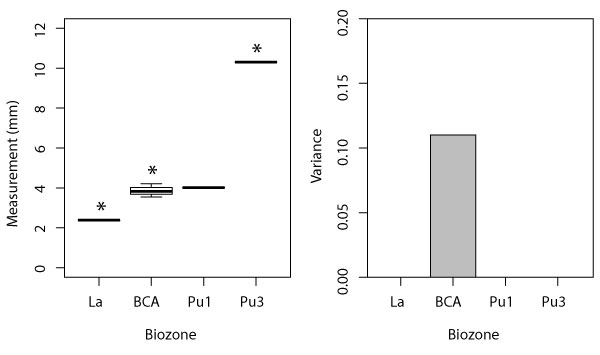
APPENDIX 31.
Eigenvalues, proportion of variance, and cumulative variance explained from PCAs. We conducted PCAs on two separate datasets: one “full dataset” that included all modern taxa (Table 4), and one “reduced dataset” of eutherians that excluded carnivorans and lagomorphs (see text for more details). Of the 40 total principal components in each PCA, we report only PCs that explained at least 1% of the variance.
| Eigenvalues | Proportion of Variance |
Cumulative Variance |
||
| Full Dataset | ||||
| PC1 | 0.0067938 | 46% | 46% | |
| PC2 | 0.0018609 | 13% | 59% | |
| PC3 | 0.0016220 | 11% | 70% | |
| PC4 | 0.0011623 | 8% | 78% | |
| PC5 | 0.0007075 | 5% | 83% | |
| PC6 | 0.0004502 | 3% | 86% | |
| PC7 | 0.0003615 | 2% | 88% | |
| PC8 | 0.0003264 | 2% | 91% | |
| PC9 | 0.0003162 | 2% | 93% | |
| PC10 | 0.0002115 | 1% | 94% | |
| PC11 | 0.0001540 | 1% | 95% | |
| Reduced Dataset | ||||
| PC1 | 0.0042641 | 37% | 37% | |
| PC2 | 0.0021872 | 19% | 56% | |
| PC3 | 0.0015529 | 13% | 69% | |
| PC4 | 0.0007259 | 6% | 75% | |
| PC5 | 0.0007226 | 6% | 82% | |
| PC6 | 0.0004394 | 4% | 85% | |
| PC7 | 0.0003591 | 3% | 89% | |
| PC8 | 0.0003120 | 3% | 91% | |
| PC9 | 0.0002451 | 2% | 93% | |
| PC10 | 0.0001782 | 2% | 95% | |
| PC11 | 0.0001404 | 1% | 96% | |
APPENDIX 32.
Principal Component Analysis (PCA) of all modern taxa with specimens labeled. PC1 and PC2 explain 46% and 13% of the total variance, respectively (Appendix 31). Partial warp shapes indicate the minimum and maximum of PC1 on a right humerus in distal view. Black circles are metatherians, gray circles are eutherians. See Table 4 for specimen information. We note the orientation of the maximum and minimum of PC1 is reversed here compared to Figure 3, Figure 20-Figure 21); this is a function of the arbitrary assignment of maximum and minimum in PC space, and it does not affect the shape interpretation.
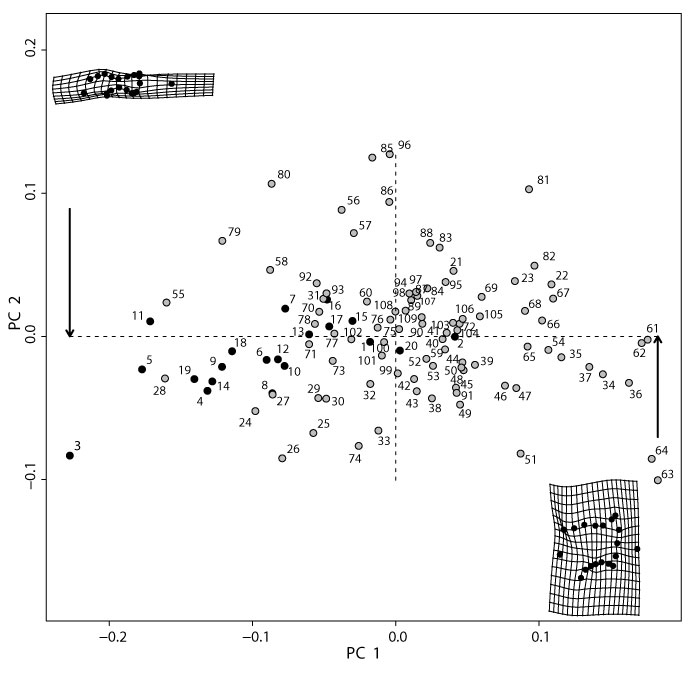
APPENDIX 33.
Principal Component Analysis (PCA) of all modern taxa with specimens labeled. PC2 and PC3 explain 13% and 11% of the total variance, respectively (Appendix 31). Partial warp shapes indicate the minimum and maximum of PC2. Black circles are metatherians, gray circles are eutherians. See Table 4 for specimen information.
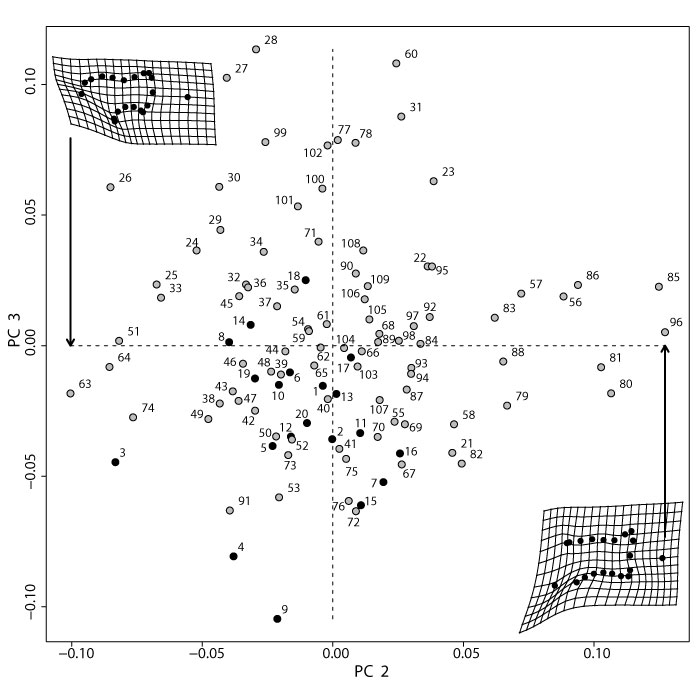
APPENDIX 34.
LDA results for the reduced dataset of extant mammals with known locomotion. LDA analyses used all significant principal components (i.e., those which represented at least 1% of the variation).
| Locomotor Group Means | ||||||||
| A | F | G | S | Sa | Sc | Sf | T | |
| PC1 | 0.01276 | -0.00884 | 0.06054 | 0.05556 | -0.01318 | -0.03556 | -0.01427 | 0.02452 |
| PC2 | 0.02255 | -0.02874 | 0.03102 | -0.01765 | -0.07145 | 0.05872 | 0.00177 | 0.01686 |
| PC3 | 0.01071 | -0.00397 | -0.00655 | -0.00441 | 0.00296 | 0.04311 | -0.01621 | 0.00011 |
| PC4 | -0.00049 | -0.01497 | 0.00582 | 0.00888 | 0.01229 | 0.00693 | 0.00257 | 0.02051 |
| PC5 | 0.00474 | -0.00238 | -0.03417 | 0.00849 | -0.00719 | -0.00493 | 0.00250 | 0.00677 |
| PC6 | 0.01928 | -0.00531 | 0.00733 | -0.02232 | -0.00779 | -0.01032 | -0.00525 | -0.01245 |
| PC7 | -0.00652 | -0.00415 | 0.01422 | -0.00893 | 0.01796 | 0.02135 | -0.01010 | 0.01034 |
| PC8 | -0.00155 | 0.00139 | 0.01861 | 0.00473 | 0.00458 | -0.00357 | 0.00581 | -0.00768 |
| PC9 | 0.00265 | 0.00418 | 0.00749 | -0.00980 | 0.00657 | -0.01905 | -0.00713 | 0.00275 |
| PC10 | 0.00117 | -0.00358 | -0.00796 | 0.00495 | 0.00051 | -0.00717 | 0.00358 | -0.00140 |
| PC11 | 0.00427 | 0.00338 | 0.00415 | 0.00051 | -0.00679 | 0.00198 | -0.00687 | -0.00108 |
| Coefficients of Linear Discriminants | ||||||
| LD1 | LD2 | LD3 | LD4 | LD5 | LD6 | |
| PC1 | 2.94717 | 2.27578 | 2.17796 | 9.41316 | -6.31096 | -4.86250 |
| PC2 | 26.91399 | 13.17848 | -4.77661 | 4.56211 | 2.92216 | 0.42556 |
| PC3 | 7.31164 | 6.68984 | 1.18431 | -11.66506 | 2.81487 | -1.24342 |
| PC4 | -5.70621 | 22.80368 | -3.22197 | 4.88143 | -18.81627 | 11.10793 |
| PC5 | 2.06893 | -3.58513 | -21.96368 | -10.27321 | -13.82449 | -4.63802 |
| PC6 | 48.82373 | -21.34994 | 19.54012 | -11.13995 | -10.35859 | 23.00979 |
| PC7 | -20.15756 | 43.27913 | 29.14487 | -15.39684 | 0.14397 | 3.82854 |
| PC8 | -6.88752 | -9.20087 | 17.93410 | 29.18532 | 19.67257 | 17.61627 |
| PC9 | -3.79714 | -16.85835 | 37.88225 | -4.34904 | -33.12376 | -12.11852 |
| PC10 | -4.01667 | -13.76100 | -24.49836 | 5.73548 | -20.80180 | 21.90751 |
| PC11 | 44.60443 | -8.70142 | 17.22111 | -4.55220 | 6.04990 | -51.18676 |
| Proportions of Trace |
50.42% | 21.25% | 13.29% | 5.64% | 4.95% | 3.18% |
APPENDIX 35.
LDA predictions for locomotor mode for modern specimens in this study. LDA correctly predicts locomotor mode of modern specimens with an accuracy of 74.19%. Published locomotor mode (LM) is indicated, as well as predicted locomotor mode; asterisks indicate specimens whose locomotor mode was incorrectly predicted. See Table 4 for additional specimen information.
| Specimen | Genus | species | Family | Order | Code | LM | LM Prediction | |
| S2008 | Potamogale | velox | Potamogalidae | Afrosoricida | 21 | Sa | T* | |
| 39039 | Dendrohyrax | arboreus | Procaviidae | Afrosoricida | 22 | A | A | |
| 39038 | Dendrohyrax | arboreus | Procaviidae | Afrosoricida | 23 | A | Sf* | |
| S2008 | Limnogale | mergulus | Tenrecidae | Afrosoricida | 24 | Sa | F* | |
| 34168 | Echinops | telfairi | Tenrecidae | Afrosoricida | 25 | Sc | Sc | |
| S2008 | Echinops | telfairi | Tenrecidae | Afrosoricida | 26 | Sc | T* | |
| S2008 | Hemicentetes | semispinosus | Tenrecidae | Afrosoricida | 27 | Sf | T* | |
| S2008 | Oryzorictes | sp. | Tenrecidae | Afrosoricida | 28 | Sf | Sf | |
| S2008 | Setifer | setosus | Tenrecidae | Afrosoricida | 29 | T | T | |
| S2008 | Tenrec | ecaudatus | Tenrecidae | Afrosoricida | 30 | T | T | |
| S2008 | Microgale | cowani | Tenrecidae | Afrosoricida | 31 | T | T | |
| S2008 | Microgale | dobsoni | Tenrecidae | Afrosoricida | 32 | T | T | |
| S2008 | Microgale | talazaci | Tenrecidae | Afrosoricida | 33 | T | Sc* | |
| 34167 | Cabassous | centralis | Dasypodidae | Cingulata | 55 | F | Sa* | |
| 20735 | Dasypus | novemcinctus | Dasypodidae | Cingulata | 56 | F | F | |
| 22458 | Dasypus | novemcinctus | Dasypodidae | Cingulata | 57 | F | F | |
| 35468 | Euphractus | sexcinctus | Dasypodidae | Cingulata | 58 | F | F | |
| S2008 | Echinosorex | gymnurus | Erinaceidae | Erinaceomorpha | 59 | T | T | |
| S2008 | Solenodon | paradoxus | Solenodontidae | Soricomorpha | 60 | Sf | Sf | |
| S2008 | Petrodromus | tetradactylus | Macroscelididae | Macroscelidea | 67 | S | T* | |
| 35475 | Elephantulus | rufescens | Macroscelididae | Macroscelidea | 68 | T | T | |
| 34189 | Elephantulus | rufescens | Macroscelididae | Macroscelidea | 69 | T | T | |
| 39003 | Callithrix | pygmaea | Cebidae | Primates | 70 | A | A | |
| 39005 | Callithrix | pygmaea | Cebidae | Primates | 71 | A | A | |
| 75541 | Leontopithecus | chrysomela | Cebidae | Primates | 72 | A | A | |
| 35406 | Saguinus | oedipus | Cebidae | Primates | 73 | A | A | |
| 35405 | Saguinus | oedipus | Cebidae | Primates | 74 | A | A | |
| 82302 | Saimiri | sciureus | Cebidae | Primates | 75 | A | A | |
| 39014 | Saimiri | sciureus | Cebidae | Primates | 76 | A | A | |
| 34071 | Aplodontia | rufa | Aplodontiidae | Rodentia | 77 | F | Sf* | |
| 34058 | Aplodontia | rufa | Aplodontiidae | Rodentia | 78 | F | Sf* | |
| 34116 | Castor | canadensis | Castoridae | Rodentia | 79 | Sa | Sa | |
| 34588 | Castor | canadensis | Castoridae | Rodentia | 80 | Sa | Sa | |
| 72830 | Cavia | porcellus | Caviidae | Rodentia | 81 | T | T | |
| 72831 | Cavia | porcellus | Caviidae | Rodentia | 82 | T | T | |
| 76622 | Microtus | pennsylvanicus | Cricetidae | Rodentia | 83 | F | F | |
| 34326 | Microtus | pennsylvanicus | Cricetidae | Rodentia | 84 | F | F | |
| 34324 | Ondatra | zibethicus | Cricetidae | Rodentia | 85 | Sa | Sa | |
| 72879 | Ondatra | zibethicus | Cricetidae | Rodentia | 86 | Sa | Sa | |
| 66559 | Synaptomys | borealis | Cricetidae | Rodentia | 87 | Sf | F* | |
| 66561 | Synaptomys | borealis | Cricetidae | Rodentia | 88 | Sf | Sf | |
| 76721 | Zapus | princeps | Dipodidae | Rodentia | 89 | S | Sf* | |
| 75136 | Zapus | princeps | Dipodidae | Rodentia | 90 | S | S | |
| 34176 | Coendou | prehensilis | Erethizontidae | Rodentia | 91 | Sc | Sc | |
| 44624 | Thomomys | bottae | Geomyidae | Rodentia | 92 | F | F | |
| 38261 | Thomomys | bottae | Geomyidae | Rodentia | 93 | F | F | |
| 47378 | Chaetodipus | fallax | Heteromyidae | Rodentia | 94 | F | S* | |
| 47379 | Chaetodipus | fallax | Heteromyidae | Rodentia | 95 | F | A* | |
| 78740 | Dipodomys | deserti | Heteromyidae | Rodentia | 96 | S | F* | |
| 48984 | Octodon | degus | Octodontidae | Rodentia | 97 | Sf | A* | |
| 39501 | Octodon | degus | Octodontidae | Rodentia | 98 | Sf | Sf | |
| 35278 | Sciurus | aberti | Sciuridae | Rodentia | 99 | A | A | |
| 82349 | Sciurus | aberti | Sciuridae | Rodentia | 100 | A | A | |
| 20646 | Sciurus | carolinensis | Sciuridae | Rodentia | 101 | A | A | |
| 30010 | Sciurus | carolinensis | Sciuridae | Rodentia | 102 | A | A | |
| 36334 | Glaucomys | sabrinus | Sciuridae | Rodentia | 103 | G | G | |
| 35129 | Glaucomys | sabrinus | Sciuridae | Rodentia | 104 | G | G | |
| 43897 | Glaucomys | volans | Sciuridae | Rodentia | 105 | G | G | |
| 32254 | Glaucomys | volans | Sciuridae | Rodentia | 106 | G | G | |
| 75774 | Cynomys | ludovicianus | Sciuridae | Rodentia | 107 | Sf | Sf | |
| 34227 | Tupaia | glis | Tupaiidae | Scandentia | 108 | A | A | |
| 34225 | Tupaia | glis | Tupaiidae | Scandentia | 109 | A | A | |
APPENDIX 36.
LDA results and predicted locomotor mode for fossil specimens in this study. Prediction probabilities that are in bold are the top ranked locomotor mode (i.e., rank of 1); all ranks are shown for predictions probabilities, but percentages are shown only for > 0.00%. Abbreviations: Spec. Number, specimen number; Loc. locality; M. morphotype; Bioz., biozone.
| Spec. Number |
Prediction Probabilities | Rank | |||||||||||||||||
| Loc. | M. | Bioz. | A | F | G | S | Sa | Sc | Sf | T | 1 | 2 | 3 | 4 | 5 | 6 | 7 | 8 | |
| 97114 | C1115 | EuB | La | 99.39% | 0.17% | 0.44% | A | Sf | F | T | Sc | S | G | Sa | |||||
| 151991 | V71203 | EuC | BCA | 27.10% | 9.44% | 0.02% | 0.17% | 0.16% | 61.01% | 2.10% | Sf | A | F | T | S | Sc | G | Sa | |
| 151964 | V65127 | EuD | BCA | 0.82% | 93.29% | 0.04% | 5.85% | F | Sf | A | S | Sa | T | G | Sc | ||||
| 153036 | V65127 | EuD | BCA | 25.36% | 23.94% | 0.07% | 50.54% | 0.09% | Sf | F | A | T | S | Sc | Sa | G | |||
Mammalian distal humerus fossils from eastern Montana, USA with implications for the Cretaceous-Paleogene mass extinction and the adaptive radiation of placentals
Plain Language Abstract
The Cretaceous-Paleogene mass extinction represents among the most significant events in mammalian history. Conventional understanding of this event suggests that with the extinction of non-avian dinosaurs, mammals inherited the earth and quickly diversified to fill ecological niches (e.g., large body size, diverse locomotor modes and feeding ecologies) previously unoccupied by mammals. Whereas most studies of this event have focused on fossil teeth, this study uses upper forelimb (humeri) fossils from the well-sampled and well-studied Cretaceous and Paleogene deposits in eastern Montana to assess the diversity of mammalian body sizes and locomotor modes. The results of our analyses show 1) a change in the composition of mammal faunas across the K-Pg boundary, from ones dominated by the more archaic group called multituberculates to ones largely made up of the more modern eutherian mammals; 2) changes in body size, from an initial decrease across the K-Pg boundary, to an increase in body size in less than 1 million years; and 3) a greater locomotor diversity among K-Pg mammals than previously recognized, including climbing, digging, scampering, and ground-dwelling forms. This study expands our view of the ecology of these early mammals and our basis for testing ecological hypotheses of the K-Pg mass extinction and recovery.
Resumen en Español
Fósiles de húmeros distales de mamíferos del este de Montana, EE. UU., con implicaciones sobre la extinción en masa del Cretácico-Paleógeno y la radiación adaptativa de los placentados
Los restos postcraneales de mamíferos del Cretácico-Paleógeno (K-Pg) ofrecen información sobre la riqueza, el tamaño corporal y la ecología locomotora que complementan los patrones mostrados por conjuntos dentales bien representados. Aquí, describimos y asignamos morfotipo a 50 humeros distales de asociaciones de edad Lancianense–Puercaniense del este de Montana. Utilizando el análisis morfométrico geométrico de una muestra taxonómicamente amplia de húmeros de terios actuales de cuerpos pequeños con diversos modos de locomoción, restringimos las inferencias locomotrices de algunos morfotipos. Usamos esta base de datos para evaluar preliminarmente la diversidad del tamaño corporal y locomotor a través del límite K-Pg.
Los siete morfotipos de húmeros del Lancianense incluyen los multituberculados ?Mesodma sp., ?Cimolodon nitidus, y ?Meniscoessus robustus y el metaterio ?Didelphodon vorax. La riqueza de morfotipos disminuyó a cuatro o cinco a través del límite K-Pg y aumentó en el Puercaniense tardío a seis morfotipos, en su mayoría euterios. Los morfotipos del Puercaniense incluyen el multituberculado ?Stygimys kuszmauli, el primate "plesiadapiforme" ?Purgatorius, ungulados arcaicos pequeños y grandes, un posible paleoríctido y un gran euterio. Los datos del tamaño del húmero implican una disminución en el tamaño del cuerpo a través del límite K-Pg, seguido de un aumento en el Puercaniense tardío, una tendencia consistente con lo que indica el registro fósil dental. El análisis morfométrico geométrico y la morfología funcional indican una mayor diversidad locomotora entre los mamíferos del K-Pg que la previamente reconocida: inferimos que la mayoría de las multituberculados del Lancianense y Puercaniense eran arbóreos; los euterios del Lancianense eran arbóreos o semifosoriales; los paleoríctidos del Puercaniense temprano eran de semifosoriales y el pequeño ungulado arcaico era terrestre; y el primate "plesiadapiforme" del Puercaniense tardío era arbóreo y el gran ungulado arcaico era de escansorial. Tomados en conjunto, estos resultados preliminares amplían nuestra comprensión de los mamíferos del K-Pg y nuestra base para probar las hipótesis ecológicas de la extinción en masa y recuperación para el límite K-Pg.
Palabras clave: Mammalia; restos postcraneales; húmero; extinción en masa; Cretácico-Paleógeno; morfometría geométrica.
Traducción: Enrique Peñalver (Sociedad Española de Paleontología)
Résumé en Français
Les parties distales des humérus de mammifères fossiles de l’est du Montana, États-Unis : implications pour l’extinction de masse Crétacé-Paléogène et la radiation adaptative des placentaires
Les restes postcrâniens des mammifères crétacés-paléogènes donnent des informations sur la richesse, la taille corporelle, et l’écologie locomotrice qui complètent les schémas issus des assemblages dentaires bien documentés. Dans cet article, nous décrivons et classons en morphotypes 50 parties distales d’humérus provenant d’assemblages lanciens-puerciens de l’est du Montana. En utilisant une analyse de morphométrie géométrique sur un échantillon taxinomiquement important d’humérus de thériens actuels de petite taille, et de modes de locomotion divers, nous précisons les reconstitutions locomotrices de certains morphotypes. Nous utilisons cette base de données pour estimer de manière préliminaire la taille corporelle et la diversité locomotrice à travers la limite Crétacé-Paléogène. Les sept morphotypes d’humérus du Lancien incluent les multituberculés ?Mesodma sp., ?Cimolodon nitidus, et ?Meniscoessus robustus, et le métatherien ?Didelphodon vorax. La richesse en morphotypes a diminué jusqu’à quatre à cinq pendant la limite Crétacé-Paléogène et a rebondi pendant le Puercien récent à six morphotypes, principalement euthériens. Les morphotypes puerciens incluent le multituberculé ?Stygimys kuszmauli, le primate “plésiadapiforme” ?Purgatorius, des ongulés archaïques de petite et grande taille, un possible palaeoryctidé, et un euthérien de très grande taille. Les données sur la taille de l’humérus indiquent une réduction de la taille corporelle à la limite Crétacé-Paléogène, suivie par une augmentation pendant le Puercien récent, une tendance cohérente avec le registre fossile dentaire. Les analyses de morphométrie géométrique et de morphologie fonctionnelle indiquent une plus grande diversité locomotrice parmi les mammifères crétacés-paléogènes que celle reconnue auparavant : nous estimons que la plupart des multituberculés lanciens et puerciens étaient arboricoles ; l’euthérien lancien était arboricole ou semi-fouisseur ; le palaeoryctidé du Puercien ancien était semi-fouisseur, et l’ongulé archaïque du Puercien ancien de petite taille était terrestre ; et le primate “plésiadapiforme” du Puercien récent était arboricole et l’ongulé archaïque de grande taille du Puercien récent était grimpeur. Dans leur ensemble, ces résultats préliminaires élargissent notre connaissance des mammifères crétacés-paléogènes et notre base pour tester des hypothèses écologiques concernant l’extinction de masse Crétacé-Paléogène et la reprise ultérieure.
Mots-clés : Mammalia ; humérus ; extinction de masse ; Crétacé-Paléogène ; morphométrie géométrique
Translator: Antoine Souron
Deutsche Zusammenfassung
Distale Humerus-Fossilien von Säugetieren aus Ostmontana, USA mit Auswirkungen auf das Kreide-Paläogen Massenaussterbeereignis und die adaptive Radiation der Plazentatiere
Postcraniales Material von Säugetieren aus dem Kreide-Paläogen (K-Pg) Übergangsbereich bietet Einblicke in die Vielfältigkeit, Größe und Bewegungsökologie und ergänzt die Modelle aus den Proben der Zahn-Assemblagen. Hier beschreiben und morphotypisieren wird 50 distale Humeri aus Assemblagen (Lancianium – Puercanium) von Ostmontana. Indem wir eine geometrisch-morphometrische Analyse einer taxonomisch breitgefächerten Probe von Humeri von heutigen kleinen Theria mit diversen Fortbewegungsweisen anwenden, schränken wir Fortbewegungsinferenzen einiger Morphotypen ein. Wir benutzen diese Datenbank um die vorläufige Größe und Fortbewegungsdiversität an der K-Pg Grenze zu bestimmen.
Die sieben Humerus Morphotypen aus dem Lancianium beinhalten die Multituberculaten Mesodma sp., ?Cimolodon nitidus und ?Meniscoessus robustus und der Metatheriane ?Didelphodon vorax. Die Morphotypen-Vielfalt nahm an der K-Pg Grenze auf vier oder fünf ab und stieg im späten Puercanium wieder auf sechs Morphotypen, meist Eutheria, an. Morphotypen aus dem Puercanium beinhalten den Multituberculaten ?Stygimys kuszmauli, den "plesiadapiformen" Primaten ?Purgatorius, kleine und große archaische Ungulaten, einen möglichen Palaeoryctiden und eine sehr großes Plazentatier. Die Daten zur Humerusgröße implizieren eine Abnahme der Körpergröße an der K-Pg Grenze, gefolgt von einer Zunahme im späten Puercanium, ein Trend, der mit dem fossilen Zahnnachweis übereinstimmt. Die Geometrisch-morphometrische Analyse und die Funktionsmorphologie deuten auf vielfältigere Fortbewegunsgweisen an der K-Pg Grenze hin als bisher erkannt war: wir folgern, dass die meisten Multituberculaten aus dem Lancianium und Puercanium aboreal waren; das Plazentatier aus dem Lancianium war aboreal oder semifossorial; der frühe Palaeoryctide aus dem Puercanium war semifossorial und der kleine archaische Ungulate war terrestrisch; der "plesiadapiforme" Primat aus dem späten Puercanium war arboreal und der große archaische Ungulate war scansorisch. Zusammengenommen erweitern diese vorläufigen Ergebnisse unser Wissen über die K-Pg Säugetiere und unsere Basis an Tests ökologischer Hypothesen zum K-Pg Massenaussterbeereignis und zur Erholung danach.
Schlüsselwörter: Mammalia; Postcrania; Humerus; Aussterbeereignis; Kreide-Paläogen; geometrische Morphometrie
Translator: Eva Gebauer
Arabic
Translator: Ashraf M.T. Elewa
-
-
-
Review: The Princeton Field Guide to Mesozoic Sea Reptiles
 The Princeton Field Guide to Mesozoic Sea Reptiles
Article number: 26.1.1R
April 2023
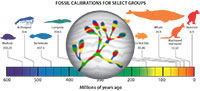
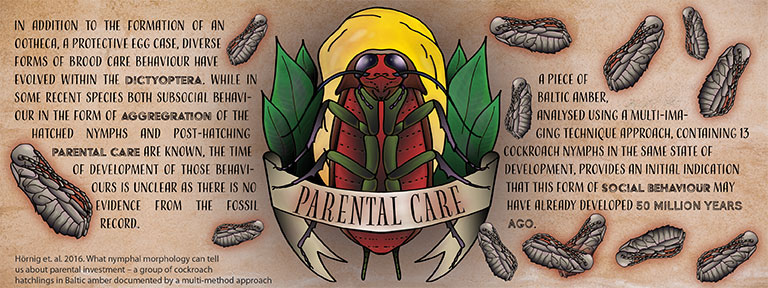 Poster Winners 2024