

Article Search
Volume 27.1
January–April 2024
Full table of contents
ISSN: 1094-8074, web version;
1935-3952, print version
Recent Research Articles
See all articles in 27.1 January-April 2024
See all articles in 26.3 September-December 2023
See all articles in 26.2 May-August 2023
See all articles in 26.1 January-April 2023
APPENDIX 1.
Anisotropy and complexity for each ewe and for each case study. Click to download zipped PDF of Appendices.
APPENDIX 2.
Two-way repeated measures ANOVA on Asfc and epLsar between dietary groups and between different positions on the shearing facet. Significant p -values are highlighted in bold. Click to download zipped PDF of Appendices.
APPENDIX 3.
Two-way repeated measures ANOVA on Asfc and epLsar between dietary groups and between different positions on the shearing facet. Significant p-values are highlighted in bold. Click to download zipped PDF of Appendices.
APPENDIX 4.
Example of a randomized dataset simulating a fossil sample for which all molar positions are considered. Complexity (Asfc) and anisotropy (epLsar) are measured on disto-labial protoconid facets on lower molars and mesiolingual paracone facets on upper molars. Click to download zipped PDF of Appendices.
APPENDIX 5.
Means of complexity (Asfc) and anisotropy (epLsar) for the three simulated dietary groups (with n = 10) for each of 1000 iterations (see material and methods for details). Click to download zipped PDF of Appendices.
APPENDIX 6.
Means of complexity (Asfc) and anisotropy (epLsar) for the three simulated dietary groups (with n = 20) for each of 1000 iterations (see material and methods for details). Click to download zipped PDF of Appendices.
APPENDIX 7.
Means of complexity (Asfc) and anisotropy (epLsar) for the three simulated dietary groups (with n = 30) for each of 1000 iterations (see Material and Methods for details). Click to download zipped PDF of Appendices.
APPENDIX 8.
Differences between the three dietary groups for each of the 1000 iterations and for N = 10 are explored through ANOVAs after rank transformation of the data. Click to download zipped PDF of Appendices.
APPENDIX 9.
Differences between the three dietary groups for each of the 1000 iterations and for N = 20 are explored through ANOVAs after rank transformation of the data. Click to download zipped PDF of Appendices.
APPENDIX 10.
Differences between the three dietary groups for each of the 1000 iterations and for N = 30 are explored through ANOVAs after rank transformation of the data. Click to download zipped PDF of Appendices.
 Anusha Ramdarshan. Institut de Paléoprimatologie et Paléontologie Humaine: Evolution et Paléoenvironnements UMR 7262 (CNRS and Université de Poitiers), 86073 Poitiers Cedex 9, France. anusha.ramdarshan@univ-poitiers.fr
Anusha explores how mammals responded in the past to long-term changes in environment, available resources and competition between different species. She specifically works on the reconstruction of dietary behaviors through dental microwear analysis. Anusha has been working for a year on the TRIDENT project, developing dietary reconstruction models using 3D dental microwear analysis on a dataset resulting from controlled-food testing on domestic sheep. This work will help us characterize how microwear is formed, and further our understanding of the feeding behavior of extant and fossil herbivores.

 Cécile Blondel. Institut de Paléoprimatologie et Paléontologie Humaine: Evolution et Paléoenvironnements UMR 7262 (CNRS and Université de Poitiers), 86073 Poitiers Cedex 9, France. cecile.blondel@univ-poitiers.fr
Cécile Blondel obtained her Ph.D. in Geology and Paleontology at the University of Montpellier II, France in 1996. She became assistant professor at the University of Poitiers, France in 1999. Her research focuses on the phylogeny, i.e. the development or evolution, of Bovidae during the Mio-Pliocene of Africa. She is also actively involved in the reconstruction of paleo-environments of early hominids using dental wear analysis on specimens of both ungulates and primates.
 Denis Gautier. Ferme du Mourier, Institut de l’Elevage, 87800 St Priest Ligoure, France; Centre Interrégional d’Information et de Recherche en Production Ovine, Ferme du Mourier, 87800 Saint Priest Ligoure, France. Denis.Gautier@idele.fr
Denis Gautier is an engineer in agronomy. He got his Masters degree at the Supagro Montpellier Engineering School. For two decades, Denis Gautier has been involved in and has al so been heading several national and European projects at the Institut de l'Elevage (Breeding Institute). These projects deal with diet, reproduction, genetics, animal well-being, pasture management.
Since 2013, Denis Gautier is the head of the Centre Interrégional d'Information et de Recherche en Production Ovine (CIIRPO) base in Haute-Vienne as well as the Mourier Experimental Farm Station (Institut de l'Elevage). In the frame of the TRIDENT project, he has coordinated the controlled food trials taking into account the well-being of every single ewe.
 Jérôme Surault. Institut de Paléoprimatologie et Paléontologie Humaine: Evolution et Paléoenvironnements UMR 7262 (CNRS and Université de Poitiers), 86073 Poitiers Cedex 9, France. jerome.surault@univ-poitiers.fr
Jerome Surault is a skilled paleontological technician with a strong experience. He first spend 2 years in the National Museum of Ethiopia as a manager of the Omo's paleontological collections then 5 years in the University of N'Djamena (Chad) as a leader of a bilateral cooperation project about the development of Chadian research in paleoanthropology. Since 2013 he's a research technician in paleontology at the iPHEP lab in the University of Poitiers. Main of his work time is devoted in CT imaging and image processing of fossils and osteological objects including dental microwear textural acquisition and treatment.
 Gildas Merceron. Institut de Paléoprimatologie et Paléontologie Humaine: Evolution et Paléoenvironnements UMR 7262 (CNRS and Université de Poitiers), 86073 Poitiers Cedex 9, France. gildas.merceron@univ-poitiers.fr
Dr. Gildas Merceron is paleontologist. He has been involved in the study of paleo-ecology of mammals that lived in Old World from 20 millions years ago. The methods he uses are mammal anatomy (to decipher the mode of locomotion of these mammals), stable isotope geochemistry and dental microwear textural analysis (to track the type of diets eaten by these mammals). G. Merceron obtained his Ph.D. in Vertebrate Paleontology at the University of Poitiers, France. After several post doc in the USA, Germany and Austria, G. Merceron got a tenure position as CNRS researcher at the University of Lyon in 2008. Since, G. Merceron is at the IPHEP lab at the University of Poitiers where he is piloting the TRIDENT (Dental Tribology) project funded by the French National Agency for Research.
FIGURE 1. Different protocols used in this study. 1, Upper and lower tooth rows of Ovis aries. The red circled numbers 1-7 refer to the facets used in each protocol and are labelled on the maxillary and mandibular tooth rows (1, disto-labial protoconid facet of the first lower molar; 2, disto-labial protoconid facet of the second lower molar; 3, disto-labial protoconid facet of the third lower molar; 4, mesio-lingual paracone paracone facet of the first upper molar; 5, mesio-lingual paracone facet of the second upper molar; 6, mesio-lingual paracone facet of the third upper molar; 7, mesio-lingual protocone facet of the second upper molar). 2, Differences in scan size: The influence of scan size on the microwear signal is tested by comparing scans of different sizes (illustrated) but from the same central position of the disto-labial protoconid facet (red square). The three squares along the disto-labial protoconid facet indicate the positions used for the 3-spot median. 3, Differences between facets: The homogeneity of the microwear signal between upper and lower molars is tested by comparing lower molars to two different upper molar facets. Red dots highlight the facets which were scanned. Arrows lead to the color-view of the corresponding scan. 4, Differences along the tooth row: the homogeneity of the microwear signal between cheek teeth is tested by comparing first, second and third lowers molars of the same tooth row. Red dots highlight the facets which were scanned. Arrows lead to the color-view of the corresponding scan. 5, Simulation as a bridge between experimentation and fossil samples: Random draw from each 60-observation sample in order to simulate samples with isolated cheekteeth belonging to possibly the same individuals. A 10 observation simulated sample is given here as an example.
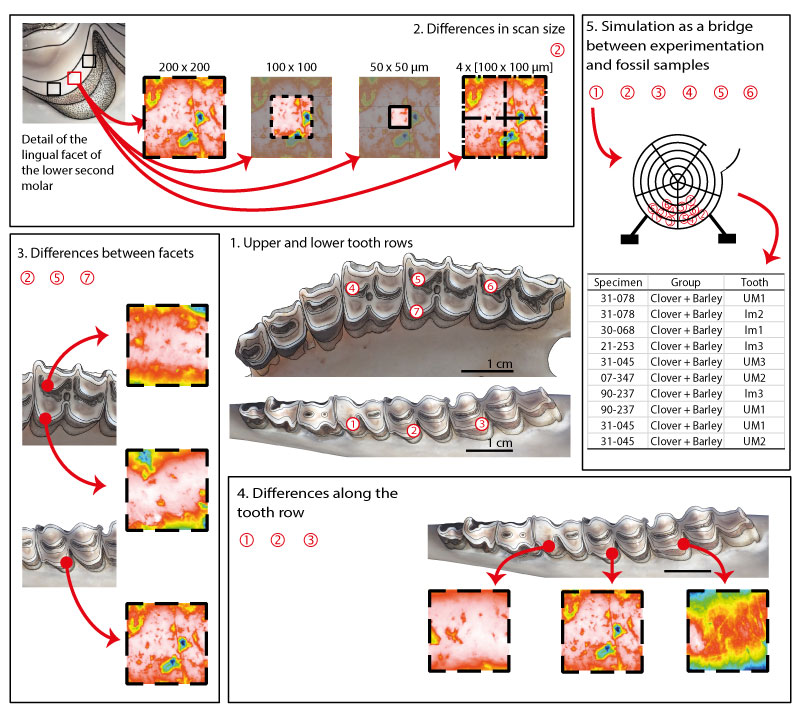
FIGURE 2. Mean and standard error of the mean for complexity (Asfc) and anisotropy (epLsar) of the dental microwear textures for each ewe sample and for different scan options. The four boxes are schematic representations of enamel surfaces with varying microwear textures (high/low epLsar and high/low Asfc).
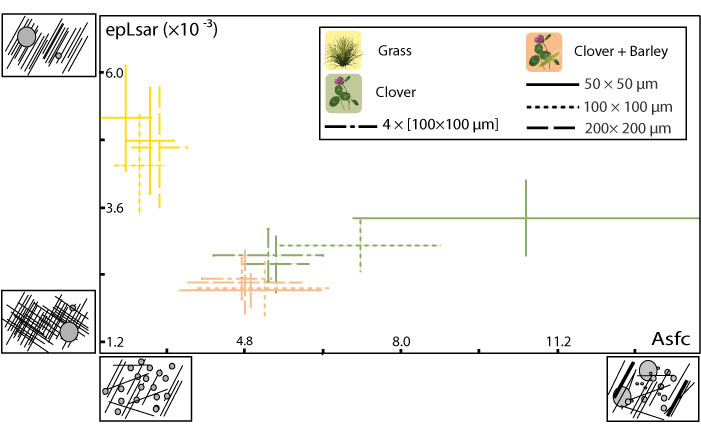
FIGURE 3. Mean and standard error of the mean for complexity (Asfc) and anisotropy (epLsar) of the dental microwear textures for dental facets from upper and lower molars and for each dietary sample. 1, Comparison of the disto-labial protoconid facet of the second lower molar and the mesio-lingual paracone facet of the second upper molar. 2, Comparison of the disto-labial protoconid facet of the second lower molar and lingual protocone facet of the second upper molar.
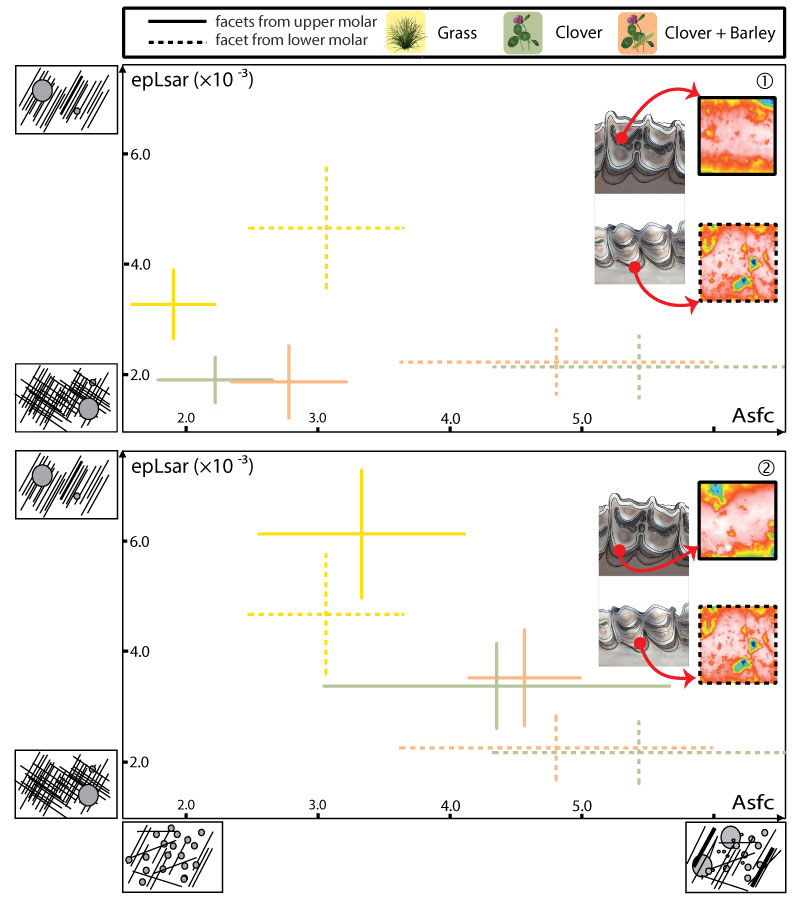
FIGURE 4. Mean and standard error of the mean for complexity (Asfc) and anisotropy (epLsar) of the dental microwear textures for each ewe sample and for each molar of the tooth row.
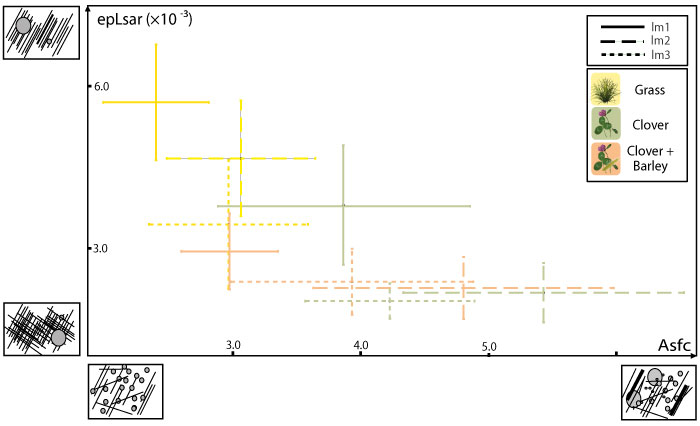
FIGURE 5. Mean and standard error of the mean for complexity (Asfc) and anisotropy (epLsar) of the dental microwear textures for the simulations of fossil data using random sampling of the ewe dataset. Ellipses represent 95% of the means for each iteration. Mean and standard error of the mean for each sample (lower second molars) are also represented for comparison. 1, Simulation with 10 individuals per dietary category and 1000 iterations. 2, Simulation with 20 individuals per dietary category and 1000 iterations. 3, Simulation with 30 individuals per dietary category and 1000 iterations.
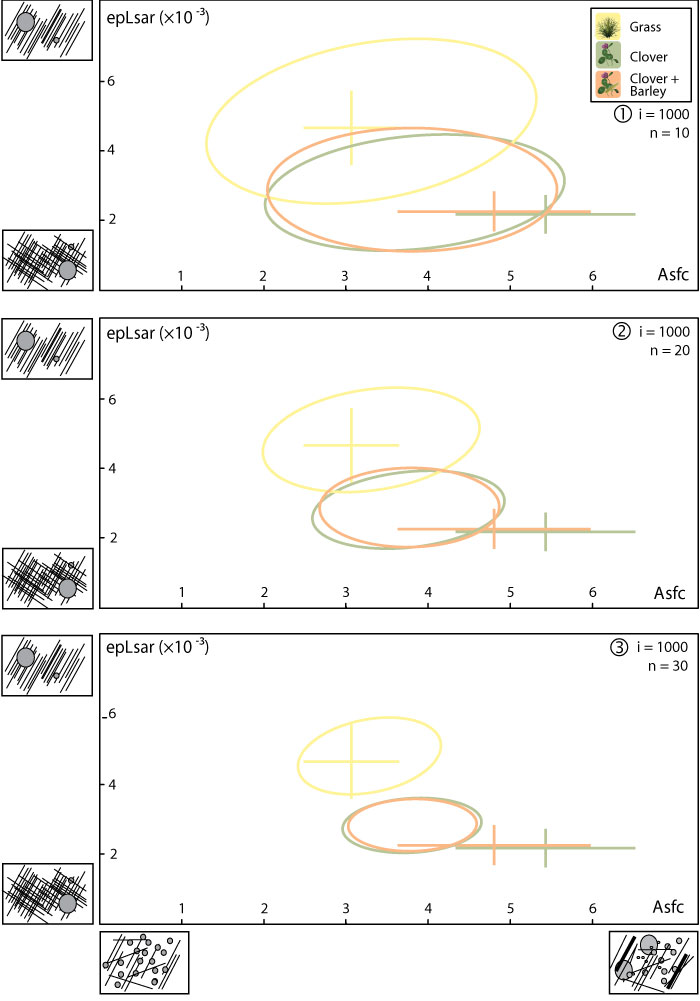
TABLE 1. Mean and standard error for complexity (Asfc) and anisotropy (epLsar) measured on different dental facets of upper (UM) and lower molars (lm) with a 200×200 µm scan size.
| Category | Tooth | Dental facet | N | Asfc | epLsar (×10 -3 ) | ||
| Mean | SE | Mean | SE | ||||
| Clover | lm1 | disto-labial protoconid | 10 | 3.86 | 0.98 | 3.79 | 1.11 |
| lm2 | 10 | 5.43 | 1.10 | 2.17 | 0.55 | ||
| lm3 | 10 | 4.23 | 0.66 | 2.01 | 0.33 | ||
| UM1 | mesio-lingual paracone | 9 | 3.33 | 0.53 | 4.36 | 1.01 | |
| UM2 | 10 | 2.22 | 0.43 | 1.94 | 0.40 | ||
| UM3 | 8 | 3.60 | 0.70 | 2.58 | 0.61 | ||
| UM2 | mesio-lingual protocone | 10 | 4.35 | 1.30 | 3.37 | 0.76 | |
| Clover + Barley | lm1 | disto-labial protoconid | 10 | 2.98 | 0.38 | 2.93 | 0.70 |
| lm2 | 10 | 4.80 | 1.17 | 2.26 | 0.58 | ||
| lm3 | 9 | 3.93 | 0.95 | 2.37 | 0.61 | ||
| UM1 | mesio-lingual paracone | 9 | 4.10 | 0.44 | 4.44 | 1.23 | |
| UM2 | 10 | 2.78 | 0.43 | 1.90 | 0.64 | ||
| UM3 | 9 | 4.20 | 0.87 | 3.56 | 0.74 | ||
| UM2 | mesio-lingual protocone | 10 | 4.57 | 0.42 | 3.52 | 0.86 | |
| Grass | lm1 | disto-labial protoconid | 10 | 2.40 | 0.41 | 5.70 | 1.07 |
| lm2 | 10 | 3.06 | 0.58 | 4.66 | 1.07 | ||
| lm3 | 8 | 2.97 | 0.62 | 3.44 | 1.20 | ||
| UM1 | mesio-lingual paracone | 10 | 5.69 | 1.43 | 6.52 | 1.26 | |
| UM2 | 10 | 1.91 | 0.31 | 3.29 | 0.61 | ||
| UM3 | 9 | 3.63 | 0.84 | 5.04 | 0.94 | ||
| UM2 | mesio-lingual protocone | 10 | 3.33 | 0.78 | 6.10 | 1.15 | |
TABLE 2. Two-way repeated measures ANOVA on complexity (Asfc) and on anisotropy (epLsar) between dietary groups and according to scan options on the disto-labial protoconid facet of the second lower molar.
| Source of Variance | Df | Sum Sq | Mean Sq | F Value | Pr(>F) |
| Asfc | |||||
| Group | 2 | 18078 | 9039 | 2.338 | 0.116 |
| Subjects within group | 27 | 104409 | 3867 | ||
| Scan options | 3 | 1652 | 550.8 | 2.656 | 0.054 |
| Group × Scan options | 6 | 3054 | 509 | 2.455 | 0.031 |
| Scan options × Subjects within group | 81 | 16797 | 207.4 | ||
| epLsar | |||||
| Group | 2 | 20718 | 10359 | 2.905 | 0.072 |
| Subjects within group | 27 | 96272 | 3566 | ||
| Scan options | 3 | 1738 | 579.4 | 1.988 | 0.122 |
| Group × Scan options | 6 | 1656 | 276 | 0.947 | 0.466 |
| Scan options × Subjects within group | 81 | 23606 | 291.4 |
TABLE 3. Post hoc pairwise comparisons on complexity (Asfc) and on anisotropy (epLsar) between dietary groups and according to scan options on the disto-labial protoconid facet of the second lower molar. Scan options are as follows: central position scans with 50×50, 100×100, or 200×200 µm size, 4-subsurface median option refers to the median value of four 100×100 µm surface sampled within the 200×200 µm scan on the central position along the dental facet and the 3-spot mean refers the mean values for three 200×200 µm scans sampled from the labial to central to lingual positions along the tooth facet.
| Asfc | epLsar | |||||
| 3-spot mean | Clover | Clover + Barley | Grass | Clover | Clover + Barley | Grass |
| Clover | - | - | - | - | - | - |
| Clover + Barley | 0.338 | - | - | 0.924 | - | - |
| Grass | 0.213 | 0.08 | - | 0.053 | 0.064 | - |
| 200×200 µm | Clover | Clover + Barley | Grass | Clover | Clover + Barley | Grass |
| Clover | - | - | - | - | - | - |
| Clover + Barley | 0.458 | - | - | 0.648 | - | - |
| Grass | 0.018 | 0.296 | - | 0.006 | 0.022 | - |
| 100×100 µm | Clover | Clover + Barley | Grass | Clover | Clover + Barley | Grass |
| Clover | - | - | - | - | - | - |
| Clover + Barley | 0.324 | - | - | 0.061 | - | - |
| Grass | 0.008 | 0.096 | - | 0.209 | 0.043 | - |
| 4-subsurface median | Clover | Clover + Barley | Grass | Clover | Clover + Barley | Grass |
| Clover | - | - | - | - | - | - |
| Clover + Barley | 0.504 | - | - | 0.26 | - | - |
| Grass | 0.007 | 0.253 | - | 0.017 | 0.025 | - |
| 50×50 µm | Clover | Clover + Barley | Grass | Clover | Clover + Barley | Grass |
| Clover | - | - | - | - | - | - |
| Clover + Barley | 0.094 | - | - | 0.212 | - | - |
| Grass | 0.028 | 0.149 | - | 0.123 | 0.068 | - |
TABLE 4. Two-way repeated measures ANOVA on complexity (Asfc) and on anisotropy (epLsar) between dietary groups and between upper and lower teeth (mesio-lingual facet of the paracone and disto-labial facet of the protoconid).
| Source of Variance | Df | Sum Sq | Mean Sq | F Value | Pr(>F) |
| Asfc | |||||
| Group | 2 | 975 | 487.6 | 2.759 | 0.081 |
| Subjects within group | 27 | 4772 | 176.7 | ||
| Tooth | 1 | 2587 | 2587.3 | 7.651 | 0.01 |
| Group × Tooth | 2 | 531 | 265.4 | 0.785 | 0.466 |
| Tooth × Subjects within group | 27 | 9130 | 338.1 | ||
| epLsar | |||||
| Group | 2 | 2818 | 1408.8 | 3.954 | 0.031 |
| Subjects within group | 27 | 9619 | 356.3 | ||
| Tooth | 1 | 209 | 209.07 | 1.059 | 0.313 |
| Group × Tooth | 2 | 20 | 9.82 | 0.05 | 0.952 |
| Tooth × Subjects within group | 27 | 5329 | 197.38 |
TABLE 5. Post-hoc pairwise comparisons on complexity (Asfc) between dietary groups and between upper and lower teeth (mesio-lingual facet of the paracone and disto-labial facet of the protoconid).
| Upper molars | ||||
| Clover | Clover + Barley | Grass | ||
| Lower molars | Clover | 0.018 | - | - |
| Clover + Barley | - | 0.362 | - | |
| Grass | - | - | 0.287 | |
TABLE 6. Post-hoc pairwise comparisons on anisotropy (epLsar) between dietary groups and between upper and lower teeth (mesio-lingual facet of the paracone and disto-labial facet of the protoconid).
| Upper molars | Lower molars | ||||||
| Clover | Clover + Barley | Grass | Clover | Clover + Barley | Grass | ||
| Lower molars | Clover | 0.780 | - | - | |||
| Clover + Barley | - | 0.155 | - | 0.891 | |||
| Grass | - | - | 0.580 | 0.003 | 0.036 | ||
| Upper molars | Clover | ||||||
| Clover + Barley | 0.679 | ||||||
| Grass | 0.137 | 0.008 | |||||
TABLE 7. Two-way repeated measures ANOVA on complexity (Asfc) and on anisotropy (epLsar) between dietary groups and between upper and lower teeth (lingual facet of the protocone and disto-labial protoconid facets respectively).
| Source of Variance | Df | Sum Sq | Mean Sq | F Value | Pr(>F) |
| Asfc | |||||
| Group | 2 | 1333 | 666.7 | 1.904 | 0.169 |
| Subjects within group | 27 | 9456 | 350.2 | ||
| Tooth | 1 | 15 | 15 | 0.061 | 0.807 |
| Group × Tooth | 2 | 553 | 276.4 | 1.124 | 0.34 |
| Tooth × Subjects within group | 27 | 6638 | 245.9 | ||
| epLsar | |||||
| Group | 2 | 2696 | 1348 | 4.162 | 0.027 |
| Subjects within group | 27 | 8744 | 323.9 | ||
| Tooth | 1 | 1144 | 1144.1 | 5.722 | 0.024 |
| Group × Tooth | 2 | 12 | 5.8 | 0.029 | 0.971 |
| Tooth × Subjects within group | 27 | 5399 | 199.9 |
TABLE 8. Post-hoc pairwise comparisons on complexity (Asfc) and on anisotropy (epLsar) between dietary groups and between upper and lower teeth (lingual facet of the protocone and disto-labial protoconid facets, respectively).
| Upper molars | ||||
| Clover | Clover + Barley | Grass | ||
| Lower molars | Asfc | |||
| Clover | 0.336 | - | - | |
| Clover + Barley | - | 0.409 | - | |
| Grass | - | - | 0.954 | |
| epLsar | ||||
| Clover | 0.3209 | - | - | |
| Clover + Barley | - | 0.1363 | - | |
| Grass | - | - | 0.0854 | |
TABLE 9. One-way repeated measures ANOVAs on each diet categories on Asfc and epLsar between dietary groups and between first, second, and third lower molars (disto-labial protoconid facets).
| Source of Variance | Df | Sum Sq | Mean Sq | F Value | Pr(>F) |
| Asfc | |||||
| Group | 2 | 2606 | 1303 | 1.753 | 0.192 |
| Subjects within group | 27 | 20070 | 743.3 | ||
| Tooth | 2 | 2493 | 1246.3 | 1.923 | 0.156 |
| Group × Tooth | 4 | 585 | 146.1 | 0.226 | 0.923 |
| Tooth × Subjects within group | 54 | 34990 | 648 | ||
| epLsar | |||||
| Group | 2 | 7200 | 3600 | 5.24 | 0.012 |
| Subjects within group | 27 | 18552 | 687 | ||
| Tooth | 2 | 1938 | 969 | 1.61 | 0.209 |
| Group × Tooth | 4 | 553 | 138.3 | 0.23 | 0.921 |
| Tooth × Subjects within group | 54 | 32499 | 601.8 |
TABLE 10. Post-hoc pairwise comparisons on anisotropy (epLsar) between dietary groups and between first, second, and third lower molars (disto-labial protoconid facets). Results for complexity (Asfc) are not shown here as the one-way repeated measures ANOVAs did not yield significant p-values.
| Clover | Clover + Barley | Grass | |||||||
| lm1 | lm2 | lm3 | lm1 | lm2 | lm3 | lm1 | lm2 | ||
| Clover | lm2 | 0.395 | - | - | - | - | - | - | - |
| lm3 | 0.384 | 0.948 | - | - | - | - | - | - | |
| Clover + Barley | lm1 | 0.716 | - | - | - | - | - | - | - |
| lm2 | - | 0.706 | - | 0.155 | - | - | - | - | |
| lm3 | - | - | 0.769 | 0.900 | 0.563 | - | - | - | |
| Grass | lm1 | 0.051 | - | - | 0.002 | - | - | - | - |
| lm2 | - | 0.038 | - | - | 0.031 | - | 0.157 | - | |
| lm3 | - | - | 0.220 | - | - | 0.504 | 0.236 | 0.784 | |
TABLE 11. Summary of the ANOVA results carried out on 1000 iterations. Results reported as the frequency of significant differences in complexity (Asfc) and anisotropy (epLsar) over 1000 iterations when comparing the three simulated groups (based on grass, clover, and clover/barley-fed ewes, respectively) for samples comprised of 10, 20, or 30 values per samples.
| Frequency (Pval < 0.05) | ||
| Simulation | Asfc | epLsar |
| n = 10 | 7.1% | 25.6% |
| n = 20 | 8.7% | 46.6% |
| n =30 | 10.0% | 72.1% |
Overcoming sampling issues in dental tribology: Insights from an experimentation on sheep
Plain Language Abstract
Dental microwear textural analysis is a widespread technique used to infer feeding habits in extinct vertebrates, notably mammals. Micrometric textures on enamel facets can significantly differ between animals depending on the physical properties of the food items they have eaten in the last few days to weeks before their death. Although a lot of work has been done over the last two decades, this field of research suffers from a lack of experimental data. Here, we explore different methodological issues with a set of three groups of ewes fed on three different diets: grasses, clover, and clover with barley. We also discuss how dental microwear textural analysis can discriminate between these three dietary groups taking into account the influence of scan size, scan location along the dental facet, molar type, and dental facet. Finally, based on this experimental dataset, we simulate fossil samples composed of isolated teeth for which the position is not guaranteed and possibly composed of teeth belonging to the same individual. We conclude and propose some guidelines for future dental microwear textural analyses to follow in order to strengthen their results.
Resumen en Español
Superando problemas de muestreo en tribología dental: ideas consecuencia de una experimentación en ovejas
El microdesgaste dental se ha usado en paleoecología durante casi medio siglo. El advenimiento de las tecnologías en la última década ha permitido que las superficies del esmalte se digitalicen en 3D y, por lo tanto, que las texturas de microdesgaste se caractericen como un todo. Aunque el análisis de la textura de microdesgaste dental ha sido ampliamente utilizado, pocos estudios han abordado el tema de la representatividad de la muestra, o la variabilidad de la señal de microdesgaste a lo largo de una faceta o una fila de dientes. ¿Cuánta información podemos extraer de una muestra fósil con precisión cuando se considera el desgaste de los dientes? ¿Podemos hacer inferencias con precisión sobre una especie completa basadas en muestras fósiles constituidas principalmente por dientes aislados? Estas cuestiones aún deben ser respondidas mediante una toma de datos controlada. En este estudio, abordamos este problema desde el principio. Una prueba controlada de alimentos a gran escala llevada a cabo con ovejas domésticas proporciona el marco para poner a prueba estas preguntas fundamentales. Nuestros resultados destacan que el análisis de una superficie de 200 × 200 μm permite una mejor diferenciación entre las categorías de la dieta, en lugar de analizar superficies más pequeñas. Las comparaciones de las facetas de los molares superiores e inferiores revelan variaciones significativas dependiendo de la contribución a la fase I de cizallamiento bucal o lingual durante el ciclo de masticación. Investigar la señal de microdesgaste a lo largo de la fila de dientes no revela ninguna variación significativa entre los molares que pertenecen a la misma fila de dientes. Sin embargo, cuando se simulan tres muestras fósiles compuestas de molares superiores e inferiores aislados de M1 a M3 de los tres grupos de ovejas, nuestro estudio destaca la obtención de resultados deficientes en la discriminación de las categorías respecto a la dieta.
Palabras clave: Análisis de textura de microdesgaste dental; representatividad; mamíferos; dieta; oveja; prueba controlada de alimentos
Traducción: Enrique Peñalver (Sociedad Española de Paleontología)
Résumé en Français
Dépasser les problèmes d'échantillonnage en tribologie dentaire: Avancée à partir d'une expérimentation sur les moutons
Les micro-usures dentaires sont utilisées en paléoécologie depuis près de 50 ans. Les développements techniques de ces dernières décennies permettent désormais de capturer en 3D les surfaces d'émail et par conséquent de caractériser dans son ensemble les textures des micro-usures. Bien que l'analyse texturale des micro-usures dentaires soit largement utilisée, peu d'études ont testé les effets de la représentativité, ou de la variabilité du signal le long d'une facette dentaire ou d'une rangée dentaire. Quelles informations peut-il être extrait d'un échantillon fossile quand seule l'usure dentaire est considérée ? Pouvons-nous proposer des inférences sur une espèce quand les échantillons fossiles sont composés de dents isolées ? Ces points restent à caractériser avec des cas d'études paramétrées. Dans cette étude, nous nous confrontons à ces problèmes méthodologiques. Une expérimentation d'alimentation contrôlée sur des moutons domestiques fournit le cadre à partir duquel nous testons ces problèmes méthodologiques.
Notre étude révèle qu'une surface carrée de 200µm de côté permet une meilleure discrimination entre catégories alimentaires que les surfaces plus réduites. La comparaison des facettes des molaires supérieures et inférieures révèle des différences significatives selon que ces facettes soient impliquées dans la phase I sécante linguale ou buccale au cours de la mastication. Aucune différence significative n'est détectée lorsque sont comparées les mêmes facettes sur la rangée molaire. Néanmoins lorsque nous considérons trois échantillons fossiles composés de tous types de molaires et simulés par tirages aléatoires respectivement au sein de chacun des trois lots de brebis alimentées avec des régimes différents, notre étude montre des discriminations médiocres.
Mots-clés : Analyses texturales des micro-usures dentaires, représentativité, mammifères, alimentation, mouton, tests d'alimentation contrôlée
Translator: Authors
Deutsche Zusammenfassung
Die Probennahme bei dentaler Tribologie überwinden: Einblicke aus einem Experiment an Schafen
Dentale Microwear wird in der Paläontologie seit fast einem halben Jahrhundert angewendet. Neue Technologien in der letzten Dekade erlaubten es, den Oberflächenzahnschmelz in 3 D zu scannen und so Microwear Texturen als Ganzes zu charakterisieren. Obwohl die Analyse von dentalen Microwear Texturen weit verbreitet ist, haben wenige Untersuchungen die Themen Stichproben-Repräsentativität oder die Variabilität des microwear Signals entlang einer Facette oder einer Zahnreihe angegangen. Wieviel Information kann genau aus einer Fossilprobe extrahiert werden, wenn man den Zahnabrieb betrachtet? Können wir exakte Schlussfolgerungen über eine gesamte Art ziehen, basierend auf Fossilien die aus einzelnen Zähnen bestehen? Diese Fragen müssen in einem kontrollierten Umfeld charakterisiert werden. In dieser Untersuchung gehen wir dieses Thema von Grund auf an. Eine groß angelegte kontrollierte Fressgewohnheits-Studie mit Hausschafen liefert den Rahmen in dem diese fundamentale Fragen getestet werden. Unsere Ergebnisse heben hervor, dass bei einer Oberfläche von 200 × 200 µm die Fressgewohnheiten besser unterschieden werden können, was der Analyse kleinerer Oberflächen gegenläufig ist. Facetten-Vergleiche der unteren und oberen Molaren zeigen signifikante Variationen je nach Beitrag zu entweder der buccalen oder lingualen Scherphase I während des Kauzyklus. Die Untersuchung des Microwear Signals entlang der Zahnreihe bringt keine Signifikaten Variationen zwischen Molaren derselben Zahnreihe zum Vorschein. Bei der Simulation von drei Fossilproben, die aus isolierten oberen und unteren Molaren von M1 bis A3 von drei Mutterschafen bestehen, hebt unsere Untersuchung wenige Ergebnisse bei der Unterscheidung von Fress-Kategorien hervor.
Schlüsselwörter: Dentale Microwear Texturanalyse; Repräsentativität; Säugetiere; Fressgewohnheit; Schafte; kontrollierte-Nahrung-Test
Translator: Eva Gebauer
Arabic

Translator: Ashraf M.T. Elewa
-
-
-
Review: The Princeton Field Guide to Mesozoic Sea Reptiles
 The Princeton Field Guide to Mesozoic Sea Reptiles
Article number: 26.1.1R
April 2023
 Poster Winners 2024