

 Diversification dynamics of the Mesozoic ostracod family Cyprideidae Martin, 1940: Disentangling taxonomic inflation and environmental drivers
Article number: 28.3.a54
https://doi.org/10.26879/1600
Copyright Paleontological Society, November 2025
Author biography
Plain-language and multi-lingual abstracts
PDF version
Supplementary Text 1
Supplementary Text 2
Supplementary Text 3
Submission: 29 June 2025. Acceptance: 19 November 2025.
ABSTRACT
Studying fossil records of organisms can provide a direct window to their long-term macroevolutionary dynamics. The Cyprideidae Martin, 1940 are an extinct family of non-marine ostracods with exceptionally abundant fossil records. Thus, they have significantly contributed to our understanding of the past ecological and environmental dynamics of non-marine environments. However, despite their importance in paleoecology and paleoenvironmental studies, detailed macroevolutionary dynamics of Cyprideidae have rarely been studied. Here, we compiled fossil records of Cyprideidae from the literature and analyzed their diversification dynamics within a Bayesian framework, focusing on records from Europe, Africa, and Americas. As it has been suggested that taxonomic inflation might be contributing to the apparent explosive radiation of Cyprideidae, we also generated datasets in which species were randomly synonymized based on spatiotemporal distributions to examine how taxonomic inflation might affect our conclusion. We also analyzed the contribution of various environmental factors to find which variables potentially impacted the diversification dynamics. Our results indicate that Cyprideidae went through evolutionary radiation during the Jurassic-Cretaceous transition, even under the scenario of extreme taxonomic inflation. However, the drivers underlying these dynamics were difficult to identify. We conclude the paper by discussing some biological and methodological matters regarding our results.
Wonseop Lim. Department of Earth Science Education, Seoul National University, Seoul 08826, Republic of Korea. david9456@snu.ac.kr https://orcid.org/0009-0007-1004-2326
Keywords: Bayesian, speciation/extinction rate, non-marine ostracod
Final citation: Lim, Wonseop. 2025. Diversification dynamics of the Mesozoic ostracod family Cyprideidae Martin, 1940: Disentangling taxonomic inflation and environmental drivers. Palaeontologia Electronica, 28(3):a54.
https://doi.org/10.26879/1600
palaeo-electronica.org/content/2025/5732-evolutionary-dynamics-of-cyprideidae
Copyright: November 2025 Paleontological Society.
This is an open access article distributed under the terms of Attribution-NonCommercial-ShareAlike 4.0 International (CC BY-NC-SA 4.0), which permits users to copy and redistribute the material in any medium or format, provided it is not used for commercial purposes and the original author and source are credited, with indications if any changes are made.
creativecommons.org/licenses/by-nc-sa/4.0/
INTRODUCTION
Cyprideidae Martin, 1940 is an extinct family of non-marine ostracods belonging to the superfamily Cypridoidea, which includes, among others, the type-genus Cypridea Bosquet, 1852. They are believed to be among the most successful cypridoids to colonize non-marine habitats, likely representing a stem group to the major lineages of extant Cypridoidea (Whatley, 1990, Whatley and Ballent, 1996, Sames et al., 2010). Cyprideidae flourished throughout the Late Jurassic to Early Cretaceous but went extinct in most parts of the world during the transition from Early Cretaceous (Horne and Colin, 2005, Sames, 2011), although, they persisted until the Paleogene in eastern Asia (Guan, 1988, Ye, 1994), India (Kapur and Khosla, 2019), and western North America (Swain, 1999). Due to their rich fossil record throughout the Mesozoic non-marine strata, cyprideids provide a rich source of information for disciplines such as biostratigraphy, paleogeography, paleoecology, and paleoenvironmental studies (e.g., Carbonel et al., 1988, Colin and Lethiers, 1988, van Harten, 1988, Whatley, 1988a, Keen, 1993, Sames, 2011).
Despite their widespread use in geological sciences, only a few studies have addressed the macroevolutionary dynamics of the Cyprideidae. Whatley (1986, 1988b, 1990, 1992) analyzed diversity dynamics of major clades of Mesozoic ostracods based on the species/genus count data obtained from the exhaustive compilation of publications. Whatley (1988b, 1990, 1992) observed that Cypridoidea--whose diversity during the Late Jurassic to Early Cretaceous was largely dominated by Cyprideidae--underwent explosive radiation following the colonization of non-marine habitats in the Middle Jurassic, and suggested that such radiation must have occurred through the interplay of abiotic factors--such as major global marine regression--and biotic factors--such as an ability to lay desiccation resistant resting eggs and mixed reproduction strategy, which facilitated environmental tolerance and rapid dispersal. It was also pointed out that high rates of extinction occurred at the start of the Aptian period, the period of major marine transgression (Hancock and Kauffman, 1979, Scotese et al, 2025). Although some of the arguments made by these works were questioned in later studies (e.g., Horne and Martens, 1998), it is plausible that evolutionary novelties of the Cyprideidae coupled with the availability of new habitats enabled evolutionary radiation.
However, a number of studies (Sames, 2010, 2011, Sames and Horne, 2011, 2012) have pointed out that past assumptions of endemicity of fossil ostracods likely have been exaggerated, leading to splitting of the geographically widely distributed species. Potential taxonomic inflation can also be substantial within the same region as well. For example, Nye et al. (2008) synonymized Cypridea clavata Anderson and Cypridea bogdenensis Anderson, and questionably Cypridea insulae Anderson as well, into a single species. Such inflation could produce artifactual burst in diversity, potentially confounding interpretations of macroevolutionary patterns (Sames, 2011, Faurby et al. 2016, Zachos 2016). Therefore, explicitly assessing the impact of taxonomic inflation on diversification dynamics would be valuable for improving the robustness of such analyses.
Despite the insights given by the Whatley’s pioneering works, we still have a limited understanding of the macroevolutionary dynamics of the Cyprideidae. The present study, therefore, aims to shed light into the diversification dynamics of the family in a quantitative framework. Thanks to the recent theoretical and methodological advancements, it has become possible to analyze the diversification dynamics from fossil occurrence data with incomplete preservation and a high proportion of singletons (i.e., species with only single known occurrence) (Silvestro et al., 2014b, Silvestro et al., 2019, Warnock et al., 2020). Using published fossil records of Cyprideidae from Europe, Africa, and Americas, we analyzed their temporal diversification dynamics, accounting for incompleteness and uncertainty in the fossil record. To assess how potential taxonomic inflation affects the robustness of the diversification dynamics analysis, we used a random synonymization approach, in which each species was randomly synonymized based on its spatiotemporal distribution, to simulate scenarios with varying levels of taxonomic inflation.
We also analyzed the association between the diversification dynamics of Cyprideidae and its potential drivers. Diversification dynamics of a clade result from the interaction of organisms with various environmental and ecological factors (Benton, 2009). The Late Jurassic to Early Cretaceous was a period of dynamic environmental change, marked by the continued fragmentation of Pangaea and significant sea-level fluctuations (Tennant et al., 2017, Scotese et al., 2025) that may have contributed to the macroevolutionary dynamics of Cyprideidae. Disentangling the specific factors that influenced the diversification dynamics and how they could have acted as their driver may offer valuable insights into the evolutionary history of Cyprideidae.
In summary, this study had two specific aims. First, using a newly compiled fossil occurrence dataset of Cyprideidae, we analyzed its temporal diversification dynamics and assessed the robustness of these results against potential taxonomic inflation to gain insights into their diversification history. Second, we aimed to explore the possible ecological and environmental drivers of the reconstructed diversification patterns. By integrating new data with quantitative methods, we provide a general outline of the evolutionary history and dynamics of the cyprideids.
MATERIALS AND METHODS
Fossil Occurrence Data Collection
We here define Cyprideidae following Sames (2011), with the addition of Paraplesiocypridea Ayress and Whatley, 2014 (Table 1, see Sames, 2011 for detailed taxonomic accounts and diagnosis). Ayress and Whatley (2014) established a new family, Alloiocyprideidae, and removed “some species” of Kegelina Queiroz Neto et al., 2014 from Cyprideidae to be included in this family. However, their concept of Alloiocyprideidae is somewhat ambiguous, and they also did not indicate which species of Kegelina are to be moved to this family, nor their justification. Thus, we here tentatively treat Kegelina as belonging to Cyprideidae.
Although there are numerous of publications regarding Cyprideidae, databases for fossil occurrences are extremely poor. There are only about 750 fossil records of Cypridocopina deposited in the Paleobiology Database (https://paleobiodb.org) (accessed on September 28th, 2024), and only less than 100 of them belong to Cyprideidae. Thus, we manually compiled fossil occurrences from the published papers. When collecting fossil occurrences, we restricted our effort to those from Africa, North and South Americas, and Western Eurasia. Macroevolutionary dynamics of Cyprideidae within East Asia are indeed intriguing, as they flourished long after their relatives were extinct in other regions of the world (Guan, 1988, Ye, 1994, Hou et al., 2002). However, as pointed out before, numerous descriptions of East Asian Cyprideidae in the past were often based on poor grounds (Wang et al, 2013, Qin et al., 2021). Although an active revision of East Asian Cyprideidae is ongoing (e.g., Wang et al., 2013, Choi and Huh, 2016, Ye et al., 2022), this still seems far from complete. Thus, at least for now, we decided not to include them in our analysis. We also excluded Cenozoic and some Late Cretaceous records of cyprideids from North America, as they seem to be a secondary introduction from East Asia (Swain, 1999, Sames, 2011) (see Supplementary Text 1).
Only records of accepted names identified to species level, from literature published between January 1931 and June 2024, were considered. We also set the resolution of the analysis to species; thus, subspecies level records were collapsed into species level records (although with very few exceptions, when there was a severe temporal mismatch between subspecies of the same species, see Table S1 and Supplementary Text 1 for details), and records that were not identified to species level (e.g., Cypridea aff. valdensis, Paracypridea sp.) were discarded. Species identification was corrected following the up-to-date taxonomic revisions whenever possible (e.g., Schudack, 1994, Nye et al., 2008, Schudack and Schudack, 2009, Sames, 2011). We set the resolution of the fossil records to a sample collected from a single locality and excluded all the fossil records that were reported in higher lithological units, for example, geological strata (e.g. Formations).
When spatial coordinates for each fossil occurrence were given in any form, they were translated to longitude and latitude. When only the written description or the map of the locality was given, coordinates of the approximate location were used. Records with overly vague descriptions of the locality (e.g., “West African coast”) were discarded. Paleocoordinates of each occurrence were calculated using the R package palaeoverse v 1.4.0 (Jones et al., 2023) using midpoint ages of each occurrence and the PALEOMAP rotation model (Scotese, 2016). When the absolute age range of the strata including the fossil was given, that range was used as an age of the fossil record. However, only rarely do fossil records come with an absolute age, and in the majority of cases, relative ages such as biozones or geological stages had to be translated to absolute ages. When there was a well-established local stage or biozonation, they were used to assign absolute ages after being re-scaled to conform to the International Chronostratigraphic Chart (Cohen et al., 2013, Version. 2023/09). If not, the absolute age range of the geological stage of the given stratum was used (see Table S1 and Supplementary Text 1 for details).
Spatial Standardization of Fossil Occurrences
It is well known that fossil records are spatially structured, meaning they are not randomly sampled and exhibit spatial bias (Vilhena and Smith, 2013, Holland, 2016, Close et al., 2020, Benson et al., 2021). Thus, we performed spatial standardization of fossil records following Flannery-Sutherland et al. (2022) to minimize the existing spatial bias. This method aims to subsample fossil occurrences by controlling the minimum spanning tree (MST) length as well as the longitudinal-latitudinal extent for each spatial window, in order to obtain a spatially standardized, unbiased subsample while minimizing data loss; see Flannery-Sutherland et al. for details.
As regional diversification dynamics can be heterogeneous (Vermeij and Leighton, 2003, McGowan and Smith, 2008, Benton et al., 2021, Flannery-Sutherland et al., 2022), we performed the spatial standardization for three different spatial windows: Global (pooling all records), NAfEu (North Africa and Europe), and WAfSAm (West Africa and South America). We decided to group the records from North Africa (including the Middle East) with Europe, and West Africa with South America (excluding Argentine records), because these regions underwent similar environmental fluctuations and shared similar ostracod assemblages during the Mesozoic (e.g., Andreu et al., 2003, Poropat and Colin, 2012, Chnayna et al., 2021). We did not perform a separate analysis for other regions (e.g., North America, Argentina), as the low species diversity of these regions did not allow a reliable inference of diversification dynamics.
Sliding spatial windows were set for each region using the spacetimewind function, and then spatially standardized based on the MST length and latitude-longitude extent using the spacetimestand function. After spatial standardization, we checked whether a correlation between taxonomic diversity at the stage level and fluctuation in spatial extent was still present in the dataset. For this purpose, we obtained a diversity curve with shareholder quorum subsampling (SQS) (Alroy, 2010) with a sampling quorum of 0.5 using the spacetimestand function, which utilizes estimateD function from the R package iNEXT (Hsieh et al., 2016). We then conducted one-tailed Pearson and Spearman correlations between the SQS curve and MST length, latitudinal, and longitudinal range to check if undesirable correlations between spatial extent and diversity were still present. As a reference, we also calculated these correlations under unstandardized datasets.
Analysis of Diversification Dynamics
PyRate v 3.1.3 (Silvestro et al., 2014a, 2014b, 2019) was used to generate temporal dynamics of speciation, extinction, and preservation rates of taxa through time. Datasets were replicated 100 times before the analysis using the extract.ages function implemented in PyRate. We then tested three different preservation models with model testing based on AICc (Sugiura, 1978): (1) Homogeneous Poisson process model (HPP), where preservation rates are constant, (2) Nonhomogeneous Poisson process model (NHPP), where preservation rates of lineages follow symmetric PERT distribution (Silvestro et al., 2014b) and (3) Time-variable Poisson process model (TPP), where preservation rates are constant within predefined geological stages (Silvestro et al., 2019). Among all models, the TPP model was best supported for all three datasets (Table 2) and thus was selected for further analysis.
We conducted 100 million (Global, NAfEu) or 50 million (WAfSAm) iterations of reversible jump Markov chain Monte Carlo (RJMCMC) (Green, 1995, Silvestro et al., 2019), adjusting the sampling frequency to obtain a total of 10,000 posterior samples from each replicate. We considered preservation rate heterogeneity across lineages with four discrete gamma rate categories (Yang, 1994, Silvestro et al., 2014b), while setting the rate parameter of the gamma hyperprior for the preservation rate to be inferred from the data. For the WAfSAm dataset, initial exploratory analysis resulted in a dramatic drop in both speciation and extinction rates during the first 1 million years of the process, indicating a spurious edge effect (Foote, 2000, Černý et al., 2022). We thus forced the shifts in speciation and extinction rate to only happen after 144 Mya for this dataset. The initial 10% of posterior samples were discarded as burn-in. We combined posterior estimates of the resulting 100 replicates to obtain past temporal dynamics of speciation, extinction rates, and diversity for each dataset. Mixing and effective sample sizes for parameters were monitored using Tracer v 1.7.2 (Rambaut et al., 2018). Analysis was done for both spatially standardized and unstandardized datasets.
Analysis with Random Synonymization Scenarios
To see to what extent our conclusions regarding the diversification dynamics of Cyprideidae were robust against taxonomic inflation, we generated replicate datasets where species were randomly synonymized and performed diversification rate analysis to see whether the main conclusions were still held. First, using species range estimates obtained from the unstandardized Global PyRate analysis (which includes all species), we identified which species pairs temporally overlapped. Then, we generated an undirected random graph with each species as a node, with an adjacency matrix M constructed in the following way: (1) if two species i and j did not temporally overlap, or if they belonged to different genera, set Mij = 0; and if two species temporally overlapped and belonged to the same genus, (2) set Mij ~Bernoulli(p) if two species shared common geographical distribution (see Table S1 and Supplementary Text 1), or (3) set Mij ~Bernoulli(q) if they do not. After these procedures, all species that were connected were synonymized.
Based on the taxonomic history, it seems the taxonomic inflation within the same region is much more frequent--due to, for example, oversplitting or confusing sexually dimorphic individuals as different species (e.g., Nye et al., 2008, Sames, 2011). Cross-region taxonomic inflation is possible (e.g., Sames, 2011) but is likely to happen on rarer occasions. Thus, we generated multiple realizations of synonymization scenarios by simulating multiple adjacency matrices under different values of p > q : p = 0.01, 0.02, 0.03 in combination with q = p /10, p /5, p /2. We give some justification for the use of these parameters in Supplementary Text 3. For each combination, five random scenarios were constructed, and we performed PyRate analysis as above using 10 replicate datasets.
Effects of Biotic and Abiotic Variables on Diversification Dynamics
We considered following biotic and abiotic variables: clade diversity (CD), CO2 concentration (CO2), global mean surface temperature (GMST), eustatic sea level (ESL), continental fragmentation (CF), mean basin size (BS), number of basins (BN), lake area (LA), and physiographic diversity index (PI). Paleoenvironmental reconstructions for the same variable can vary significantly when the reconstruction methods differ (Ruban, 2016, McClelland et al., 2021). Thus, we used multiple reconstructions of the same environmental variables for the analysis when possible. The environmental variables used are listed in Table 3. When the raw data for the variables were not available, we used Webplotdigitizer (Rohatgi, 2024) to extract the time series from the figure. Every time series was interpolated to make the time frames equal, using cubic spline when the average interval was larger than 1 Myr, and linear interpolation otherwise.
Among the variables considered in this study, the following were generated separately for each regional dataset: BS, BA, LN, PI, and CF based on the shoreline development index (CF_SDI). CF_SDI is defined as equation 1:
![]()
where P is a coastline length and A is a continental area (Hutchinson, 1957), calculated based on the paleocoastline reconstruction of Kocsis and Scotese (2021) (see Supplementary Text 2 For details). Unlike the continental fragment index suggested by Zaffos et al. (2017) (CF_ZEA), SDI is directly related to the fragmentation of the continental area and thus might be more relevant for terrestrial organisms (Neubauer et al., 2022). BS, BN, LA, and PI were obtained from the paleolandscape reconstruction of Salles et al. (2023). For each regional polygon, we calculated a mean size (BS) and number (BN) of overlapping drainage basins, total area of lakes (flooded regions in endorheic basins, LA), and mean physiographic diversity index (PI), which considers relative topographic relief, slope, and water discharge (Salles et al., 2023).
We examined the relationship between diversification dynamics of Cyprideidae using the Multivariate Birth Death model (MBD, Lehtonen et al., 2017). The MBD model takes a temporal range of each species as an input and correlates speciation and extinction rates with a linear combination of candidate variables in a linear or exponential way (Lehtonen et al., 2017, see also Silvestro et al., 2015); here, we used an exponential correlation model. By default, MBD uses the horseshoe prior (Carvalho et al., 2009, 2010) to perform a shrinkage estimation. Although horseshoe prior-induced shrinkage does not directly perform variable selection, variables with shrinkage weight under 0.5 are usually considered as insignificant (Carvalho et al., 2009, 2010, Silvestro et al., 2017). For the aforementioned variables, we performed MBD analysis for the species ranges extracted from PyRate analysis (both standardized and unstandardized) with 250 million MCMC iterations.
RESULTS
Data Collection and Spatial Standardization
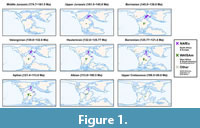 Our full dataset consisted of 1,528 occurrences representing 237 species, including 1,136 occurrences of 107 species in the NAfEu dataset and 183 occurrences of 86 species in the WAfSAm dataset (Figure 1, Table S1). Spatial standardization resulted in the deletion of 600 occurrences and the complete removal of 137 species, mostly from South America and Western Africa, from the Global dataset. In the NAfEu and WAfSAm datasets, spatial standardization led to the deletion of 48 and 14 occurrences, respectively, along with the complete removal of 11 and 6 species. Correlations between SQS curve and MST length, latitudinal, and longitudinal range for the standardized and unstandardized datasets are presented in Table S2-Table S3.
For the NAfEu and WAfSAm datasets, all correlations were insignificant in both the standardized and unstandardized versions, suggesting that spatial sampling bias may not have been substantial even prior to spatial standardization. If this is the case, excessive standardization may lead to unnecessary data pruning, ultimately reducing statistical power, which is the reason why we analyzed both spatially standardized and unstandardized datasets. In contrast, the correlations between the SQS curve and MST length, as well as longitudinal range, were significant in the unstandardized Global dataset. MST length was effectively addressed by the spatial standardization, but a significant correlation remained for longitudinal range even after spatial standardization (Table S2). We therefore note that the results for the Global dataset should be interpreted with caution.
Diversification Dynamics of Cyprideidae
 Speciation, extinction, and diversification rates throughout time are shown in Figure 2, Figure 3, Figure 4 and Figure S1. Speciation rates of both the spatially standardized and unstandardized datasets exhibited qualitatively similar trends, although rate shifts tended to occur more abruptly in the unstandardized datasets, and the rate curves of the spatially standardized datasets were somewhat more smoothed out, even when the original datasets did not exhibit strong spatial bias (Figure 2, Figure 3).
 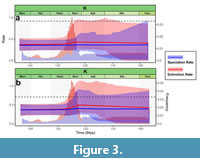 NAfEu dataset showed a relatively high speciation rate throughout the Jurassic, but with very wide credible intervals, likely due to very sparse fossil sampling during this period (Figure 2). However, starting approximately in the Tithonian, these intervals narrowed down, and the speciation rate reached its highest value. This was maintained until the early Berriasian, after which it sharply dropped down and remained mostly stable, with a slight decrease of speciation rate during the Hauterivian-Aptian interval for the unstandardized dataset. The Global dataset was largely in agreement with the NAfEu dataset (Figure S1), and the speciation rate for the WAfSAm dataset was inferred to be mostly constant over time (Figure 3).
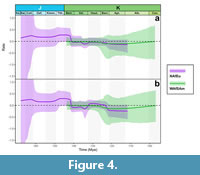 The extinction rate inferred from the unstandardized NAfEu dataset was mostly constant over time, but it showed a slight decline during the Valanginian-Hauterivian transition, followed by a rebound to its previous level during the Barremian (Figure 2). This pattern was smoothed out in the spatially standardized dataset, although the decline-rebound trend was still reflected in the credible interval. In the WAfSAm dataset, the extinction rate was also mostly constant, with a slight increase during the Barremian followed by a gradual decline (Figure 3). The extinction rate curve for the Global dataset differed between the spatially standardized and unstandardized datasets, and also deviated from the NAfEu datasets, suggesting that spatial structure may have influenced the curve estimates (Figure S1). Net diversification rates largely reflected the speciation dynamics as expected, peaking during the Jurassic-Cretaceous transition, and thereafter remaining close to zero (Figure 4).
 The results of the random synonymyzation analysis for the NAfEu dataset are shown in Figure 5. Each cell represents a plot of the speciation or extinction rate from five replicate datasets generated for each combination of and value. For both and, regardless of, speciation rate showed similar patterns to those of the original dataset, which peaks during the Jurassic-Cretaceous transition, after which it drops significantly. For the case of, some replicates showed mostly constant speciation rate throughout time. However, we note that these cases represent a rather extreme case of taxonomic inflation, in which 20 to 40% of species were synonymized (see Supplementary Text 3). The results of the Global dataset largely agreed with the NAfEu dataset (Figure S2). As expected, the speciation and extinction rates of the WAfSAm dataset were mostly constant (Figure S3), which was expected from the results of the original dataset (Figure 3).
Multivariate Birth-Death Analysis
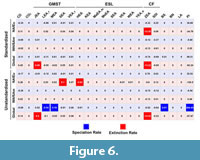 The result of the MBD analysis is shown in Figure 6. All analyses converged well except for the unstandardized WAfSAm dataset. Speciation rate did not correlate significantly with any of the variables in the spatially standardized datasets (i.e., shrinkage weight < 0.5). In the unstandardized datasets, significant correlations between speciation rate and environmental variables were found only in the Global dataset--with GMST (LEA_F, MEA), BS, and PI. However, we must emphasize again that the Global dataset is spatially biased, and therefore, these significant correlations may simply reflect artifacts introduced by its spatial structure. Also, the correlation parameter for the two GMST variables had opposite signs, and the parameter for BS was relatively small.
Extinction rate showed a significant negative correlation with CF (ZEA) in the NAfEu and Global datasets, though not in the unstandardized NAfEu dataset. For the Global datasets (both standardized and unstandardized), extinction rate was positively correlated with GMST (JEA). In the unstandardized NAfEu dataset, extinction rate showed weak but significant positive correlations with GMST (SEA) and ESL (HEA). Both standardized and unstandardized WAfSAm datasets did not show any significant correlations with any variables for either speciation or extinction rate.
DISCUSSION
Previous studies (Whatley, 1986, 1988b, 1990, 1992) noted that species diversity in Cypridoidea peaked during the Berriasian, followed by a gradual decline throughout the remainder of the Mesozoic. Although this surge was suggested to be driven by the radiation of Cyprideidae (Whatley, 1988), the analyses were conducted at the superfamily or class level and did not directly assess diversification dynamics of the family. Moreover, they were largely descriptive and did not explicitly account for the incompleteness of the fossil record.
Our study applies a model-based approach to infer diversification dynamics of Cyprideidae while accounting for incomplete fossil sampling. The results indicate that Cyprideidae underwent evolutionary radiation during the Jurassic-Cretaceous transition, at least in North Africa and Europe (Figure 2). This pattern persisted even when species in the dataset were randomly synonymized (Figure 5), indicating that taxonomic inflation is unlikely to substantially affect this conclusion. However, with the onset of the Cretaceous, their speciation rate dropped significantly, and net diversification rate mostly fluctuated near zero (Figure 2, Figure 3, Figure 4).
So, what could be driving these diversification dynamics? In previous studies, this was mostly attributed to evolutionary innovations in Cyprideidae, coupled with global marine regression during the Jurassic-Cretaceous transition (Whatley, 1988b, 1990, 1992, Horne and Martens, 1998). However, sea level showed no significant correlation with either speciation or extinction rates in any of the datasets analyzed--except for the unstandardized NAfEu dataset, where extinction rate was weakly correlated with sea level estimates from Haq and colleagues (Haq and Al-Qahtani, 2005, Haq, 2014, 2017). Even in this case, the sign of correlation parameter was negative (Figure 6), contradicting the intuitive expectation that rising sea levels would have driven the extinction of cyprideids.
This result is somewhat unexpected, as geological evidence suggests that the decline of Cyprideidae correlates with marine transgression (e.g., Anderson, 1985, Poropat and Colin, 2012). One possibility is that these patterns are purely regional, and that sea level is not a primary driver of diversification dynamics at a broader geographic scale. Another possibility is that marine regression during the Jurassic-Cretaceous transition did, in fact, create ecological opportunities for the initial radiation of cyprideids, but the subsequent sea-level fluctuation throughout the Cretaceous did not significantly contributed to the diversification dynamics. It is also possible that the evolutionary timeframe of Cyprideidae is too short to detect a significant correlation between sea-level fluctuations and diversification dynamics, or that the number of speciation and extinction events--on which the MBD analysis relies--is too limited to yield statistically significant results.
The continental fragmentation index of Zaffos et al. (2017) showed a significant negative correlation with extinction rates in the NAfEu and Global datasets (except for the unstandardized NAfEu dataset, where the shrinkage weight was 0.49) (Figure 6). This index reflects the fragmentation of continental crusts caused by tectonic activity, which may have altered the landscape of potential cyprideid habitats. However, how such fragmentation influences diversification dynamics, and particularly why a negative correlation between continental fragmentation and extinction rates was observed, is not straightforward, and needs further investigation. Temperature also showed significant positive correlation with extinction rates in the unstandardized NAfEu and Global datasets (Figure 6). Although it is well acknowledged that a change in temperature can affect extinction dynamics (e.g., Song et al., 2021, Kaiho, 2022), significant correlations were found only for a limited subset of GMST variables, and the signs of correlation coefficients were inconsistent. This prevented us from drawing definitive conclusions about the relationship or underlying mechanisms; given that no consistent drivers of diversification dynamics were identified, it seems possible that the diversification of Cyprideidae was shaped more by opportunistic events than by persistent external environmental controls, or alternatively, by ecological or environmental variables overlooked herein, such as competition with clades with similar ecological niches.
It is also important to note that in our MBD analysis, we used multiple reconstructions for the same environmental variable, which are highly correlated (Figure S4). Previous studies have suggested that using horseshoe prior might lead to arbitrary selection among highly correlated variables when performing a variable selection based on shrinkage weights (Piironen and Vehtari, 2017), although it may still perform reasonably well in practice (Lu and Lou, 2022). The behavior of variable selection in MBD when there is multicollinearity warrants further investigation, especially given that even without using multiple reconstructions for the same variable, paleoenvironmental time series are often highly correlated due to their reliance on shared data sources.
In this study, we only focused on a subset of the fossil records of Cyprideidae. Although PyRate can handle the incompleteness of fossil records, its inference is conditioned on the species present within the dataset (i.e., it assumes that all species that existed through time were sampled at least once) and does not consider the effects of unsampled lineages contributing to the true evolutionary history of the clade of interest (Warnock et al. 2020). Failing to account for this uncertainty can result in biased estimates of diversification rate (Bush et al. 2004, Warnock et al. 2020). This is particularly relevant to Cyprideidae, as many of the important records are not identified to the species level, and were therefore excluded from our analysis. Assigning proper taxonomic identifications to these occurrences could significantly enrich the database available for studying Cyprideidae diversification dynamics, ultimately contributing to more accurate and robust results. Moreover, myriad records of cyprideids from East Asia were entirely excluded from our study. The fossil record of cyprideids in this region is exceptionally rich. For example, Hou et al. (2002) list over 350 species of Cyprideidae from China alone. While the accuracy of this number remains contingent on future taxonomic revisions, such a high number of species and fossil occurrences holds great potential of enhancing our understanding of diversification dynamics in general, and to elucidate why the cyprideids in this region flourished even after the demise of their relatives on the other parts of the world (e.g., presence of numerous long-standing lakes throughout the Cretaceous (Chen, 1987, Wan et al., 2007)).
CONCLUSION
By integrating newly compiled data with a quantitative Bayesian framework, we show that Cyprideidae underwent evolutionary radiation during the Jurassic-Cretaceous transition, followed by a protracted decline in diversification. This pattern persisted across a wide range of random synonymization scenarios, indicating that our conclusions are robust to potential taxonomic inflation. While previous hypotheses emphasized environmental drivers such as sea-level change, our MBD analysis revealed only limited and inconsistent correlations between diversification dynamics and the environmental variables considered. This highlights that the primary drivers of cyprideid diversification remain unresolved and may involve opportunistic events or unaccounted factors--such as competition with ecologically similar groups (e.g., cypridids). Future work incorporating fossil records not yet identified to the species level and expanding geographic coverage (e.g., East Asia) will help to clarify the mechanisms underlying the rise and fall of this once-dominant lineage.
ACKNOWLEDGEMENTS
We thank Byung-Do Choi, Byeon-Gak Choi, Lucas Antonietto, and Benjamin Sames for useful suggestions and for providing us with otherwise inaccessible literature. We additionally thank Byung-Do Choi for reviewing the manuscript. This study was funded by the Faculty of Liberal Education (Seoul National University): SNU 2024 Undergraduate Independent Research Program.
Data Availability
Codes and data used for this study is available from: https://github.com/wnsplim/Cyprideidae_data
REFERENCES
Alroy, J. 2010. The shifting balance of diversity among major marine animal groups. Science, 329(5996):1191-1194.
https://doi.org/10.1126/science.1189910
Anderson, F. W. 1939. Wealden and Purbeck Ostracoda. Journal of Natural History, 3(15):291-310.
https://doi.org/10.1080/03745481.1939.9723605
Anderson, F. W. 1985. Ostracod faunas in the Purbeck and Wealden of England. Journal of Micropalaeontolgy, 4(2):1-67.
https://doi.org/10.1144/jm.4.2.1
Andreu, B., Colin, J. P., Haddoumi, H., and Charrière, A. 2003. Les ostracodes des «couches rouges» du synclinal d’Aït Attab, Haut Atlas central, Maroc: systématique, biostratigraphie, paléoécologie, paléobiogéographie. Revue de Micropaléontologie, 46(4):193-216.
https://doi.org/10.1016/j.revmic.2003.09.001
Ayress, M. A., and Whatley, R. C. 2014. Early Cretaceous non‐marine Ostracoda from the North Falkland Basin, South Atlantic. Palaeontology, 57(6):1143-1175.
https://doi.org/10.1111/pala.12109
Benson, R. B., Butler, R., Close, R. A., Saupe, E., and Rabosky, D. L. 2021. Biodiversity across space and time in the fossil record. Current Biology, 31(19):R1225-R1236.
https://doi.org/10.1016/j.cub.2021.07.071
Benton, M. J. 2009. The Red Queen and the Court Jester: species diversity and the role of biotic and abiotic factors through time. Science, 323(5915):728-732.
https://doi.org/10.1126/science.1157719
Bosquet, J. 1852. Description des entomostracés fossiles des terrains tertiaires de la France et de la Belgique. Mémoires Couronnés et Mémoires des Savants Étrangers, 24:1-142.
Bush, A. M., Markey, M. J., and Marshall, C. R. 2004. Removing bias from diversity curves: the effects of spatially organized biodiversity on sampling-standardization. Paleobiology, 30(4):666-686.
https://doi.org/10.1666/0094-8373(2004)030%3C0666:rbfdct%3E2.0.co;2
Carbonel, P., Colin, J. P., Danielopol, D. L., Löffler, H., and Neustrueva, I. 1988. Paleoecology of limnic ostracodes: a review of some major topics. Palaeogeography, Palaeoclimatology, Palaeoecology, 62(1-4):413-461.
https://doi.org/10.1016/0031-0182(88)90066-1
Carvalho, C. M., Polson, N. G., and Scott, J. G. 2009. Handling sparsity via the horseshoe. Proceedings of Machine Learning Research, 5:73-80.
Carvalho, C. M., Polson, N. G., and Scott, J. G. 2010. The horseshoe estimator for sparse signals. Biometrika, 97(2):465-480.
https://doi.org/10.1093/biomet/asq017
Černý, D., Madzia, D., and Slater, G. J. 2022. Empirical and methodological challenges to the model-based inference of diversification rates in extinct clades. Systematic Biology, 71(1):153-171.
https://doi.org/10.1093/sysbio/syab045
Chen, P. J. 1987. Cretaceous paleogeography in China. Palaeogeography, Palaeoclimatology, Palaeoecology, 59:49-56.
https://doi.org/10.1016/0031-0182(87)90073-3
Chnayna, M., Sames, B., Trabelsi, K., Houla, Y., Hanini, A., Elferhi, F., Skanji, A., Wagreich, M., and Soussi, M. 2021. Discovery of a new Lower Cretaceous Wealden-type ostracod fauna from the Bouhedma Formation, Central Tunisian Atlas, North Africa. Cretaceous Research, 127:104942.
https://doi.org/10.1016/j.cretres.2021.104942
Choi, B. D., and Huh, M. 2016. Mongolocypris kohi sp. nov.: A new Early Cretaceous non-marine ostracod species from the Jinju Formation, South Korea. Cretaceous Research, 57:239-247.
https://doi.org/10.1016/j.cretres.2015.09.008
Close, R. A., Benson, R. B., Saupe, E. E., Clapham, M. E., and Butler, R. J. 2020. The spatial structure of Phanerozoic marine animal diversity. Science, 368(6489):420-424.
https://doi.org/10.1126/science.aay8309
Cohen, K. M., Finney, S. C., Gibbard, P. L., and Fan, J. X. 2013. The ICS international chronostratigraphic chart. Episodes, 36(3):199-204.
https://doi.org/10.18814/epiiugs/2013/v36i3/002
Colin, J. P., and Lethiers, F. 1988. The importance of ostracods in biostratigraphic analysis., p. 27-45. In De Dekker, P., Colin, J. P., and Peypouquet, J. P. (eds.), Ostracoda in the Earth Sciences. Elsevier, Amsterdam.
Faurby, S., Eiserhardt, W. L., and Svenning, J. C. 2016. Strong effects of variation in taxonomic opinion on diversification analyses. Methods in Ecology and Evolution, 7(1):4-13.
https://doi.org/10.1111/2041-210X.12449
Flannery-Sutherland, J. T., Silvestro, D., and Benton, M. J. 2022. Global diversity dynamics in the fossil record are regionally heterogeneous. Nature Communications, 13:2751.
https://doi.org/10.1038/s41467-022-30507-0
Foote, M. 2000. Origination and extinction components of taxonomic diversity: general problems. Paleobiology, 26(S4):74-102.
https://doi.org/10.1017/S0094837300026890
Foster, G. L., Royer, D. L., and Lunt, D. J. 2017. Future climate forcing potentially without precedent in the last 420 million years. Nature Communications, 8:14845.
https://doi.org/10.1038/ncomms14845
Green, P. J. 1995. Reversible jump Markov chain Monte Carlo computation and Bayesian model determination. Biometrika, 82(4):711-732.
https://doi.org/10.1093/biomet/82.4.711
Guan, S. Z. 1988. Palaeocene non-marine ostracods in China, p. 1147-1152. In Hanai, T., Ikeya, N., and Ishizako, K. (eds.), Evolutionary Biology of Ostracoda: Its Fundamentals and Applications. Developments in Palaeontology and Stratigraphy, Volume 11. Elsevier, Amstredam.
https://doi.org/10.1016/S0920-5446(08)70245-0
Hancock, J. M., and Kauffman, E. G. 1979. The great transgressions of the Late Cretaceous. Journal of the Geological Society, 136(2):175-186.
https://doi.org/10.1144/gsjgs.136.2.0175
Haq, B. U. 2014. Cretaceous eustasy revisited. Global and Planetary Change, 113:44-58.
https://doi.org/10.1016/j.gloplacha.2013.12.007
Haq, B. U. 2017. Jurassic sea-level variations: a reappraisal. GSA Today, 28(1):4-10.
https://doi.org/10.1130/GSATG359A.1
Haq, B. U., and Al-Qahtani, A. M. 2005. Phanerozoic cycles of sea-level change on the Arabian Platform. GeoArabia, 10(2):127-160.
https://doi.org/10.2113/geoarabia1002127
Horne, D. J., and Colin, J. P. 2005. The affinities of the ostracod genus Cypridea Bosquet, 1852, and its allies, with consideration of implications for the phylogeny of nonmarine cypridoidean ostracods. Revue de Micropaléontologie, 48(1):25-35.
https://doi.org/10.1016/j.revmic.2004.12.003
Horne, D. J., and Martens, K. 1998. An assessment of the importance of resting eggs for the evolutionary success of Mesozoic non-marine cypridoidean Ostracoda (Crustacea), p. 549-561. In Brendock, L., de Meester, L., and Hairston, N. (eds.), Evolutionary and Ecological Aspects of Crustacean Diapause. Advances in Limnology, Volume 52. Schweizerbart Science Publishers, Stuttgart.
Holland, S. M. 2016. The non-uniformity of fossil preservation. Philosophical Transactions of the Royal Society B: Biological Sciences, 371(1699):20150130.
https://doi.org/10.1098/rstb.2015.0130
Hou, Y. T., Gou, Y. X., and Chen, D. Q. 2002. Fossil Ostracoda of China, Volume 1: Superfamilies Cypridacea and Darwinulidacea. Science Press, Beijing.
Hsieh, T. C., Ma, K., and Chao, A. 2016. iNEXT: an R package for rarefaction and extrapolation of species diversity (Hill numbers). Methods in Ecology and Evolution, 7(12):1451-1456.
https://doi.org/10.1111/2041-210X.12613
Hutchinson, G. B. 1957. A Treatise on Limnology. Volume 1. Geography, Physics, and Chemistry. John Wiley and Sons, New York.
Jones, L. A., Gearty, W., Allen, B. J., Eichenseer, K., Dean, C. D., Galván, S., Kouvari, M., Godoy, P. L., Nicholl, C. S. C., Buffan, L., Dillon, E. M., Flannery-Sutherland, J. T., and Chiarenza, A. A. 2023. palaeoverse: A community‐driven R package to support palaeobiological analysis. Methods in Ecology and Evolution, 14(9):2205-2215.
https://doi.org/10.1111/2041-210X.14099
Judd, E. J., Tierney, J. E., Lunt, D. J., Montañez, I. P., Huber, B. T., Wing, S. L., and Valdes, P. J. 2024. A 485-million-year history of Earth’s surface temperature. Science, 385(6715):eadk3705.
https://doi.org/10.1126/science.adk3705
Kaiho, K. 2022. Relationship between extinction magnitude and climate change during major marine and terrestrial animal crises. Biogeosciences, 19(14):3369-3380.
https://doi.org/10.5194/bg-19-3369-2022
Kapur, V. V., and Khosla, A. 2019. Faunal elements from the Deccan volcano‐sedimentary sequences of India: a reappraisal of biostratigraphic, palaeoecologic, and palaeobiogeographic aspects. Geological Journal, 54(5):2797-2828.
https://doi.org/10.1002/gj.3379
Karlsen, K. S., Conrad, C. P., and Magni, V. 2019. Deep water cycling and sea level change since the breakup of Pangea. Geochemistry, Geophysics, Geosystems, 20(6):2919-2935.
https://doi.org/10.1029/2019GC008232
Keen, M. C. 1993. Ostracods as palaeoenvironmental indicators: examples from the Tertiary and Early Cretaceous, p. 41-67. In Jenkins, D. G. (ed.), Applied Micropalaeontology. Springer Netherlands, Dordrecht.
https://doi.org/10.1007/978-94-017-0763-3_2
Kocsis, Á. T., and Scotese, C. R. 2021. Mapping paleocoastlines and continental flooding during the Phanerozoic. Earth-Science Reviews, 213:103463.
https://doi.org/10.1016/j.earscirev.2020.103463
Krömmelbein, K. 1962. Zur taxionomie und biochronologie stratigraphische wichtiger Ostracoden-Arten aus der Oberjurassisch?-unterkretazischen Bahia-Serie (Wealden-Fazies) NE-Brasiliens. Senckenbergiana Lethaea, 43:437-527.
Landwehrs, J., Feulner, G., Petri, S., Sames, B., and Wagreich, M. 2021. Investigating Mesozoic climate trends and sensitivities with a large ensemble of climate model simulations. Paleoceanography and Paleoclimatology, 36(6):e2020PA004134.
https://doi.org/10.1029/2020PA004134
Lehtonen, S., Silvestro, D., Karger, D. N., Scotese, C., Tuomisto, H., Kessler, M., Peña, C., and Antonelli, A. 2017. Environmentally driven extinction and opportunistic origination explain fern diversification patterns. Scientific Reports, 7:4831.
https://doi.org/10.1038/s41598-017-05263-7
Lu, Z., and Lou, W. 2022. Bayesian approaches to variable selection: a comparative study from practical perspectives. The International Journal of Biostatistics, 18(1):83-108.
http://doi.org/10.1515/ijb-2020-0130
Marcilly, C. M., Torsvik, T. H., and Conrad, C. P. 2022. Global Phanerozoic sea levels from paleogeographic flooding maps. Gondwana Research, 110:128-142.
https://doi.org/10.1016/j.gr.2022.05.011
Martin, G. P. R. 1940. Ostracoden des norddeutschen Purbeck und Wealden. Senckenbergiana 22(5-6):275-361.
McClelland, H. L. O., Halevy, I., Wolf‐Gladrow, D. A., Evans, D., and Bradley, A. S. 2021. Statistical uncertainty in paleoclimate proxy reconstructions. Geophysical Research Letters, 48(15):e2021GL092773.
https://doi.org/10.1029/2021GL092773
McGowan, A. J., and Smith, A. B. 2008. Are global Phanerozoic marine diversity curves truly global? A study of the relationship between regional rock records and global Phanerozoic marine diversity. Paleobiology, 34(1):80-103.
https://doi.org/10.1666/07019.1
Merdith, A. S., Williams, S. E., Collins, A. S., Tetley, M. G., Mulder, J. A., Blades, M. L., Young, A., Armistead, S. E., Cannon, J., Zahirovic, S., and Müller, R. D. 2021. Extending full-plate tectonic models into deep time: Linking the Neoproterozoic and the Phanerozoic. Earth-Science Reviews, 214:103477.
https://doi.org/10.1016/j.earscirev.2020.103477
Mills, B. J., Krause, A. J., Scotese, C. R., Hill, D. J., Shields, G. A., and Lenton, T. M. 2019. Modelling the long-term carbon cycle, atmospheric CO2, and Earth surface temperature from late Neoproterozoic to present day. Gondwana Research, 67:172-186.
https://doi.org/10.1016/j.gr.2018.12.001
Neubauer, T. A., Hauffe, T., Silvestro, D., Scotese, C. R., Stelbrink, B., Albrecht, C., Delicado, D., Harzhauser, M., and Wilke, T. 2022. Drivers of diversification in freshwater gastropods vary over deep time. Proceedings of the Royal Society B, 289(1968):20212057.
https://doi.org/10.1098/rspb.2021.2057
Nye, E., Feist-Burkhardt, S., Horne, D. J., Ross, A. J., and Whittaker, J. E. 2008. The palaeoenvironment associated with a partial Iguanodon skeleton from the Upper Weald Clay (Barremian, Early Cretaceous) at Smokejacks Brickworks (Ockley, Surrey, UK), based on palynomorphs and ostracods. Cretaceous Research, 29(3):417-444.
https://doi.org/10.1016/j.cretres.2008.01.004
Piironen, J., and Vehtari, A. 2017. Sparsity information and regularization in the horseshoe and other shrinkage priors. Electronic Journal of Statistics, 11(2):5018-5051.
https://doi.org/10.1214/17-EJS1337SI
Poropat, S. F., and Colin, J. P. 2012. Early Cretaceous ostracod biostratigraphy of eastern Brazil and western Africa: an overview. Gondwana Research, 22(3-4):772-798.
https://doi.org/10.1016/j.gr.2012.06.002
Qin, Z. H., Xi, D. P., Choi, B. D., Ye, Y. Q., and Wan, X. Q. 2021. Lowermost occurrence of ostracod Cypridea species in East Asia and implications for the non-marine Jurassic/Cretaceous boundary. Palaeoworld, 30(1):148-168.
https://doi.org/10.1016/j.palwor.2020.04.003
Queiroz Neto, J. V., Sames, B., and Colin, J. P. 2014. Kegelina: a new limnic ostracod (Cyprideidae, Cypridoidea) genus from the Lower Cretaceous of the Americas and Africa. Journal of Paleontology, 88(4):800-813.
https://doi.org/10.1666/13-019
Rambaut, A., Drummond, A. J., Xie, D., Baele, G., and Suchard, M. A. 2018. Posterior summarization in Bayesian phylogenetics using Tracer 1.7. Systematic Biology, 67(5):901-904.
https://doi.org/10.1093/sysbio/syy032
Rohatgi, A. 2024. Webplotdigitizer, Version 4.7.
https://automeris.io/WebPlotDigitizer
Roth, R. 1933. Some Morrison Ostracoda. Journal of Paleontology, 7(4):398-405.
Ruban, D. A. 2016. A “chaos” of Phanerozoic eustatic curves. Journal of African Earth Sciences, 116:225-232.
https://doi.org/10.1016/j.jafrearsci.2016.01.009
Salles, T., Husson, L., Lorcery, M., and Hadler Boggiani, B. 2023. Landscape dynamics and the Phanerozoic diversification of the biosphere. Nature, 624(7990):115-121.
https://doi.org/10.1038/s41586-023-06777-z
Sames, B. 2010. To correlate or not to correlate--that is not the question anymore! Continental Late Jurassic to Early Cretaceous supraregional correlation based on freshwater to brackish-water ostracodes. Palaios, 25(1):3-5.
https://doi.org/10.2110/palo.2010.S01
Sames, B. 2011. Early Cretaceous Cypridea Bosquet 1852 in North America and Europe. Micropaleontology, 57(4-5):345-431.
https://doi.org/10.47894/mpal.57.4.03
Sames, B., and Horne, D. J. 2011. Application of late Mesozoic non-marine ostracods: Quo vadis? Joannea Geologie und Paläontologie, 11:168-171.
Sames, B., and Horne, D. J. 2012. Latest Jurassic to Cretaceous non-marine ostracod biostratigraphy: Unde venis, quo vadis? Journal of Stratigraphy, 36(2):266-288.
Sames, B., Whatley, R., and Schudack, M. E. 2010. Praecypridea: a new non-marine ostracod genus from the Jurassic and Early Cretaceous of Europe, North and South America, and Africa. Journal of Micropalaeontology, 29(2):163-176.
https://doi.org/10.1144/0262-821X10-015
Schudack, U. 1994. Revision, dokumentation und stratigraphie der Ostracoden des nordwestdeutschen Oberjura und Unter-Berriasium. Berliner Geowissenschaftliche Abhandlungen. Reihe E, Paläobiologie, 11:1-193.
https://doi.org/10.23689/fidgeo-5930
Schudack, U., and Schudack, M. E. 2009. On the taxonomy of the species Cypridea setina Anderson, 1939 and Cypridea laevigata Dunker, 1846 (Ostracoda, Crustacea) from the Early Cretaceous of Europe--a special note on systematical inconsistencies. Berliner Paläobiologische Abhandlungen, 10:311-320.
Scotese, C. R. 2016. PALEOMAP PaleoAtlas for GPlates and the PaleoData plotter program.
http://www.earthbyte.org/paleomap-paleoatlas-for-gplates/
Scotese, C. R., Song, H., Mills, B. J., and van der Meer, D. G. 2021. Phanerozoic paleotemperatures: The Earth’s changing climate during the last 540 million years. Earth-Science Reviews, 215:103503.
https://doi.org/10.1016/j.earscirev.2021.103503
Scotese, C. R., Vérard, C., Burgener, L., Elling, R. P., and Kocsis, A. T. 2025. The Cretaceous world: plate tectonics, palaeogeography and palaeoclimate. Geological Society, London, Special Publications, 544:1-172.
https://doi.org/10.1144/SP544-2024-28
Silvestro, D., Salamin, N., and Schnitzler, J. 2014a. PyRate: a new program to estimate speciation and extinction rates from incomplete fossil data. Methods in Ecology and Evolution, 5(10):1126-1131.
https://doi.org/10.1111/2041-210X.12263
Silvestro, D., Schnitzler, J., Liow, L. H., Antonelli, A., and Salamin, N. 2014b. Bayesian estimation of speciation and extinction from incomplete fossil occurrence data. Systematic Biology, 63(3):349-367.
https://doi.org/10.1093/sysbio/syu006
Silvestro, D., Antonelli, A., Salamin, N., and Quental, T. B. 2015. The role of clade competition in the diversification of North American canids. Proceedings of the National Academy of Sciences, 112(28):8684-8689.
https://doi.org/10.1073/pnas.1502803112
Silvestro, D., Pires, M. M., Quental, T. B., and Salamin, N. 2017. Bayesian estimation of multiple clade competition from fossil data. Evolutionary Ecology Research, 18:41-59.
Silvestro, D., Salamin, N., Antonelli, A., and Meyer, X. 2019. Improved estimation of macroevolutionary rates from fossil data using a Bayesian framework. Paleobiology, 45(4):546-570.
https://doi.org/10.1017/pab.2019.23
Sohn, I. G. 1969. Nonmarine ostracodes of Early Cretaceous age from Pine Valley Quadrangle, Nevada. U. S. Geological Survey Professional Paper, 643-B:1-9.
https://doi.org/10.3133/pp643B
Sohn, I. G. 1979. Nonmarine ostracodes in the Lakota Formation (Lower Cretaceous) from South Dakota and Wyoming. U. S. Geological Survey Professional Paper, 1069:1-24.
https://doi.org/10.3133/pp1069
Song, H., Kemp, D. B., Tian, L., Chu, D., Song, H., and Dai, X. 2021. Thresholds of temperature change for mass extinctions. Nature Communications, 12:4694.
https://doi.org/10.1038/s41467-021-25019-2
Sugiura, N. 1978. Further analysis of the data by Akaike's information criterion and the finite corrections: Further analysis of the data by Akaike's. Communications in Statistics-Theory and Methods, 7(1):13-26.
https://doi.org/10.1080/03610927808827599
Swain, F. M. 1946. Middle Mesozoic nonmarine Ostracoda from Brazil and New Mexico. Journal of Paleontology:20(6), 543-555.
Swain, F. M. 1999. Fossil nonmarine Ostracoda of the United States. Developments in Palaeontology and Stratigraphy, Volume 16. Elsevier, Amstredam.
Szczechura, J. 1978. Fresh-water ostracodes from the Nemegt formation (upper Cretaceous) of Mongolia. Palaeontologia Polonica, 38:65-121.
Tennant, J. P., Mannion, P. D., Upchurch, P., Sutton, M. D., and Price, G. D. 2017. Biotic and environmental dynamics through the Late Jurassic-Early Cretaceous transition: evidence for protracted faunal and ecological turnover. Biological Reviews, 92(2):776-814.
https://doi.org/10.1111/brv.12255
Valdes, P. J., Scotese, C. R., and Lunt, D. J. 2021. Deep ocean temperatures through time. Climate of the Past, 17:1483-1506.
https://doi.org/10.5194/cp-17-1483-2021
van der Meer, D. G., Scotese, C. R., Mills, B. J., Sluijs, A., and van de Weg, R. M. 2022. Long-term Phanerozoic global mean sea level: Insights from strontium isotope variations and estimates of continental glaciation. Gondwana Research, 111:103-121.
https://doi.org/10.1016/j.gr.2022.07.014
van Harten, D. 1988. Chronoecology, a non-taxonomic application of ostracods, p. 47-54. In De Dekker, P., Colin, J. P., and Peypouquet, J. P. (eds.), Ostracoda in the Earth Sciences. Elsevier, Amstredam.
Vérard, C., Hochard, C., Baumgartner, P. O., Stampfli, G. M., and Liu, M. 2015. 3D palaeogeographic reconstructions of the Phanerozoic versus sea-level and Sr-ratio variations. Journal of Palaeogeography, 4(1):64-84.
https://doi.org/10.3724/SP.J.1261.2015.00068
Vermeij, G. J., and Leighton, L. R. 2003. Does global diversity mean anything? Paleobiology, 29(1):3-7.
https://doi.org/10.1666/0094-8373(2003)029%3C0003:DGDMA%3E2.0.CO;2
Vilhena, D. A., and Smith, A. B. 2013. Spatial bias in the marine fossil record. PLoS One, 8(10):e74470.
https://doi.org/10.1371/journal.pone.0074470
Wan, X. Q., Chen, P. J., and Wei, M. J. 2007. The Cretaceous system in China. Acta Geologica Sinica, 81(6):957-983.
https://doi.org/10.1111/j.1755-6724.2007.tb01019.x
Wang, Y., Sha, J., and Pan, Y. 2013. Revision of Cypridea (non-marine Ostracoda) from the early Cretaceous Yixian Formation of the Beipiao-Yixian basin in western Liaoning, northeast China. Cretaceous Research, 40:102-109.
https://doi.org/10.1016/j.cretres.2012.06.001
Warnock, R. C., Heath, T. A., and Stadler, T. 2020. Assessing the impact of incomplete species sampling on estimates of speciation and extinction rates. Paleobiology, 46(2):137-157.
https://doi.org/10.1017/pab.2020.12
Whatley, R. 1986. Biological events in the evolution of Mesozoic Ostracoda, p. 257-265. In Walliser, O. (ed.), Global Bio-Events. Lecture Notes in Earth Sciences, Volume 8. Springer Berlin, Heidelberg.
https://doi.org/10.1007/BFb0010213
Whatley, R. C. 1988a. Ostracoda and palaeogeography, p. 103-123. In De Dekker, P., Colin, J. P., and Peypouquet, J. P. (eds.), Ostracoda in the Earth Sciences. Elsevier, Amstredam.
Whatley, R. C. 1988b. Patterns and rates of evolution among Mesozoic Ostracoda, p. 1021-1040. In Hanai, T., Ikeya, N., and Ishizako, K. (eds.), Evolutionary Biology of Ostracoda: Its Fundamentals and Applications. Developments in Palaeontology and Stratigraphy, Volume 11. Elsevier, Amstredam.
https://doi.org/10.1016/S0920-5446(08)70236-X
Whatley, R. 1990. The relationship between extrinsic and intrinsic events in the evolution of Mesozoic non-marine Ostracoda, p. 253-263. In Kauffman, E.G., and Walliser, O.H. (eds.), Extinction Events in Earth History. Lecture Notes in Earth Sciences, Volume 30. Springer Berlin, Heidelberg.
https://doi.org/10.1007/BFb0011150
Whatley, R. 1992. The reproductive and dispersal strategies of Cretaceous nonmarine Ostracoda: the key to pandemism, p. 177-192. In Mateer, N. J., and Chen, P. J. (eds.), Aspects of Nonmarine Cretaceous Geology. China Ocean Press, Beijing.
Whatley, R. C., and Ballent, S. C. 1996. In search of the earliest nonmarine cypridacean ostracods: new discoveries from the early Mesozoic of western Argentina. Georesearch Forums, 1-2:111-118.
Wright, N. M., Seton, M., Williams, S. E., Whittaker, J. M., and Müller, R. D. 2020. Sea-level fluctuations driven by changes in global ocean basin volume following supercontinent break-up. Earth-Science Reviews, 208:103293.
https://doi.org/10.1016/j.earscirev.2020.103293
Yang Z. 1994. Maximum likelihood phylogenetic estimation from DNA sequences with variable rates over sites: approximate methods. Journal of Molecular Evolution, 39:306-314.
https://doi.org/10.1007/BF00160154
Ye, C. 1994. Succession of Cypridacea (Ostracoda) and nonmarine Cretaceous stratigraphy of China. Cretaceous Research, 15(3):285-303.
https://doi.org/10.1006/cres.1994.1018
Ye, Y., Xi, D., Sun, L., Do Carmo, D. A., Antonietto, L. S., Leite, A. M., Qin, Z., and Wan, X. 2022. Ostracoda from the Santonian-Campanian (Upper Cretaceous) Nenjiang and Sifangtai formations, Songliao Basin, northeastern China. Journal of Paleontology, 96(1):174-195.
https://doi.org/10.1017/jpa.2021.70
Young, A., Flament, N., Williams, S. E., Merdith, A., Cao, X., and Müller, R. D. 2022. Long-term Phanerozoic sea level change from solid Earth processes. Earth and Planetary Science Letters, 584:117451.
https://doi.org/10.1016/j.epsl.2022.117451
Zachos, F. E. 2016. The practical relevance of species concepts and the species problem, p. 163-174. In Zachos, F. E. (ed.), Species Concepts in Biology. Springer Cham, Cham.
https://doi.org/10.1007/978-3-319-44966-1_7
Zaffos, A., Finnegan, S., and Peters, S. E. 2017. Plate tectonic regulation of global marine animal diversity. Proceedings of the National Academy of Sciences, 114(22):5653-5658.
https://doi.org/10.1073/pnas.1702297114
