

 Accurate specimen digitization through glass achieved and validated using 3D surface scanning
Article number: 27.2.a44
https://doi.org/10.26879/1375
Copyright Palaeontological Association, August 2024
Author biographies
Plain-language and multi-lingual abstracts
PDF version
Submission: 9 February 2024. Acceptance: 24 July 2024.
ABSTRACT
Three-dimensional digitization and morphometric analyses of specimens have become a crucial source of data for natural sciences. However, the quest for thorough sampling has been impaired by exhibition practices of locking specimens behind glass. In this contribution, we tested how well structured white-light scanning and phone-powered photogrammetry (helped with parallel lasers) capture the morphology of a variety of fossil specimens behind modern (i.e., flat) and old (i.e., undulating) glass. Postprocessing of scans was often longer, essentially to remove duplicated surfaces. Nevertheless, we were able to generate precise and accurate meshes through modern glass (validated by scanning objects without the glass): 91-100% of comparable points deviated < 1 mm from the reference model and 89-99% deviated < 0.5 mm. Older glass multiplies the deviations, especially for large, three dimensional specimens. However, these models still have 75 to 94 % of their points deviating less than 0.5 mm from the reference model, which thus remains manageable. We also conducted a linear morphometric analysis on a diagenetically flattened ichthyosaurian and a high-density geometric morphometric analysis of an hippuritid bivalve. The differences in surface digitization techniques (e.g., laser VS structured white-light scanning) and the human error in landmark placement generate more deviation than the presence or absence of glass. We conclude that, with the right scanning methods, specimens can be confidently digitized through glass and incorporated into morphometric (or other digital modelling) analyses.
Valentin Fischer. Evolution & Diversity Dynamics Lab, Université de Liège, 4000 Liège, Belgium (corresponding author). v.fischer@uliege.be
Nicolas Vaczi. Evolution & Diversity Dynamics Lab, Université de Liège, 4000 Liège, Belgium and Département Sciences et Technologies, Haute Ecole en Hainaut, 7000 Mons, Belgium. nicolasvaczi@gmail.com
Rebecca F. Bennion. Evolution & Diversity Dynamics Lab, Université de Liège, 4000 Liège, Belgium and Palaeobiosphere Evolution, Royal Belgian Institute of Natural Sciences, Brussels, Belgium. rbennionpalaeo@gmail.com
Romain Cottereau. Evolution & Diversity Dynamics Lab, Université de Liège, 4000 Liège, Belgium. romain.cottereau@uliege.be
Jessica Lawrence Wujek. Physical Sciences Department, Howard Community College, 10901 Little Patuxent Parkway, Columbia, Maryland, USA. jdlawren@gmail.com
Jamie A. MacLaren. Evolution & Diversity Dynamics Lab, Université de Liège, 4000 Liège, Belgium and Functional Morphology Lab, Department of Biology, Universiteit Antwerpen, Antwerpen 2610, Belgium. jamie.maclaren@uantwerpen.be
Keywords: Digitization; 3D; conservation; geometric morphometrics; Ichthyosauria
Final citation: Fischer, Valentin, Vaczi, Nicolas, Bennion, Rebecca F., Cottereau, Romain, Wujek, Jessica Lawrence, and MacLaren, Jamie A. 2024. Accurate specimen digitization through glass achieved and validated using 3D surface scanning. Palaeontologia Electronica, 27(2):a44.
https://doi.org/10.26879/1375
palaeo-electronica.org/content/2024/5265-digitisation-through-glass
Copyright: August 2024 Palaeontological Association.
This is an open access article distributed under the terms of the Creative Commons Attribution License, which permits unrestricted use, distribution, and reproduction in any medium, provided the original author and source are credited.
creativecommons.org/licenses/by/4.0
INTRODUCTION
Specimen digitization technologies such as computed tomography (CT) scanning, photogrammetry, and surface scanning have revolutionised palaeontology (Cunningham et al., 2014). These advances have provided a wealth of accurate three-dimensional (3D) models of ancient phenotypes, enabling unique collections to be digitised for posterity (e.g., Adams et al., 2015; Karim et al., 2016; Davies et al., 2017; Kouraiss et al., 2019; Hedrick et al., 2020) and also facilitating broad scale phenotypic analyses, notably via morphometrics (e.g., Bjarnason and Benson, 2020; Goswami et al., 2022) and biomechanics (e.g., Lautenschlager et al., 2018). However, this quest for digitization can often be impaired by historical specimen exhibition strategies. For example, in the nineteenth century it was popular to mount large blocks containing specimens in wooden boxes, often covered with a glass front. A famous (yet digitizable) example of this style of specimen display is the Marine Reptile Gallery at the Natural History Museum in London, which features over a hundred marine reptiles mounted in glass cases on the walls. Many of these specimens are holotypes and neotypes of ichthyosaurians and plesiosaurians; unfortunately, the glass fronts to the exhibits often renders these vitally important specimens inaccessible for research (Zverkov and Jacobs, 2021). More generally, glass mounts are a ubiquitous feature in many museums worldwide, and many external researchers have already experienced difficulties in having these glass protections removed for research. This severely limits the sampling efforts for studies that require linear measurements and three-dimensional shape, not to mention notable financial drawbacks for researchers travelling long distances and being unable to fully access specimens on arrival.
Finding a way to accurately digitize and scale these specimens would alleviate some of the issues related to (semi-)permanent specimen display. Despite photogrammetry being capable of digitizing images through glass, the method encounters difficulties due to reflections on shiny glass surfaces requiring polarizing filters (Mallison and Wings, 2014), or the lack of ideal lighting conditions (Falkingham, 2012). Here, we test how structured white-light scanning and cameraphone-based photogrammetry accurately captures the morphology of (palaeo)zoological specimens through glass. We test the influence of modern (i.e., flat) and old (i.e., undulating) glass by (i) comparing the deviation of similar points with a reference mesh on a wide range of specimens, from diagenetically flattened (‘2.5D’) Palaeozoic echinoids to an extant ibex skull (full 3D), and by (ii) applying and comparing linear and high-density geometric morphometric methods on two case studies (an Early Jurassic ichthyosaurian and a Cretaceous rudist, respectively). Moreover, we showcase a device we designed for projecting a laser scale onto specimens through glass, allowing accurate scaling of pictures and 3D meshes obtained through photogrammetry. This quantification of error from different 3D surface digitization methods goes hand-in-hand with a call for transparency in reporting protocols, errors, and inaccuracies, as well as establishing consistent good practice in specimen digitization (Davies et al., 2017; Díez Díaz et al., 2021).
MATERIALS AND METHODS
Sampling, Photographing, and Scanning
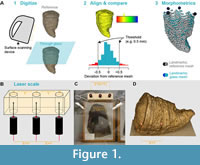 We sampled a series of 11 extinct and extant metazoan specimens spanning a broad range of colours, geometries, and diagenetic alterations (Table 1) from the fossil collections of the Université de Liège (Belgium, institutional abbreviation ULgPA). Each of these specimens was scanned with a structured white-light scanner with a broad field of view (Artec Eva, precision ≈ 0.5 mm) and with a more precise scanner, to allow comparisons between digitization method in addition to the presence of glass (either a structured white-light scanner with a narrow field of view [Artec Spider, precision ≈ 0.2 mm] or a laser scanner [Creaform Handyscan 300, precision = 0.2 mm]). All specimens were then scanned through two types of glass (a recent, flat glass and an older, undulating (blowglass-like) glass) using the white-light scanners (Figure 1). Specimens were placed approximately 150 mm from the glass and both kinds of glass have the same thickness, about 0.5 mm. Two specimens (a hyena skull ULgPA1806 and a juvenile ichthyosaurian ULgPA13413) were scanned through thicker, horizontal showcase glass; this replicated another kind of museum setup. Each structured light scan was processed using the automated parameters in Artec Studio v17, with the following procedure: cleaning, alignment, global registration, merging, meshing, mesh simplification. Holes in the mesh surface were automatically closed if < 5 mm and left open otherwise. Laser scans were processed with Creaform VxElements v11 (aligning, merging, meshing). Holes in the mesh surface were automatically closed if small and left open otherwise. Errors and difficulties in digitization are discussed (Figure 2, see below).
 Photogrammetric models were generated for two specimens (a rudist bivalve ULgPA3727 and a juvenile ichthyosaurian preserved on a slab. ULgPA13413). We took ~35 pictures around the rudist specimen, and ~50 for the ichthyosaurian, in each setting (air/reference + modern glass + old glass for the rudist, and air/reference + horizontal glass for the ichthyosaurian). Images were taken with a 12 MP camera mounted within an iPhone 11 pro. By current standards this has a fairly low resolution and would directly affect the quality of the models produced. However, our goal here is to test the effect of using affordable methods available to any researcher worldwide as well as compare these results to those obtained using professional-grade scanners. Pictures were imported in Reality Capture v1.2 (RC © Epic Games Slovakia), and surface meshes were created using the standard, automated procedure without control points or ground controls (Import Inputs > Align Images > Calculate Model [Normal quality] > Texturise > Colourize [Normal quality]). We then manually removed triangles created in poorly visible areas, so that only reliable surfaces were compared to one another to assess mesh deviations. Scanning and photogrammetry were performed in the exact same location with constant lighting conditions (overcast conditions with neon lighting from above).
Laser Scaling Device
Scaling specimens is a cornerstone of photogrammetry and is strongly compromised when specimens are locked behind glass. We solved this by creating ‘Scale3000’, a device projecting parallel lasers onto the specimen, perpendicular to the glass, with the beams separated by a known distance (Figure 1B). Because the beam is set perpendicular to the glass, we estimate that the deviation of the beam is negligible. We confirm this by analysing centroid size differences in 3D geometric morphometrics (see below). This device is a modification from what has been used in ecological studies aiming to estimate the size of animals in the wild (Bergeron, 2007; Rothman et al., 2008; Rohner et al., 2011); the main advantage of our method is that it does not require the researcher to know the lens focal length nor the distance from the object being studied. Further technical details on Scale3000 will be published online after publication of the paper.
Analyses of Mesh Deviations
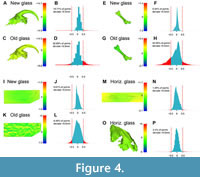
 The resultant models were aligned in Artec Studio v17 (although alignment can also be done in a freeware of choice, such as MeshLab or CloudCompare) and were reexported as.stl files. These meshes were imported in pairs (for example reference mesh + modern glass mesh) in the open source software CloudCompare v2.13.alpha (http://www.cloudcompare.org) (Figure 1, Figure 3, Figure 4). Meshes were then finely registered, allowing optimal overlap and alignment (root mean square difference set at the default value of 10-5). We then computed the cloud/mesh (C2M) distance, using the default parameters (signed distances, multi-threaded), and exported the histogram data of the signed distances for processing and visualisation in R v.4.2.1 (Table 2).
Morphometrics
 Deviation from a reference model offers a good estimation of the effect of digitization technique or settings on 3D model accuracy. However, it is also important to understand the effect that scanning through glass might have on morphometric measurements. Indeed, many morphometric studies employ Z-transformed ratios or two/three-dimensional XY(Z) coordinates as measures of shape or form, which will then be subjected to a Procrustes superimposition, reducing the need to have highly accurate estimates of absolute size. It is thus valuable to understand the effect of digitizing through glass in these ‘real-life’/applied scenarios such as linear and geometric morphometric studies.
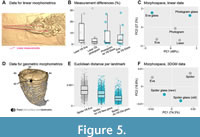 To examine the effect on linear morphometrics and functional ratios, we recorded linear measurements on the skull and teeth of the ichthyosaurian ULgPA13413 (Ichthyosaurus sp.) on meshes obtained via: Artec Eva, Artec Eva through horizontal glass, Handyscan300 (laser scanner, 0.2 mm precision), and photogrammetry. Measurements taken followed the method of Bennion et al. (2022) (see Table 3,Table 4, Figure 5). We compared the deviations introduced by scanning method (laser VS white-light- against those induced by the presence of glass (white-light VS white-light behind glass) using a Wilcoxon two-sample test. A single operator (VF) did all the measurements to avoid the interoperator bias.
To assess the effect on geometric morphometric data acquisition, we applied a semi-automated high-density surface landmarking protocol (after Fischer et al., 2022) on the external surface of the right valve of the rudist ULgPA3727 (Hippurites radiosus). The sequence of fixed landmarks is as follows (Figure 5): 1, extremity of the attached valve; 2, commissure (valve junction), deepest longitudinal groove on the posterior surface; 3, commissure, anteroventral extremity of a trapezoidal boss on the anterior surface; 4, commissure, small, damaged arch on the dorsal surface; 5: commissure, small groove on the ventral surface. This landmarking scheme was applied to meshes obtained via: Artec Eva, Artec Spider, Artec Spider through modern glass, and Artec Spider through old glass, with fixed landmarks placed using Stratovan Checkpoint v.20.10.13.0859. These landmarks were exported as.pts files and imported into R for semi-automated surface semi-landmark placement; 2000 surface semi-landmarks were used with a dome-shaped atlas mesh (see the protocol in Fischer et al. (2022)). These fixed and surface semi-landmarks were submitted to a Generalised Procrustes Superimposition and visualised via a principal component analysis.
Data Availability
We place all our data and scripts in the Institutional repository of the Université de Liège (orbi.uliege.be). This includes: (i) the 3D template and landmarks for high-density 3D landmarking; (ii) a dataset of linear measurements on a specimen of Ichthyosaurus; (iii) the R script to generate histograms from CloudCompare data; (iv) the R script for running high-density 3D geometric morphometrics; (v) all 3D models. Supporting data for this paper are available for download as Supplementary Data.
RESULTS
Digitization Process
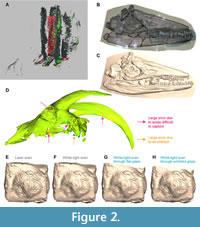
Capturing surface data through glass can be challenging. It was often impossible to obtain quality data with the more precise scanner (Artec Spider; Figure 2). There are two reasons for this: (i) it requires a close distance to the object and the ≈150 mm distance between the object and the glass made it impractical to use, and (ii) it was often interpreting glass reflections as relevant shapes, creating parallel and often imbricated surfaces that are difficult to clean up. In the worst cases, this produced partially distorted copies of the target surface, overlapping the genuine data (Figure 2), and thus required painstaking cleaning. This was rare with the structured white-light scanner with a larger field of view, which requires a longer distance from the object (Artec Eva), and therefore most results focus on the meshes obtained by this scanner. Another minor issue observed was that when scanning perpendicular to the glass, flashes sometimes appeared on the texture of the models (Figure 2). While this reduced the amount of detail which could be extracted from the texture, such as minute bone sutures, the effect did not appear to influence the quality of the mesh (Figure 2), only the colouration of the resultant surface.
Additionally, an effect of scanning method distinct from the XYZ placement of landmark points was the precision of the model; precision describes the ability for the digitization method to capture minute details of the object in the resultant digital version. We found that scanning through glass, especially undulating glass, generated less precise models (Figure 2), where the boundaries between anatomical elements became less perceptible. However, the effect of glass was less marked than differences generated by different scanning technologies (Figure 2) (see also Díez Díaz et al., 2021).
Mesh Deviations
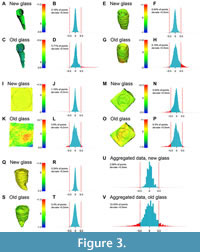
The presence of modern, flat glass between subject and scanner/camera resulted in accurate meshes, where a high percentage (89.3-99.8%) of the points deviated from the reference model by less than 0.5 mm (Figure 3, Figure 4; Table 2); 0.5 mm was the limit of detection of the scanner we used for most of these analyses (Artec Eva; Table 1). If a threshold of 1 mm is selected instead, this proportion of accurate meshes digitised behind modern glass increased to 91.7-100% (Figure 3, Figure 4; Table 2). When considering different object shapes, the worst results by far were those obtained from the extant goat skull, which is a fully 3D object (Capra hircus; ULgPA20230320-1). Problematic points were not distributed randomly but were found in areas that were difficult to reach without a marked angle (e.g., the inside surface of the orbit, the palate, the ventrolateral surface of the basicranium; Figure 2). Scanning with a strong angle increased reflections, and this reduced the data gathered in these areas, producing less accurate surfaces. Our aggregated results, taking all the points measured, recover a mean of 2% points deviating for more than 0.5 mm (Figure 3).
The effect of older, undulating, blown glass were more difficult to predict. Generally, this kind of glass multiplied the deviations; the percentage of points deviating more than the thresholds was similar, often multiplied by a factor of 1.5-3, but sometimes much higher (up to 177 times higher; Table 2). Two specimens skewed this high proportion of inaccurate points when scanned through undulating glass (instead of flat glass): the cave bear femur (Ursus spelaeus; ULgPA12766) and the extant goat skull (Capra hircus; ULgPA20230320-1). The femur was a long object (493 mm long) and was purposefully placed obliquely with respect to the glass to mimic possible arrangement in museums. As a result, some parts of the specimen were closer and easier to capture by circling in front of the specimen, while the range of angles we could use to scan the most remote parts were smaller, resulting in less accurate data. Still, while 24.75% (100-75.25%) of points deviated by more than 0.5 mm compared to the reference mesh, this metric of inaccuracy dropped to 3.31% when a threshold of 1 mm was selected instead (Table 2). Aggregated data found 12.45% of the points deviated by more 0.5 mm (Figure 3).
Morphometrics
The biggest challenge faced was the accurate placement of points for linear measurements or fixed-point landmarks. This was due to the fact that some digitization methods (white-light vs. laser scanning) and older glass reduced the precision of the model (Figure 2), making it more difficult to pinpoint small anatomical structures with precision. As a result, greater human error was induced in measurements and landmark placement, with this error being linked to the scanning technique used. We provide the raw measurements and the linear morphometric ratios obtained from multiple meshes generated on the ichthyosaurian specimen in Table 3 and Table 4, respectively. The average deviation of the ratios is roughly ≤5% for both the laser vs. white-light comparison and the air vs. (horizontal) glass comparison (Figure 5; Table 4). A Wilcoxon two-sample test did not regard either of these sets of deviations as significantly distinct from one another (p-value = 0.6048). Nevertheless, a couple of ratios deviated more notably (>15%); this appeared to be the case more frequently for comparisons between scanning methods rather than for comparisons between the presence or absence of glass (Figure 5). The morphospace resulting from a Principal Component Analysis of these linear ratios also recovers a stronger influence of the scanning methods (oriented along the first axis, which accounted for 48.95% of the total variance), whereas the presence of glass was essentially represented along the second axis (accounting for 27.2% of the total variance).
The picture was similar for high-density three-dimensional morphometrics. The Euclidean distance per fixed and surface semi-landmarks was larger in between scanning techniques (laser vs. white-light) than for the presence of glass (Figure 5). Our two-sample Wilcoxon test recovered the methods (laser vs. the two white-light populations combined) and the type of glass (white-light new glass vs. white-light old glass) as significantly distinct (p-value < 0.001 in both cases). Perhaps counterintuitively, the distance in landmark placements between the reference mesh and the mesh generated through glass appeared slightly smaller through old glass compared to new glass (Figure 5), possibly indicating a stronger influence of human error than mesh shape differences. In any case, these differences were very small; the maximal difference in centroid size was 0.64%, also possibly reflecting human error in the placement of fixed landmarks. The resulting morphospace was similar to the one generated for our linear morphometric case study, in the sense that the scanning methods (white-light with Artec Eva vs. white-light with Artec Spider) form the extremes of the first axis of the Principal Coordinate Analysis (accounting for 74.3% of the total variance) and the presence of glass structures the second axis (accounting for 16.8% of the total variance) (Figure 5).
DISCUSSION AND CONCLUSIONS
Can We Efficiently Digitize an Object Through Glass?
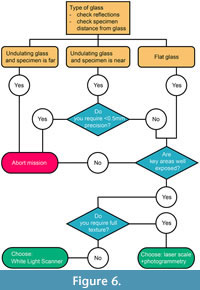 Our assessment of the capabilities of structured white-light surface scanning and photogrammetry through glass is reassuring: the presence of flat glass is not distorting specimens and accurate models can be generated with minor deviations from the original specimen. Older ‘blown’ glass, with its undulating surface, creates more deviations, which are sometimes manageable, sometimes above the precision threshold we used in some of our previous studies (i.e., scans with precisions of 0.2-0.6 mm) (e.g., MacLaren et al., 2022; Fischer et al., 2022). Our results nevertheless suggest that the scanning method (see also Díez Díaz et al., 2021) and the human error in landmark/anatomical point placement are bigger factors in driving morphometric differences than the presence of glass (see also Von Cramon-Taubadel et al., 2007; Shearer et al., 2017). Accordingly, we provide a decision tree to help anyone requiring a 3D model of (palaeo)biological specimens to assess whether a scan through glass is sensible and usable in quantitative studies (Figure 6). The key things to check and to plan are:
1. Check glass reflections at a ≈30° angle and estimate specimen distance from the glass.
2. Does your study require a precision < 1 mm, < 0.5 mm ?
3. Are key areas for your study well exposed and thus scannable at multiple angles?
4. Does your study require a full, detailed texture to place landmarks/measure traits?
The cost of handheld scanners, in addition to the cost of their associated software packages and computers with the required capabilities, is restrictive. Photogrammetry offers a cheaper alternative, using open source software which can be run on increasingly lower-cost devices (e.g., Falkingham, 2012). Furthermore, this technique of creating surface 3D models has already been shown to be especially useful for museum gallery specimens with access difficulties other than glass (e.g., large mounted skeletons) (Fau et al., 2016). The laser-scale device outlined in this study adds to the potential uses of photogrammetry in museum settings as it provides an affordable solution to researchers who require 3D model data or measurements from behind glass.
The Importance of Physical Access to Specimens
As outlined in our workflow above, 3D scanning is not always an appropriate method for obtaining data from specimens behind glass. This can particularly be the case where specimens are preserved in three dimensions with areas invisible or poorly visible by the scanning device or with areas that are obscured by the wooden edges of the display case. Our results found that areas of the specimen which require strong angles (with respect to the orthogonal of the glass plane) to scan were more susceptible to errors. In these situations, it is preferable for the specimen to be removed for scanning.
Despite the ongoing revolution of 3D morphology studies, surface digitizing will always create an imperfect and partial model of the original specimen. Surface digitizing does not usally capture the entirety of the specimen and usually leave gaps, most notably when attempted through glass. Physical access to specimens is mandatory as many types of analysis rely on data not capturable by surface digitizing. These notably include taxonomy, comparative anatomy, phylogenetic analyses (always requiring detailed interpretation of minute bony sutures and structures), detection of pathologies, and feeding ecology, which relies on minute structure and wear patterns on tooth crown enamel (e.g., Massare, 1987; Schubert and Ungar, 2005; Bennion et al., 2023). Some other lines of research require samples which can only be gathered physically from the specimen, such as moulds for tooth microwear analysis (e.g., Purnell et al., 2017; Bestwick et al., 2020) and bone histology and microanatomy (e.g., Houssaye, 2013). Finally, physical access is also crucial to assess the authenticity of specimens; it is well known that many historical specimens (with a single accession number) have been artificially enhanced, sometimes even creating chimera (McGowan, 1990; Massare and Lomax, 2016; Rossi et al., 2024). Therefore, it is vital that the protocol outlined and tested in this study is not used by institutions to restrict physical access to specimens by external individuals. Rather, it offers options to museums and researchers faced with logistical difficulties.
ACKNOWLEDGEMENTS
We thank S. Chapman, Z. Hughes, and R. Hansen (NHMUK) for facilitating RFB and JLW’s visits. We also thank A. Caps for his help with scanning ULiege’s fossil collections. Finally, we thank editor Lucia Smidova, Dr. Verónica Díez-Díaz, and one anonymous reviewer for helping us shape the paper with thoughtful comments and suggestions. RFB was funded by F.R.S.-FNRS FRIA PhD Fellowship (grant number FC 23645) and JAM and VF by F.R.S.-FNRS Project SEASCAPE when this research was conducted.
REFERENCES
Adams, J.W., Olah, A., McCurry, M.R., and Potze, S. 2015. Surface Model and Tomographic Archive of Fossil Primate and Other Mammal Holotype and Paratype Specimens of the Ditsong National Museum of Natural History, Pretoria, South Africa. PLOS ONE 10:e0139800. Public Library of Science.
https://doi.org/10.1371/journal.pone.0139800
Bennion, R.F., MacLaren, J.A., Coombs, E.J., Marx, F.G., Lambert, O., and Fischer, V. 2022. Convergence and constraint in the cranial evolution of mosasaurid reptiles and early cetaceans. Paleobiology, 1-17. https://doi.org/10.1017/pab.2022.27
Bennion, R.F., Maxwell, E.E., Lambert, O., and Fischer, V. 2023. Craniodental ecomorphology of the large Jurassic ichthyosaurian Temnodontosaurus. Journal of Anatomy, joa.13939. https://doi.org/10.1111/joa.13939
Bergeron, P. 2007. Parallel Lasers for Remote Measurements of Morphological Traits. The Journal of Wildlife Management, 71:289-292.
https://doi.org/10.2193/2006-290
Bestwick, J., Unwin, D.M., Butler, R.J. and Purnell, M.A. 2020. Dietary diversity and evolution of the earliest flying vertebrates revealed by dental microwear texture analysis. Nature Communications, 11:1-9. Springer US.
https://doi.org/10.1038/s41467-020-19022-2
Bjarnason, A. and Benson, R. 2020. A 3D geometric morphometric dataset quantifying skeletal variation in birds. M3 Journal 7:1-10.
https://doi.org/10.18563/journal.m3.125
Cunningham, J.A., Rahman, I.A., Lautenschlager, S., Rayfield, E.J. and Donoghue, P.C.J. 2014. A virtual world of paleontology. Trends in Ecology & Evolution, 29:347-357.
https://doi.org/10.1016/j.tree.2014.04.004
Davies, T.G., Rahman, I.A., Lautenschlager, S., Cunningham, J.A., Asher, R.J., Barrett, P.M., Bates, K.T., Bengtson, S., Benson, R.B.J., Boyer, D.M., Braga, J., Bright, J.A., Claessens, L.P.A.M., Cox, P.G., Dong, X.P., Evans, A.R., Falkingham, P.L., Friedman, M., Garwood, R.J., Goswami, A., Hutchinson, J.R., Jeffery, N.S., Johanson, Z., Lebrun, R., Martínez-Pérez, C., Marugán-Lobón, J., O’Higgins, P.M., Metscher, B., Orliac, M., Rowe, T.B., Rücklin, M., Sánchez-Villagra, M.R., Shubin, N.H., Smith, S.Y., Starck, J.M., Stringer, C., Summers, A.P., Sutton, M.D., Walsh, S.A., Weisbecker, V., Witmer, L.M., Wroe, S., Yin, Z., Rayfield, E.J., and Donoghue, P.C.J. 2017. Open data and digital morphology. Proceedings of the Royal Society B: Biological Sciences, 284.
https://doi.org/10.1098/rspb.2017.0194
Díez Díaz, V., Mallison, H., Asbach, P., Schwarz, D., and Blanco, A. 2021. Comparing surface digitization techniques in palaeontology using visual perceptual metrics and distance computations between 3D meshes. Palaeontology, 64:179-202.
https://doi.org/10.1111/pala.12518
Falkingham, P. 2012. Acquisition of high resolution three-dimensional models using free, open-source, photogrammetric software. Palaeontologia Electronica, 15:1-15.
https://doi.org/10.26879/264
Fau, M., Cornette, R., and Houssaye, A. 2016. Photogrammetry for 3D digitizing bones of mounted skeletons: Potential and limits. Comptes Rendus Palevol, 15:968-977.
https://doi.org/10.1016/j.crpv.2016.08.003
Fischer, V., Bennion, R.F., Foffa, D., MacLaren, J.A., McCurry, M.R., Melstrom, K.M., and Bardet, N. 2022. Ecological signal in the size and shape of marine amniote teeth. Proceedings of the Royal Society B: Biological Sciences, 289:20221214.
https://doi.org/10.1098/rspb.2022.1214
Goswami, A., Noirault, E., Coombs, E.J., Clavel, J., Fabre, A.-C., Halliday, T.J.D., Churchill, M., Curtis, A., Watanabe, A., Simmons, N.B., Beatty, B.L., Geisler, J.H., Fox, D.L., and Felice, R.N. 2022. Attenuated evolution of mammals through the Cenozoic. Science, 378:377-383. https://doi.org/10.1126/science.abm7525
Hedrick, B.P., Heberling, J.M., Meineke, E.K., Turner, K.G., Grassa, C.J., Park, D.S., Kennedy, J., Clarke, J.A., Cook, J.A., Blackburn, D.C., Edwards, S.V., and Davis, C.C. 2020. Digitization and the Future of Natural History Collections. BioScience 70:243-251.
https://doi.org/10.1093/biosci/biz163
Houssaye, A. 2013. Bone histology of aquatic reptiles: what does it tell us about secondary adaptation to an aquatic life? Biological Journal of the Linnean Society, 108:3-21.
https://doi.org/10.1111/j.1095-8312.2012.02002.x
Karim, T., Burkhalter, R., Farrell, Ã., Molineux, A., Nelson, G., Utrup, J., and Butts, S. 2016. Digitization workflows for paleontology collections. Palaeontologia Electronica, Coquina Press. https://doi.org/10.26879/566
Kouraiss, K., El Hariri, K., El Albani, A., Azizi, A., Mazurier, A., and Lefebvre, B. 2019. Digitization of Fossils from the Fezouata Biota (Lower Ordovician, Morocco): Evaluating Computed Tomography and Photogrammetry in Collection Enhancement. Geoheritage, 11:1889-1901. https://doi.org/10.1007/s12371-019-00403-z
Lautenschlager, S., Gill, P.G., Luo, Z.-X., Fagan, M.J., and Rayfield, E.J. 2018. The role of miniaturization in the evolution of the mammalian jaw and middle ear. Nature, 561:533-537.
https://doi.org/10.1038/s41586-018-0521-4
MacLaren, J.A., Bennion, R.F., Bardet, N., and Fischer, V. 2022. Global ecomorphological restructuring of dominant marine reptiles prior to the K/Pg mass extinction. Proceedings of Royal Society B, 289:20220585.
https://doi.org/rspb.2022.0585
Mallison, H. and Wings, O. 2014. Photogrammetry in paleontology - a practical guide. Journal of Paleontological Techniques, 12:1-31.
Massare, J.A. 1987. Tooth morphology and prey preference of Mesozoic marine reptiles. Journal of Vertebrate Paleontology, 7:121-137.
Massare, J.A. and Lomax, D.R. 2016. Composite skeletons of Ichthyosaurus in historic collections. Paludicola 10:207-240.
McGowan, C. 1990. Problematic Ichthyosaurs form Southwest England: a question of authenticity. Journal of Vertebrate Paleontology, 10:72-79.
Purnell, M.A., Goodall, R.H., Thomson, S., and Matthews, C.J.D. 2017. Tooth microwear texture in odontocete whales: variation with tooth characteristics and implications for dietary analysis. Biosurface and Biotribology, Elsevier Inc.
https://doi.org/10.1016/j.bsbt.2017.11.004
Rohner, C.A., Richardson, A.J., Marshall, A.D., Weeks, S.J., and Pierce, S.J. 2011. How large is the world’s largest fish? Measuring whale sharks Rhincodon typus with laser photogrammetry. Journal of Fish Biology, 78:378-385.
https://doi.org/10.1111/j.1095-8649.2010.02861.x
Rossi, V., Bernardi, M., Fornasiero, M., Nestola, F., Unitt, R., Castelli, S., and Kustatscher, E. 2024. Forged soft tissues revealed in the oldest fossil reptile from the early Permian of the Alps. Palaeontology, 67:e12690.
https://doi.org/10.1111/pala.12690
Rothman, J.M., Chapman, C.A., Twinomugisha, D., Wasserman, M.D., Lambert, J.E., and Goldberg, T.L. 2008. Measuring physical traits of primates remotely: the use of parallel lasers. American Journal of Primatology, 70:1191-1195.
https://doi.org/10.1002/ajp.20611
Schubert, B.W. and Ungar, P.S. 2005. Wear facets and enamel spalling in tyrannosaurid dinosaurs. Acta Palaeontologica Polonica, 50:93-99.
Shearer, B.M., Cooke, S.B., Halenar, L.B., Reber, S.L., Plummer, J.E., Delson, E., and Tallman, M. 2017. Evaluating causes of error in landmark-based data collection using scanners. PLOS ONE 12:e0187452. Public Library of Science.
https://doi.org/10.1371/journal.pone.0187452
Von Cramon-Taubadel, N., Frazier, B.C., and Lahr, M.M. 2007. The problem of assessing landmark error in geometric morphometrics: Theory, methods, and modifications. American Journal of Physical Anthropology, 134:24-35.
https://doi.org/10.1002/ajpa.20616
Zverkov, N.G. and Jacobs, M.L. 2021. Revision of Nannopterygius (Ichthyosauria: Ophthalmosauridae): reappraisal of the ‘inaccessible’ holotype resolves a taxonomic tangle and reveals an obscure ophthalmosaurid lineage with a wide distribution. Zoological Journal of the Linnean Society, 191:228-275.
https://doi.org/10.1093/zoolinnean/zlaa028
