

 Outline analysis as a new method for investigating development in fossil crabs
Article number: 27.1.a24
https://doi.org/10.26879/1207
Copyright Paleontological Society, April 2024
Author biographies
Plain-language and multi-lingual abstracts
PDF version
Submission: 11 January 2023. Acceptance: 3 April 2024.
ABSTRACT
Geometric morphometrics offer various methods that are often used in the analysis of fossil specimens, due to the specimen’s morphological nature. One of these methods, outline analysis, can be applied to compare the shape of specimens in various contexts. Here, we use outline analysis to investigate the developmental stages of fossil specimens. We use the extant European shore crab to test a pipeline where elliptic Fourier analysis and discriminant function analysis are used to provide an objective interpretation of a specimens’ developmental stage. We then test the pipeline, using a case of a recently redescribed juvenile fossil crab (Liocarcinus oligocenicus). We find, that in data sets without phylogenetic variation, this pipeline works well in identifying developmental stages. However, it is less efficient when data sets increase in noise. Furthermore, Carcinus maenas expresses a clear morphological separation between juveniles and adults.
Florian Braig. Faculty of Biology, LMU Munich, Biocenter, Großhaderner Str. 2, 82152 Planegg-Martinsried, Germany. (Corresponding author) braig@bio.lmu.de
Gabriela Torres. Biologische Anstalt Helgoland, Alfred-Wegener-Institut, Helmholtz-Zentrum Für Polar- Und Meeresforschung, 27498, Helgoland, Germany. Gabriela.Torres@awi.de
Luis Giménez. Biologische Anstalt Helgoland, Alfred-Wegener-Institut, Helmholtz-Zentrum Für Polar- Und Meeresforschung, 27498, Helgoland, Germany and School of Ocean Sciences, Bangor University, Menai Bridge, LL59 5AB, UK. luis.gimenez@awi.de
Joachim T. Haug. Faculty of Biology, LMU Munich, Biocenter, Großhaderner Str. 2, 82152 Planegg-Martinsried, Germany and GeoBio-Center of the LMU Munich, Richard-Wagner-Str. 10, 80333 Munich, Germany. jhaug@biologie.uni-muenchen.de
Key words: Carcinus; Classification; geometric morphometrics; Liocarcinus; Malacostraca; ontogeny
Final citation: Braig, Florian, Torres, Gabriela, Giménez, Luis, and Haug, Joachim T. 2024. Outline analysis as a new method for investigating development in fossil crabs. Palaeontologia Electronica, 27(1):a24.
https://doi.org/10.26879/1207
palaeo-electronica.org/content/2024/5196-outline-ontogeny-analysis
Copyright: April 2024 Paleontological Society.
This is an open access article distributed under the terms of Attribution-NonCommercial-ShareAlike 4.0 International (CC BY-NC-SA 4.0), which permits users to copy and redistribute the material in any medium or format, provided it is not used for commercial purposes and the original author and source are credited, with indications if any changes are made.
creativecommons.org/licenses/by-nc-sa/4.0/
INTRODUCTION
When working with fossil brachyurans, commonly known as true crabs, the shield (or carapace) is frequently the only well-preserved body part (e.g., Glaessner, 1933; Schweitzer et al., 2002). Extracting information about the species or developmental stage from the shield alone can be challenging (Guinot, 2019). Grooves, spines, and length and width ratios of the shield may be used as diagnostic characters (van Bakel et al., 2021). Size is occasionally used to determine the developmental stage (Vega and Feldmann, 1992). Yet, the relationship between developmental stage and size is often non-linear and therefore can be misleading (Gerber, 2011).
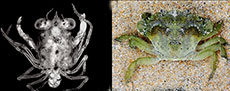
 In extant brachyurans, distinguishing larval phases and individual stages is more straightforward as early larvae differ morphologically from their adult counterparts (Figure 1). The zoea phase (i.e., crab larva using their later maxillipeds for swimming) has long spines on their shield and an often laterally compressed body. The megalopa phase, the transition phase between zoea and adult (in fact juvenile) morphology, already has a dorso-ventrally compressed body, but still uses its pleon appendages for swimming, meaning the pleon is still not tucked underneath the body in the typical crab-like habitus. Its shield is also often anterior-posteriorly elongated. Juveniles, although already generally adult-like, can also still differ morphologically from mature adults. In fossil contexts soft tissues are rarely preserved. It is therefore not surprising that the number of fossil larvae and juveniles described for brachyurans is still small (Luque et al., 2014, 2019; Haug et al., 2015). Consecutively, little is known about the evolutionary changes in development of brachyurans (Haug et al., 2015). A first step to fill this knowledge gap would be the reliable identification of megalopa and juvenile specimens in the fossil record.
One reason for the lack of larval or even juvenile material in the fossil record may be the misidentification of such specimens as presumable adults, differences in the shield shape due to differing developmental stage may be interpreted as diagnostic for a separate species. Employing quantitative approaches, such as outline analysis-based classification, has the potential to provide additional information. Morphometrics have already been shown to reliably distinguish supposedly “cryptic” species (e.g., Dujardin et al., 2014). Auspiciously, developmental stages of the same species can show even larger morphological differences than adults of two different species (e.g., adults of the European and Mediterranean shore crab with their zoeal stages).
As using outline-based linear discriminant function (LDA) for classification has not been tested for crab shield identification yet, we here use the European shore crab Carcinus maenas (Linnaeus, 1758) as first extant controllable example to test whether certain developmental phases can be reliably identified by the shield outline. We chose this species for its typical crab-like body and the knowledge of each specimen’s developmental phase prior to investigation. We then test the method using a fossil relative, Liocarcinus oligocenicus (Paucă, 1929), of which some specimens may be juveniles (Hyžný et al., 2022).
MATERIAL AND METHODS
Material
The material used in this study originated from published literature, museum collections, and a developmental series (see Appendix 1 for list of data origins; Appendix 2 for list of literature references). The developmental series originated from a laboratory rearing of C. maenas at the Alfred-Wegener-Institute (for details, see Spitzner et al., 2019; Torres and Giménez, 2020; Torres et al., 2021). Further images were provided by Oliver Mengedoht/Panzerwelten.de, Recklinghausen. We reconstructed the outline of the shield in dorsal view, as it is the most accessible and repeatable view, due to least amount of inclined surface area. We disregarded zoea stages, as their shields and body orientation among preservation are significantly different from later developmental stages, making it easy to separate them from later stages already on first sight (e.g., Spitzner et al., 2018). However, we kept megalopae due to their larger degree of similarity with the adults and to polarize the data set compared to the juveniles and adults. We grouped the data into three developmental categories: megalopae, early juveniles, and adults. We decided to use early juveniles as a category, based on earlier observations from quantitative comparisons (Braig, personal comm., 2022), and descriptions from literature. According to these descriptions individuals still undergo changes to their morphology, after the last metamorphic moult (megalopa to crab 1), when they develop from early juveniles into adults (Martin et al., 1984). Hence, megalopa and early juveniles still exhibit quite a different morphology from the adult, and are, in addition, often available as depictions in the literature.
The Carcinus maenas data set contained 57 extant specimens (19 megalopae, 13 juveniles, 25 adults) from different extant populations. The Liocarcinus data set contained 39 specimens (2 megalopae, 9 juveniles, 28 adults) from different extant and extinct populations. Recently, a specimen of Nautilograpsus prior (Smirnov, 1929) has been reinterpreted as a juvenile of L. oligocenicus (Hyžný et al., 2022). Using this case as an example, we tested four eligible specimens of L. oligocenicus from the original study, including the presumed juvenile in question, against the Liocarcinus data set, to see which category of developmental phase these specimens would be assigned to. Due to a general lack of material in the literature, we included different species belonging to the Liocarcinus species group to depict a wider range of developmental phases in our data. Hence, this data set contained both extant and fossil material. A detailed list of species and developmental phases is given in Appendix 1.
Generation of Data
For the documentation of larvae and juveniles obtained through laboratory rearing, a Keyence BZ-9000 inverse epifluorescence microscope was used with DAPI (360 nm excitation wavelength) and GFP (470 nm excitation wavelength) filters with a lens magnification of 2x, 4x, and 10x (resulting in 20x, 40x, and 100x magnification). The auto-fluorescence properties of the specimens make this imaging technique possible (e.g., Haug et al., 2011).
Specimens from collections were documented with a macro-photography setup. We used a Canon Rebel T3i digital camera with a MP-E 65 mm macro lens and distance rings. We used a Yongnuo YN24EX twin-flash equipped with polarization filters and a cross-polarized filter in front of the camera lens, to reduce light-reflection induced artefacts (for a detailed description see Eiler et al., 2016; Braig et al., 2023a).
Multiple images in different focus layers were recorded, so called focus stacks. To create one sharp image from the focus-stacks, we used the free software CombineZP (Alan Hadley, GNU). It combines the in-focus regions of each image into one sharp image.
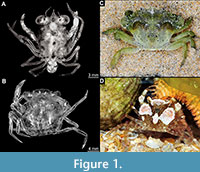
 For the reconstruction of shield outlines (in dorsal view), the vector graphic software Adobe Illustrator CS2 and the free and open software InkScape were used. Here, the shield can be retraced with a vector line to create the outline (Figure 2). To eliminate the influence of left-right asymmetry on the data set, we only reconstructed the left or the right half of the shield and then duplicated and mirrored it in anterior-posterior axis and stitched it together to form an entire symmetric shield (Haug et al., 2020; Braig et al., 2021). Biological asymmetry, such as fluctuating asymmetry, has been found in Carcinidae (Spani and Scalici, 2018), but due to its random nature we disregarded it to reduce noise in the data for this analysis.
Statistical Analysis
To convert the graphical representation of the shield into a mathematical representation, elliptical Fourier analysis (EFA) was applied using the free and open Momocs package (ver. 1.3.2; Bonhomme et al., 2014) in the R-statistics environment (ver. 4.1.0; R Core Team, 2021). The linear discriminant function analysis was conducted in the R-statistics environment as well, using packages caret (ver. 6.0-88; Kuhn, 2021) and MASS (ver. 7.3-54; Venables and Ripley, 2002). The code used is provided in Appendix 3.
In short, the EFA uses the principle of the Fourier transformation to decompose a complex two-dimensional shape to quantify the geometrical information within, allowing for analysis using multivariate tools (Bonhomme et al., 2014; Figure 2). The shape is hereby decomposed into a harmonic sum of trigonometric functions, weighted with harmonic coefficients describing the shape (Kuhl and Giardina, 1982; Bonhomme et al., 2014). The shapes are registered (1493 +/- 259 coordinates for the Carcinus data set; 3053 +/- 1736 coordinates for the Liocarcinus data set), centred, and scaled, therefore controlling for the influence of size difference (e.g., due to scale difference) on the analysis. We then used functions of the Momocs package (e.g., calibrate_harmonics) to identify the number of harmonics that would best represent the variation in our data set. The harmonic coefficients are then aligned according to a homologous starting point, in our case the tip of the rostrum or median point of the anterior of the shield. Finally, the harmonic coefficients are analysed with a principal component analysis (PCA; Bonhomme et al., 2014). Of the resulting principal components (PCs), we chose to retain the first PCs that would accumulate to more than 95% of variation in the data set as input data for the following classification analysis. We chose a 95% cut-off for cumulated variation, mainly following Joliffe (2002; the scree-test being subjective, and assumptions of distribution required for a computational approach not met with our data).
To test whether the different shapes could be reliably classified, we used the discriminant function analysis (DFA; Fisher, 1936). It determines a linear combination of the input variables that maximises the separation of groups, based on a given factor (Venables and Ripley, 2002; Kampichler et al., 2010).
For the first analysis, we used all available specimens of Carcinus maenas to establish a baseline for the efficacy of the method. We split the data set into a training and a testing data set (80% and 20% of data, respectively), and repeated the analysis 1000 times, with random generated splits of the data each time (Evin et al., 2013). The principal components, resulting from the EFA, were used as response variables with the developmental phase as predicting factor. After each classification step we compared the predicted developmental phase to the actual developmental phase of the test data specimens. We repeated this process a second time, but with randomly assigning the ontogenetic grouping factor to each individual before splitting the data (Evin et al., 2013). Thereby testing whether a random assignment of groups had a different chance of correct classification (after Evin et al., 2013).
We then repeated these tests for the Liocarcinus data, which consisted of all available specimens belonging to Liocarcinus, including fossils and different developmental phases. Additionally, we used all representatives of L. oligocenicus as testing data and the rest of the data set as training data, to obtain the predicted classes of these specimens.
RESULTS
Carcinus maenas: Test of Pipeline Efficiency
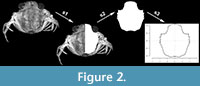
After calibrating and testing for deviations, we chose nine harmonics to describe the shield shape. Of the resulting PCA, the first three PCs described more than 95% of variation. These were used for the follow-up analysis. The first two are used to visually represent the morphospace (for graphical component loadings see Appendix 4). The first principal component described 89.6% of variation in the data set. It most prominently demonstrates the variation between long and wide shields. More positive values described wide shields, extending antero-laterally, while negative values described slim shields with a prominent rostrum. The second principal component described 4.4% of variation in the data set. Positive values described pentagonal shields with rounded rostra and eye notches, while negative values described almond-shaped shields with pointed rostra.
 The morphospace, resulting from the first two principal components plotted against each other, shows a clear separation of the three ontogenetic groups (Figure 3). The megalopae plotted on the left side of the morphospace in a small cluster, representing their slim shields with rostra (Figure 3). Adults plotted on the right side of the morphospace, representing their wide shields (Figure 3). The (early) juveniles plotted in the centre of the morphospace representing their rounder shields with small rostra and little lateral widening.
The discriminant function analysis classified the test data accurately in 100% percent of cases in 1000 test runs. As a baseline, when the categorical variables were randomly assigned to the data, the classification only was correct in 38% percent of cases on average.
Liocarcinus Fossils: Test of Method
We used 11 harmonics to describe the shield shape; the first seven components of the PCA explained more than 95% of the total variation. The first two components were used to visually represent the morphospace (graphical component loadings in Appendix 4). The first principal component (63.5%) described the variation between long and wide shields. More positive values described wide shields, extending antero-laterally, while negative values described longer shields with an extended rostrum. The second principal component (12.8%) described more subtle morphological changes: positive values described star shaped shields with a broad rostrum and convex posterior end, while negative values described shields with wide anteriors and slim posteriors.
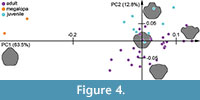 The morphospace, resulting from the first two principal components, showed a clear separation of the two extant megalopae from juveniles and adults. The adults and juveniles, both containing fossil representatives, were less well separated (Figure 4). The two megalopae plotted on the left side of the morphospace, representing their slim shields with rostra (Figure 4). Adults plotted on the right side of the morphospace, representing their wide shields with pronounced antero-lateral areas (Figure 4). The juveniles plotted above the group of adults, slightly overlapping with them, representing their comparatively more pronounced rostra.
The discriminant function analysis classified the test data accurately in 83.7% percent of cases in 1000 test runs. As a baseline, when the categorical variables were randomly assigned to the data, the classification only was correct in 69.6% percent of cases on average.
Considering the case of the representatives of L. oligocenicus (Hyžný et al., 2022), three of the four included specimens were originally identified as adults, one as juvenile. The discriminant function analysis identified one adult as juvenile and the suggested juvenile as adult.
DISCUSSION
Limitations of the Approach
Identifying juveniles as distinct from adults is problematic for the study of crab morphology and for our analysis in particular. For the C. maenas analysis, we used early juveniles obtained by rearing larvae in the laboratory. The use of specimens of known developmental stage was a critical point in the first step of our procedure, consisting of the test of the pipeline efficiency. For the second step, where the Liocarcinus data set is used, the exact stage is not known; instead, the categorization of fossils as juveniles was based on information from literature and experts identifying collection material.
A current challenge is represented by the limited data available, in the form of high-quality photographs. Although there is now a larger number of data bases providing all types of specimen data, the number of actual images usable for such analyses is still small. This becomes problematic, when a crab species is paedomorphic or shows increased variability in its allometric growth patterns. Differences between different developmental phases can become minute or so variable that they are difficult to be detected. In these cases, large sample sizes with few closely related species (i.e., little phylogenetic variation) are needed. Consecutively, to gain more knowledge about morphological variation in the fossil record, an increase of the quality and number of the published images, that can then be used for quantitative analyses, is needed.
In this line of thought, outline analysis, as it is performed here, can only be applied if the sample size is large enough. The strength of this method comes from the aspect of comparison, for which other specimens are needed. Often, fossil crab species are described by one specimen only. For these cases other approaches need to be found.
Outlines as Ontogenetic Markers
The analysis of the C. maenas data set shows a clear separation between developmental phases. The difference between the slim shields of the megalopae (with their rostra) and the wide shields of the adults makes up for most variation within the data. The early juvenile phase takes an intermediate position in the morphospace, forming a developmental trajectory (Figure 3). The clear visual identification of developmental clusters is supported by the LDA, which had a classification probability of 100%, far above the random baseline of 38%.
On the contrary, the analysis of the Liocarcinus data set resulted in a less clear separation of the data based on developmental phases. Megalopae were still visibly separated, but the separation between juveniles and adults was less clear. Consecutively, the linear discriminant function analysis had a smaller accuracy for identifying the data, although it still performed better than the established random baseline (83.7% over 69.6%).
In summary, the pipeline presented and tested here can distinguish developmental phases, given that the investigated data set includes little noise (i.e., little phylogenetic variation, small polymorphism), and a reasonable amount of data. It offers an objective way of identifying developmental phases. However, when the sample size is reduced or noise is introduced, here in the form of including multiple species, the pipeline does not produce accurate identification.
The Morphology of Post-larval Development
Juvenile crabs forming a discrete cluster in the morphospace of the C. maenas data set is an interesting find, as we did include adult specimens of multiple ages and sizes in the analysis. The discrete difference from older adults is probably best explained by the fact that juvenile stages must still undergo changes in morphology, while adults mostly grow in size. It is therefore not surprising to see that the juvenile stages plot closer to the megalopae as they are only separated by one to two stages. However, brachyurans are generally interpreted to have their last metamorphic moult from megalopa to crab 1. The morphologically discrete cluster of juvenile crabs therefore provides a base to discuss whether this interpretation holds true in a morphological sense. Especially, since young crabs have been included in the analysis, which could potentially fill the gap between juveniles and adults in the morphospace.
We did not find a clear separation in the Liocarcinus data set. When investigating the case of the juvenile L. oligocenicus specimen, our analysis did not identify this individual as juvenile, and could therefore not support the new interpretation of this specimen. As discussed above, the reasons may be either that the Liocarcinus data set included too many species and too little specimens to provide a detailed comparison, or morphological variation may have been less pronounced in the post-larval development of fossil crabs. As we included extant juveniles in the Licoarcinus data set, these may differ from fossil juveniles. Alternatively, the specimen may indeed be an adult of a separate species, Nautilograpsus prior, as originally proposed (Smirnov, 1929).
CONCLUSION AND OUTLOOK
We showed that outline analysis combined with linear discriminant function analysis can reliably identify ontogenetic phases, but only in cases with little phylogenetic variation and sufficient sample sizes. Furthermore, early juveniles in C. maenas form a discrete cluster in the morphospace, separated from more advanced stages. The proposition that the specimen of Liocarcinus oligocenicus is a juvenile was not supported by our method. We now need to test this pipeline on different species of different groups to determine a baseline for its usefulness compared to established methods.
ACKNOWLEDGEMENTS
We would like to thank multiple anonymous reviewers and the editor for their comments, time and effort, which resulted in a greatly improved manuscript. We would like to thank M. Hyžný (Comenius University, Bratislava) for providing images of fossil specimens. We would like to thank O. Mengedoht/Panzerwelten.de, Recklinghausen, for providing images. We thank all providers of free software and Open-Access tools. We would like to thank Prof. J.M. Starck (LMU) for long-standing support. JTH was funded by the German Research Foundation under DFG Ha 6300/3-3 and by the Volkswagen Foundation in the frame of a Lichtenberg professorship.
REFERENCES
Bonhomme, V., Picq, S., Gaucherel, C., and Claude, J. 2014. Momocs: Outline Analysis Using R. Journal of Statistical Software, 56(13):1–24.
http://www.jstatsoft.org/v56/i13/
Braig, F., Posada-Zuluaga, V., Haug, C., and Haug, J.T. 2021. Diversity of hippoidean crabs – considering ontogeny, quantifiable morphology and phenotypic plasticity. Nauplius, 29:e2021027.
https://doi.org/10.1590/2358-2936e2021027
Braig, F., Haug, C., and Haug, J.T. 2023a. Phenotypic variability in the shield morphology of wild- vs. lab-reared eumalacostracan larvae. Nauplius, 31:e2023004.
https://doi.org/10.1590/2358-2936e2023004
Braig, F., Haug, C., and Haug, J.T. 2023b. Diversification events of the shield morphology in shore crabs and their relatives through development and time. Palaeontologia Electronica, 26(3):a53.
https://doi.org/10.26879/1305
Dujardin, J.P., Kaba, D., Solano, P., Dupraz, M., McCoy, K.D., and Jaramillo-O, N. 2014. Outline-based morphometrics, an overlooked method in arthropod studies? Infection, Genetics and Evolution, 28:704–714.
https://doi.org/10.1016/j.meegid.2014.07.035
Eiler, S.M., Haug, C., and Haug, J.T. 2016. Detailed description of a giant polychelidan eryoneicus-type larva with modern imaging techniques (Eucrustacea, Decapoda, Polychelida). Spixiana, 39:39–60.
Evin, A., Cucchi, T., Cardini, A., Vidarsdottir, U.S., Larson, G., and Dobney, K. 2013. The long and winding road: identifying pig domestication through molar size and shape. Journal of Archaeological Science, 40(1):735–743.
https://doi.org/10.1016/j.jas.2012.08.005
Fisher, R.A. 1936. The use of multiple measurements in taxonomic problems. Annals of Eugenics 7:179–188.
https://doi.org/10.1111/j.1469-1809.1936.tb02137.x
Gerber, S. 2011. Comparing the differential filling of morphospace and allometric space through time: the morphological and developmental dynamics of Early Jurassic ammonoids. Palaeobiology, 37(3):369–382.
https://doi.org/10.1666/10005.1
Glaessner, M.F. 1933. I.–New tertiary crabs in the collection of the British Museum. Annals and Magazine of Natural History, 12(67):1–28.
https://doi.org/10.1080/00222933308673747
Guinot, D. 2019. New hypotheses concerning the earliest brachyurans (Crustacea, Decapoda, Brachyura). Geodiversitas, 41(1):747–796.
https://doi.org/10.5252/geodiversitas2019v41a22
Haug, J.T., Haug, C., Kutschera, V., Mayer, G., Maas, A., Liebau, S., Castellani, C., Wolfram, U., Clarkson, E.N.K., and Waloszek, D. 2011. Autofluorescence imaging, an excellent tool for comparative morphology. Journal of Microscopy, 244:259–272.
https://doi.org/10.1111/j.1365-2818.2011.03534.x
Haug, J.T., Martin, J.W., and Haug, C. 2015. A 150-million-year-old crab larva and its implications for the early rise of brachyuran crabs. Nature Communications, 6(1):6417.
https://doi.org/10.1038/ncomms7417
Haug, G.T., Haug, C., Pazinato, P.G., Braig, F., Perrichot, V., Gröhn, C., Müller, P., and Haug, J.T. 2020. The decline of silky lacewings and morphological diversity of long-nosed antlion larvae through time. Palaeontologia Electronica, 23(2):a39.
https://doi.org/10.26879/1029
Hyžný, M., Kovalchuk, O., Świdnicka, E., Barkaszi, Z., Berezovsky, A., Dumitriu, S., Grădianu, I., and Stefaniak, K. 2022. Revisiting brachyuran crabs (Malacostraca: Decapoda) from Oligocene and Miocene fish beds of Europe. Geologica Carpathica, 73(6):579–597.
https://doi.org/10.31577/GeolCarp.73.6.3
Joliffe, I.T. 2002. Choosing a Subset of Principal Components or Variables, p. 111–149. In Joliffe, I.T. (ed.), Principal Component Analysis. Springer Series in Statistics. Springer, New York, NY.
https://doi.org/10.1007/0-387-22440-8_6
Kampichler, C., Wieland, R., Calmé, S., Weissenberger, H., and Arriaga-Weiss, S. 2010. Classification in conservation biology: a comparison of five machine-learning methods. Ecological Informatics, 5(6):441–450.
https://doi.org/10.1016/j.ecoinf.2010.06.003
Kuhl, F.P. and Giardina, C.R. 1982. Elliptic Fourier features of a closed contour. Computer Graphics and Image Processsing, 18:236–258.
https://doi.org/10.1016/0146-664X(82)90034-X
Kuhn, M. 2021. caret: Classification and Regression Training. R package version 6.0-88.
https://CRAN.R-project.org/package=caret
Linnaeus, C. 1758. Systema Naturae per regna tria naturae, secundum classes, ordines, genera, species, cum characteribus, differentiis, synonymis, locis, 10th revised edition. Laurentius Salvius: Holmiae.
https://doi.org/10.5962/bhl.title.542
Luque, J. 2014. A puzzling frog crab (Crustacea: Decapoda: Brachyura) from the Early Cretaceous Santana Group of Brazil: Frog first or crab first? Journal of Systematic Palaeontology, 13:153–166.
https://doi.org/10.1080/14772019.2013.871586
Luque, J., Feldmann, R.M., Vernygora, O., Schweitzer, C.E., Cameron, C.B., Kerr, K.A., Vega, F.J., Duque, A., Strange, M., Palmer, A.R., and Jaramillo, C. 2019. Exceptional preservation of mid-Cretaceous marine arthropods and the evolution of novel forms via heterochrony. Science Advances, 5(4):eaav3875.
https://doi.org/10.1126/sciadv.aav3875
Martin, J.W., Felder, D.L., and Truesdale, F. M. 1984. A comparative study of morphology and ontogeny in juvenile stages of four western Atlantic xanthoid crabs (Crustacea: Decapoda: Brachyura). Philosophical Transactions of the Royal Society of London B, 303(1117):537–604.
https://www.jstor.org/stable/2396127
Paucă, M. 1929. Zwei neue fossile Decapoden aus den Oligozänen Clupea crenata Schiefern von Suslăneşti-Muscel und über die Bildung der Menilitschiefer. Bulletin de la Section Scientifique Académie Roumaine, 12:126–131.
R Core Team 2021. R: A language and environment for statistical computing. R Foundation for Statistical Computing, Vienna, Austria. URL
https://www.R-project.org/
Schweitzer, C.E., Feldmann, R.M., Gonzáles-Barba, G., and Vega, F.J. 2002. New crabs from the Eocene and Oligocene of Baja California Sur, Mexico and an assessment of the evolutionary and paleobiogeographic implications of Mexican fossil decapods. Journal of Paleontology, 76(59):1–43.
Smirnov, W. 1929. Decapoda der Fischschichten am Schwarzen Flusse von der Stadt Wladikawkas. Arbeiten der Nordkaukasischen Assoziation Wissenschaftlicher Institute, 59:1–48. (In Russian with German summary)
Spani, F. and Scalici, M. 2018. Carapace asymmetries in crabs. Crustaceana, 91(11):1281–1290.
https://doi.org/10.1163/15685403-00003835
Spitzner, F., Meth, R., Krüger, C., Nischik, E., Eiler, S., Sombke, A., Torres, G., and Harzsch, S. 2018. An atlas of larval organogenesis in the European shore crab Carcinus maenas L. (Decapoda, Brachyura, Portunidae). Frontiers in Zoology, 15:27.
https://doi.org/10.1186/s12983-018-0271-z
Spitzner, F., Giménez, L., Meth, R., Harzsch, S., and Torres, G. 2019. Unmasking intraspecific variation in offspring responses to multiple environmental drivers. Marine Biology, 166:112.
https://doi.org/10.1007/s00227-019-3560-y
Torres, G. and Giménez, L. 2020. Temperature modulates compensatory responses to food limitation at metamorphosis in a marine invertebrate. Functional Ecology, 34(8):1564–1576.
https://doi.org/10.1111/1365-2435.13607
Torres, G., Melzer, R.R., Spitzner, F., Šargač, Z., Harzsch, S., and Gimenez, L. 2021. Methods to study organogenesis in decapod crustacean larvae. I. larval rearing, preparation, and fixation. Helgoland Marine Research, 75:3.
https://doi.org/10.1186/s10152-021-00548-x
van Bakel, B.W., Fraaije, R.H., Jagt, J.W., and Skupien, P. 2021. Origin, early evolution and palaeoecology of Gymnopleura (Crustacea, Decapoda): Basal palaeocorystoid crabs from the Upper Jurassic-Lower Cretaceous of central Europe. Palaeogeography, Palaeoclimatology, Palaeoecology, 564:110176.
https://doi.org/10.1016/j.palaeo.2020.110176
Vega, F.J. and Feldmann, R.M. 1992. Occurrence of Costacopluma (Decapoda: Brachyura: Retroplumidae) in the Maastrichtian of southern Mexico and its paleobiogeographic implications. Annals of Carnegie Museum, 61:133–152.
Venables, W.N. and Ripley, B.D. 2002. Modern Applied Statistics with S, Fourth Edition. Springer, New York.
