

 Geometric morphometrics as a tool to support taxonomic identification in palaeontology: A comparison with traditional morphometrics in the study of isolated fossil shark teeth
Article number: 28.2.a33
https://doi.org/10.26879/1567
Copyright Society of Vertebrate Paleontology, July 2025
Author biographies
Plain-language and multi-lingual abstracts
PDF version
Submission: 16 April 2025. Acceptance: 14 July 2025.
ABSTRACT
Isolated teeth of elasmobranch fishes are extremely abundant in the fossil record. However, taxonomic identification solely based on qualitative characters might lead to erroneous results because several taxa might exhibit similar morphologies, making it difficult to detect significant morphological differences. As a valid support for qualitative taxonomic identification, an increasing number of studies have proposed supplementing qualitative features with quantitative approaches, including both traditional and geometric morphometrics. These methods are particularly effective in detecting minimal morphological differences that are often overlooked by purely qualitative analyses. To evaluate whether traditional and geometric morphometric approaches can reliably support the qualitative taxonomic identifications, using geometric morphometrics we examined a sample of isolated teeth of living and fossil lamniform sharks that had been previously investigated using traditional morphometric approaches. The goal of the present study is to understand whether geometric morphometrics and traditional morphometrics, when applied on the same dataset of isolated shark teeth, are equally reliable in supporting a priori qualitative taxonomic identifications and, if so, which approach is more effective. Our results show that geometric morphometrics recovers the same taxonomic separation identified by traditional morphometrics while also capturing additional shape variables that traditional methods did not consider. Consequently, geometric morphometrics provides a larger amount of information about tooth morphology, representing a powerful tool for supporting taxonomic identification of isolated fossil shark teeth.
Edoardo Pagliuzzi. Dipartimento di Scienze della Terra, Università degli Studi di Torino, Via Valperga Caluso 35, 10125 Torino, Italy (corresponding author). edoardo.pagliuzzi@edu.unito.it
Giorgio Carnevale. Dipartimento di Scienze della Terra, Università degli Studi di Torino, Via Valperga Caluso 35, 10125 Torino, Italy. giorgio.carnevale@unito.it
Jürgen Kriwet. Department of Palaeontology, University of Vienna, Josef-Holaubek-Platz 2, 1090 Vienna, Austria. juergen.kriwet@univie.ac.at
Giuseppe Marramà. Dipartimento di Scienze della Terra, Università degli Studi di Torino, Via Valperga Caluso 35, 10125 Torino, Italy. giuseppe.marrama@unito.it
Keywords: lamniform sharks; fossil teeth; geometric morphometrics; traditional morphometrics; taxonomy
Final citation: Pagliuzzi, Edoardo, Carnevale, Giorgio, Kriwet, Jürgen, and Marramà, Giuseppe. 2025. Geometric morphometrics as a tool to support taxonomic identification in palaeontology: A comparison with traditional morphometrics in the study of isolated fossil shark teeth. Palaeontologia Electronica, 28(2):a33.
https://doi.org/10.26879/1567
palaeo-electronica.org/content/2025/5603-geometric-morphometrics-on-fossil-shark-teeth
Copyright: July 2025 Society of Vertebrate Paleontology.
This is an open access article distributed under the terms of the Creative Commons Attribution License, which permits unrestricted use, distribution, and reproduction in any medium, provided the original author and source are credited.
creativecommons.org/licenses/by/4.0
INTRODUCTION
Sharks (Selachii) are a successful group of marine vertebrates, with at least 500 living species worldwide distributed from the coastal shallow to cooler deep waters (Dulvy et al., 2014). They are characterized by a high dental morphological diversity that reflects their ability to adapt to different habitats and ecological niches (Pimiento et al., 2019). The evolutionary success of the sharks is also reflected by their very long evolutionary history and rich fossil record, which includes more than 3000 extinct species (Cappetta, 2012; Paillard et al., 2021), demonstrating that these organisms were able to survive several mass extinctions and overcome the competition with other marine predators.
Like other chondrichthyan fishes (e.g., chimaeras and rays) modern sharks show a very conservative body plan and a cartilaginous internal skeleton that rarely fossilizes. Complete and articulated skeletal remains of cartilaginous fishes are very rare and only a few exceptional fossiliferous Konservat-Lagerstätten yielded well-preserved fossils (Brito and Dutheil, 2004; Carvalho et al., 2004; Hovestadt et al., 2010; Marramà et al., 2017, 2023). Most of the fossil record is instead represented by isolated teeth only, which are found worldwide in marine, brackish, and freshwater sediments. These isolated teeth are often among the most common fossils available, due to a higher fossilization potential because of their structure and composition. This huge availability in the record is also explained by the fact that each shark has multiple teeth arranged in several rows and these teeth are lost and replaced many times in the biological life cycle (Budker and Whitehead, 1971).
The abundance of isolated fossil shark teeth in the palaeontological record has led in recent years to an increasing number of identified taxa (e.g., Cappetta, 2012), but the systematics, overall morphology, body size, and palaeoecology of extinct sharks are often difficult to interpret without complete and articulate skeletons. Qualitative taxonomic identification is widely used but it often leads to several discussions about the validity of the results, because of the common occurrence of teeth exhibiting remarkable morphological similarities due, for example, to evolutionary convergence (Cappetta, 1987, 2012). As valid support to taxonomic identification, some techniques based on quantitative approaches such as geometric morphometrics and traditional morphometrics are getting more and more commonly used, since they can detect even minimal morphological differences that are often difficult to observe. Some recent studies have used geometric morphometrics to validate the qualitative taxonomic identification of different genera of extinct sharks using isolated fossil teeth (e.g., Nyberg et al., 2006; Whitenack and Gottfried, 2010), while the use of traditional morphometrics has been more neglected, although Marramà and Kriwet (2017) demonstrated that it can represent a valid support for a priori qualitative identification.
This paper aims to determine whether geometric and traditional morphometrics are equally reliable for taxonomic identification when applied to the same sample. For this purpose, we consider the same sample analyzed by Marramà and Kriwet (2017), who used the traditional morphometric approach to support the taxonomic identification of 172 isolated lamniform shark teeth belonging to four different fossil and extant genera (Brachycarcharias, Carcharias, Carcharomodus, and Lamna). In this study we use, instead, geometric morphometrics on the same sample in order to: 1) validate the qualitative taxonomic separation at genus level made a priori; 2) compare the results of the two different approaches to detect whether geometric morphometrics and traditional morphometrics, when applied on the same specimens, are equally reliable in supporting the qualitative taxonomic identification in the same way or not; and 3) recognize which one of the two approaches is more effective in detecting even minimal differences and most of the morphological variation.
MATERIALS AND METHODS
Taxon Sampling
This study is based on the same sample used in the traditional morphometric analysis made by Marramà and Kriwet (2017), who analyzed a total of 172 isolated lamniform shark teeth, both fossil and extant, belonging to four different genera (Brachycarcharias, Carcharias, Carcharomodus, and Lamna). The choice of using different but morphologically similar genera of lamniform sharks allows to better test the capability of geometric and traditional morphometrics to detect minimal differences in shape that can be difficult to recognize only through the observation of qualitative features. Because geometric morphometrics requires consistent landmarks, incomplete specimens from the original sample used in Marramà and Kriwet (2017) were here excluded, as missing data would prevent reliable statistical comparisons (see e.g., Adams et al., 2004). Among the possible solutions for dealing with partially preserved specimens (see e.g., Gunz et al., 2005; Mitteroecker and Gunz, 2009) we chose to select a subset of the main sample that includes only the most complete specimens.
The 120 specimens used here include 40 isolated teeth from fossil species and 80 from extant species. The 40 fossil specimens come from five extinct species (Brachycarcharias lerichei, Carcharias acutissima, C. cuspidata, C. gustrowensis, and Carcharomodus escheri; 18, 5, 8, 1, and 8 specimens, respectively), whereas the remaining 80 specimens are from complete tooth series of two extant species: the porbeagle shark Lamna nasus and the sand tiger shark Carcharias taurus (55 and 25 specimens, respectively). Further details on provenance and age are included in Appendix 1. All the fossil teeth in the sample considered herein have been previously classified a priori using qualitative characters (Cappetta and Nolf, 2005; Cappetta, 2012; Kriwet et al., 2015; Marramà et al., 2018, 2019).
The teeth of extant taxa belong to three complete tooth series of juvenile and adult sharks. All the 25 teeth of Carcharias taurus are from a single juvenile individual, whereas the 55 teeth of Lamna nasus are from an adult (26 specimens) and a juvenile (29 specimens) individual. These two living species are used as control taxa for a better comparison between the four genera.
Since the main goal is to compare our results with those of Marramà and Kriwet (2017) the analyses were necessarily performed at the genus level, following the methods and reasons already mentioned by the authors. For the same reason, the materials from Carcharias taurus, C. acutissima, C. cuspidate, and C. gustrowensis are grouped together, thus increasing the overall sample referable to this genus.
Geometric Morphometrics Protocols
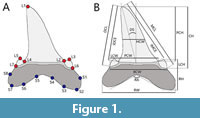 Geometric morphometrics is a powerful tool for the study of the morphological variation between biological forms thanks to a landmark-based approach that allows us to represent the overall body shape of an object (e.g., teeth, in this case) (Rohlf and Marcus, 1993; Zelditch et al., 2004). A total of seven homologous landmarks and eight semilandmarks were digitized using the software package TPSdig 2.32 (Rohlf, 2005) on each specimen following the scheme in Figure 1A. As illustrated in Figure 1A, all the landmarks were placed in homologous positions to cover adequately the overall shape. The eight equidistant semilandmarks were placed along the curved profile of the ventral margin of the tooth root where no homologous points can be detected. Landmarks and semilandmarks were digitized on the lingual or labial side of the tooth (since they are the only accessible sides for the fossil specimens still embedded in the sediment). Despite we analyzed a smaller subset of specimens than to the original sample of Marramà and Kriwet (2017), the use of landmarks and semilandmarks allows to obtain a larger amount of information than that provided from the traditional morphometric approach using biometric characters (i.e., measurements; see Figure 1B) (Zelditch et al., 2004).
To achieve a more reliable analysis and a better interpretation of the position of landmarks and semilandmarks by the software, all the images representing the 120 specimens considered were oriented (flipped) in the same way. Each tooth was so disposed with its basal portion facing downwards and its apical portion facing upwards, with the mesial side on the right and the distal side on the left (Figure 1A).
All the landmarks and semilandmarks coordinates were scaled, translated, and rotated using a Generalized Procrustes Analysis (GPA) to minimize the differences in size, position, and orientation in the various landmark configurations of the 120 specimens (Zelditch et al., 2004). Sliding was also done on the semilandmarks to adjust their positions on curved surfaces and to reduce non-shape variation. The GPA was performed through the software package TPSrelw 1.75 (Rohlf, 2003).
The new coordinates obtained from the GPA, called Procrustes coordinates, were analyzed through a Principal Component Analysis (PCA) using TPSrelw 1.75 (Rohlf, 2003). The configurations of these new coordinates are displayed in a two-dimensional graph called morphospace, which allows the visualization of the spatial distribution and separation of the 120 specimens in relation to their different shapes (Janžekovič and Novak, 2012). The morphospace is defined by the 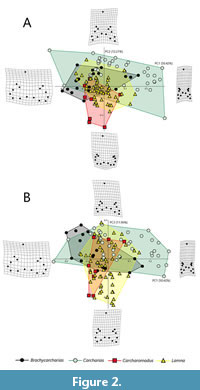 Principal Component (PCs) or Relative Warp (RWs) axes, arranged orthogonally to each other, which are vectors describing the maximum variation of specimen shape compared to the consensus configuration (mean shape) (Hotelling, 1933; James and McCulloch, 1990; Legendre and Legendre, 1998; Harper, 1999; Robertson et al., 2001; Gotelli and Ellison, 2004; Hammer and Harper, 2006; Janžekovič and Novak, 2012). Generally, more PC (or RW) axes are identified, but only those explaining more than 5% of the total variance are considered (Zelditch et al., 2004; Janžekovič and Novak, 2012). To obtain a clear visualization of the overall sample in the morphospace, the 120 specimens are grouped together according to their genus, with the identification of four different groups (one for each genus) defined by a convex hull, the smallest convex polygon that contains all the specimens belonging to the same genera (Cornwell et al., 2006). Changes in shapes along the PC axes are visualized through deformation grid plots (see Figure 2A-B, Figure 3, Figure 4, Figure 5) which are useful to understand which are the morphological traits that change the most and to identify the variables associated to each axis (see Table 1).
Fifteen measurements of the tooth morphology and related terminology used in Marramà and Kriwet (2017) are considered here (Figure 1B): basal crown width (BCW), crown height (CH), distal crown edge length (DCL), degree of slant (DS), half-crown width (HCW), inner distal crown edge length (IDCE), inner mesial crown edge length (IMCE), height of lateral cusplets (LCH), width of lateral cusplets (LCW), mesial crown edge length (MCL), height of principal cusp (PCH), width of principal cusp (PCW), angle between root lobes (RA), root height (RH), and root width (RW). Although geometric morphometrics cannot directly link the morphological variable(s) associated to each axis (contrary to the PCA’s loading values (LV), that describe how much each variable contributes to a particular principal component), we used these measurements to more easily define the morphological traits associated to the PC axes of the geometric morphometrics. Due to the transformation of multiple variables into a set of orthogonal axes made by PCA (Hotelling, 1933), more variables are usually associated simultaneously to the same axis (see Table 1). The PCA’s loading values are very useful to identify to which degree each variable is associated to each PC axis. A common rule of thumb is to consider variables with |loading| > 0.5 as significant contributors to the PCs (e.g., Jolliffe, 2002; Abdi and Williams, 2010). In order to detect which one of the two approaches (traditional and geometric morphometrics) is the most effective to detect distinctiveness between groups, we compared the PCA’s loading values that most contributes to shape variation in the traditional morphometrics with the Sum of Squares values (SS) from the geometric morphometric approach, i.e., the sum of squared deviations of a landmark’s coordinates from the mean shape along each relative warp axis. Similarly to the loading values, the Sum of Squares values quantify the relative contribution of each landmark and semilandmark to the deformation along the relative warps (Rohlf, 1993). Higher SS values are linked to a more significant role in shape variation along a given relative warp axis.
Patterns of Morphospace Occupation
To assess significant differences in morphospace occupation among the four tooth groups and to evaluate if the visual separation of convex hulls in the morphospace is significantly related to differences in morphology (and taxonomy), we used two non-parametric statistical tests: PERMANOVA and ANOSIM (Table 2). The choice to use non-parametric tests is due to the incompleteness of the palaeontological data, which does not allow us to apply parametric tests (e.g., ANOVA and Chi-square) since they require a Gaussian (normal) distribution, more easily achieved when dealing with larger sets that are hard to obtain in palaeontological analyses (Marramà et al., 2016). PERMANOVA (permutational multivariate analysis of variance) is applied to test the presence of significant differences between the distances of two or more group centroids (Anderson, 2001). The null hypothesis for PERMANOVA is that the groups have the same group centroid (Anderson, 2001). ANOSIM (analysis of similarities) is used, instead, to quantitatively define the degree of overlap between two or more groups, through calculation of an R function ranging from 0 (groups are indistinguishable and so completely overlapped) to 1 (groups are completely separated and so clearly different) (Clarke, 1993). The null hypothesis for ANOSIM is that the groups are completely overlapped and therefore indistinguishable (Clarke, 1993). For both tests, Euclidean distances were chosen as distance measure. A randomization with 9999 replicates is applied. The level of reliability of the results, defining the minimum probability that the null hypothesis for PERMANOVA and ANOSIM is true, is set at 0.05.
Non-parametric tests were performed using the software package PAST 5 (PAleontological STatistics) (Hammer et al., 2001).
RESULTS
RW Analysis on the Overall Sample
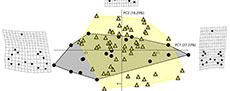
As shown in Table 1, the PCA performed on the new Procrustean coordinates of the entire sample of 120 specimens belonging to four genera (Brachycarcharias, Carcharias, Carcharomodus, and Lamna) detected a total of 26 PC axes, with only the first four (PC1, PC2, PC3, and PC4) explaining more than 5% of variation and accounting together for 83.58% of the overall sample variability. As the goal of this paper is to obtain a direct comparison between the two different approaches, only the first three axes are here illustrated and considered, since PC4 in Marramà and Kriwet (2017) explained less than 5% of variation. Two different morphospaces are then generated, each of them built on a pair of orthogonal PC axes (Figure 2A-B). Deformation grid plots illustrated represent the extreme shapes lying on lowest negative and highest positive scores of each axis.
PC1 (50.42% of total variance) explains most of the variability in the sample and is mainly related to the degree of slant (DS), to the basal and half-crown width (BCW, HCW), to the variation in height and width of the principal cusp (PCH, PCW) and root (RH, RW), to the angle between root lobes (RA) and, at least in part, to the width of the lateral cusplets (LCW). Figure 2A-B illustrates that specimens with wide and short main cusps and wide angles between root lobes, which are typical traits of the posteriormost lateral teeth, lie in negative values. Positive values of PC1 are instead associated with specimens with high and narrow main cusps and roots, and narrower angles between the narrow root lobes, features typical of the anterior shark teeth.
PC2 (12.21% of total variance) is mainly related to the height and width of the lateral cusplets (LCH, LCW), to the basal crown width (BCW), to the width and height of the root (RW, RH), to the angle between its lobes (RA) and, partially, to the height of the principal cusp (PCH). As shown in Figure 2A, negative scores of PC2 are occupied by specimens characterized by very short lateral cusplets and rounded and short root lobes, typical features of Carcharomodus teeth. Conversely, positive values of PC2 are related to teeth with higher lateral cusplets, and narrow and sharp root lobes (e.g., lateral teeth of Carcharias).
Finally, PC3 (11.96% of total variance) is mainly related to the degree of slant of the main cusp (DS) that involves also the distal and mesial crown edge lengths (DCL, IDCE, MCL, and IMCE), but is also related, to a lesser degree, to the shape of the root lobes (defined by RW, RH, and RA), to the crown height (CH), and to the half-crown width (HCW). In Figure 2B, negative values of PC3 are occupied by specimens with weak inclinations of the main cusp and thick root lobes, whereas positive scores are related to strong inclinations of the main cusp and narrow root lobes.
The visual separation of the four taxa in the morphospaces (Figure 2A-B) is clearly supported by the results of the non-parametric tests PERMANOVA and ANOSIM for all the possible pairwise comparisons (Table 2). Both PERMANOVA and ANOSIM clearly support the analysis through geometric morphometrics, underlining the different morphospace occupation of the genera, and so suggesting that this approach is useful to separate taxa. PERMANOVA rejects the null hypothesis of equal group centroids, demonstrating that group centroids are significantly distant from each other (p = 0.0001; F = 10.37). Also, ANOSIM rejects its null hypothesis, showing that the groups, although overlapped in some portions of the morphospace, are still clearly different (p = 0.0001; R = 0.3427).
RW Analyses on the Pairwise Comparisons
In order to maximize the separation between the four genera, new RW analyses were performed and new morphospaces were generated for the pairwise comparisons reported in Table 2. Following Marramà and Kriwet (2017), only comparisons involving Brachycarcharias with the other three taxa are considered herein, since the goal of that paper was to solve contradicting taxonomic issues related to this taxon. As in Marramà and Kriwet (2017), the three morphospaces of the pairwise comparisons are built only on the first two RW axes explaining most of morphological variation. Non-parametric tests (PERMANOVA and ANOSIM) were also performed for each of the three pairwise comparisons.
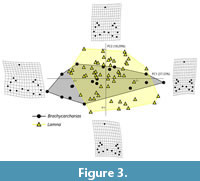 Brachycarcharias vs Lamna. As shown in Table 3, a total of 26 PC axes are identified by the RW analysis for the comparison between Brachycarcharias and Lamna, with the first five explaining more than 5% of variation. PC1 (37.33% of total variation) is related to the variation in height and width of the principal cusp, lateral cusplets, and root and to the degree of slant, whereas PC2 (18.29%) is related to the degree of slant and to root shape. As illustrated in Figure 3, despite a certain amount of overlap in the central portion of the morphospace, these two taxa are clearly separated along PC1 and PC2. Brachycarcharias occupies more extensively both the extreme negative and positive values of PC1. Despite a more complete sample of Lamna teeth, extreme negative scores are only occupied by Brachycarcharias teeth characterized by wider roots, main cusps, and lateral cusplets. Also, a certain portion of the morphospace on positive scores is only occupied by Brachycarcharias teeth having narrower and higher roots, main cusps, and lateral cusplets. Conversely, the Lamna convex hull appears to be more extended along the extreme negative and positive scores of PC2. Specifically, negative values indicate specimens with smaller root lobes, whereas positive PC2 values are linked to stouter, higher, and massive roots. The visual separation of the two groups in the morphospace is clearly supported in Table 4 by the non-parametric tests PERMANOVA (p = 0.0001) and ANOSIM (p = 0.0001).
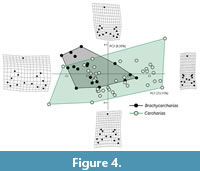 Brachycarcharias vs Carcharias. According to Table 5, the RW analysis performed for the comparison between Brachycarcharias and Carcharias detected a total of 26 axes, with only the first three explaining more than 5% of variation. PC1 (73.11%) and PC2 (8.30%) are roughly related to the same morphological variation detected for the first pairwise comparison (Brachycarcharias vs Lamna) with the two morphospaces that, although a certain degree of overlap, occupy different portions of the plane. In particular, Figure 4 reveals that Carcharias occupies the extreme positive and negative scores of the PC1 not occupied by Brachycarcharias, suggesting that the living genus possesses teeth with more narrow and high main cusps and with longer and narrower root lobes, whereas this latter occupies part of the quadrant defined by negative scores of PC1 and positive scores of PC2, not occupied by Carcharias, likely related to the presence of teeth with very wide roots and big lateral cusplets. Also, for this comparison, the separation and overlapping of the two groups in the morphospace are significantly supported by the results obtained from PERMANOVA (p = 0.0010) and ANOSIM (p = 0.0059) in Table 6.
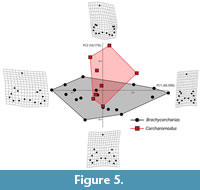 Brachycarcharias vs Carcharomodus. According to Table 7, of the 25 axes identified by the RW analysis for the pairwise comparison between Brachycarcharias and Carcharomodus, only the first five explain more than 5% of variation. PC1 (48.38%) is always related to the variation in height and width of the principal cusp, lateral cusplets and root and to the degree of slant, resembling the morphological variation associated to the same PC axis in the two previous pairwise comparisons (Brachycarcharias vs Lamna and Brachycarcharias vs Carcharias). PC2 (18.17%), on the other hand, appears mostly related to the heights and widths of lateral cusplets. As reported in Figure 5, despite the little overlap of the convex hulls in the central portion of the morphospace, these two genera are clearly distinguishable and separate from each other along both PC1 and PC2. Carcharomodus mostly occupies the positive values of PC2, associated with teeth having extremely small lateral cusplets, whereas some teeth of Brachycarcharias occupy more negative scores of PC2, as they have taller lateral cusplets. Brachycarcharias convex hull is noticeably more extended also in the extreme negative and positive values of PC1, suggesting the presence of higher disparity in tooth shapes, although sampling bias due to more a reduced sample must be considered. The different morphospace occupation of these two taxa is statistically supported, also in this case, by the results of PERMANOVA (p = 0.0170) and ANOSIM (p = 0.0176) in Table 8.
Landmarks’ Relative Contributions
We analyzed the Sum of Squares values (SS), i.e., the sum of squared deviations of a landmark’s coordinates from the mean shape along each relative warp axis, that quantify the relative contribution of each landmark and semilandmark to the deformation along the relative warps (Rohlf, 1993), to better understand which the morphological traits that most contribute to the overall morphological disparity in the overall sample and in the pairwise comparison analyses are. Higher SS values are linked to a more significant role in shape variation along a given relative warp axis. The seven landmarks (L1-L7) and eight semilandmarks (S1-S8) (see Figure 1A) and their SS values are provided by TPSrelw 1.75 (Rohlf, 2003) and are listed in Table 9, Table 10, Table 11, Table 12. The values are then compared to the loading values associated with the PC axes listed in Marramà and Kriwet (2017) that were used, in the same way, to interpret the “meaning” of the components that identify the main factors to which a PC axis is related in the PCA (Hammer et al., 2001). This comparison between the two values (sum of squares and loading values) from the two different approaches (geometric and traditional morphometrics) will allow us to determine which approach is more effective in evaluating the relative ability to detect the greatest amount of morphological variation.
In the overall sample analysis shown in Table 9, the landmarks L2, L4, L6, and L7, which are associated to the width of principal cusp and to the basal crown width, contribute to most of the morphological variation, followed by the semilandmarks S4 and S5 that are related to the variation associated to the angle between root lobes. Also, in the pairwise comparisons between Brachycarcharias vs Lamna and Brachycarcharias vs Carcharias, reported respectively in Table 10-Table 11, the landmarks L2, L4, L6, and L7 and the semilandmarks S4 and S5 are those contributing to most of the morphological variation. Conversely, in the pairwise comparison Brachycarcharias vs Carcharomodus in Table 12, the semilandmarks S1, S2, S3, S4, S5, and S6, which are associated to the root shape on the mesial side, and to the angle between lobes, mostly contribute to the shape variation.
DISCUSSION AND CONCLUSIONS
This study aimed to assess whether traditional and geometric morphometric methods are equally valid for taxonomic identification and to recognize which approach is more effective. Our results demonstrate that geometric morphometrics is a robust and effective tool for testing and corroborating taxonomic hypotheses based on isolated fossil shark teeth, supporting previous research indicating that tooth morphology is a reliable criterion for distinguishing genera (e.g., Nyberg et al., 2006; Whitenack and Gottfried, 2010; Marramà and Kriwet, 2017).
Although some overlap in convex hulls was observed in geometric morphometric analyses, the four genera (Brachycarcharias, Carcharias, Carcharomodus, and Lamna) were clearly separated both in the overall morphospace and in pairwise comparisons (see Figure 2A-B, Figure 3, Figure 4, Figure 5). These results indicate that distinct portions of the morphospace are uniquely occupied by specific taxa, reflecting meaningful morphological differentiation. In particular, the separation between Brachycarcharias and Lamna (Figure 3) corroborates the results of Marramà and Kriwet (2017) and supports earlier ecological and trophic interpretations related to these taxa (cf. Purdy and Francis, 2007; Maisch et al., 2014). The taxonomic separation is further supported in Table 4 by non-parametric statistical tests such as PERMANOVA and ANOSIM, which revealed significant differences in tooth morphology and morphospace occupation. The lower R -values reported in Table 6, Table 8 for the Brachycarcharias-Carcharias and Brachycarcharias-Carcharomodus comparisons (Figure 4-Figure 5) still support intergeneric morphological variation. The consistent statistical significance (p < 0.05) across comparisons, despite relatively low R -values that imply larger morphological overlays since the presence of similar specimens, suggests partial morphological convergence or retained ancestral traits among these lamniform genera.
Both morphometric approaches demonstrated the capacity to detect intergeneric morphological variation. However, differences in morphospace occupation and convex hull spatial extension may partly reflect sample size variation, especially the more complete and morphologically diverse representation of extant taxa (Carcharias taurus, Lamna nasus) compared to the limited fossil record of Carcharomodus. Nonetheless, the occupation of unique regions of morphospace by fossil taxa, not shared with extant forms, suggests that observed shape differences are biologically meaningful and not merely sampling artifacts.
Geometric morphometrics detected all shape differences identified by the traditional approach and additionally captured variables that were not statistically significant in the traditional analysis (i.e., variables with |loading| ≤ 0.5; see Jolliffe, 2002; Abdi and Williams, 2010). This increased sensitivity supports the growing consensus on the utility of the geometric morphometrics in taxonomic studies (Elewa, 2004).
Some variables were found to be associated to the same axes in both methods, but the geometric approach identified a broader set of shape contributors (Table 1). In pairwise comparisons (Table 3, Table 5, Table 7), certain variables were exclusive to one method, likely due to methodological differences and sample size discrepancies. Despite this, results were broadly comparable, as the 15 biometric characters (i.e., the set of 13 linear measurements and two angles) from Marramà and Kriwet (2017) closely correspond with the landmark configuration used in our study, both adequately representing the overall tooth morphology (see also Ilić et al., 2019).
In addition, landmark contribution analyses (Table 9, Table 10, Table 11, Table 12) reveal that traits such as the width of the principal cusp, the basal crown and root width and the angle between root lobes are the primary shape drivers in the overall sample, as well as in the Brachycarcharias-Lamna and Brachycarcharias-Carcharias comparisons. In contrast, root shape and the lobe angle dominate in the Brachycarcharias-Carcharomodus comparison, further highlighting shape-based distinctions among genera.
Geometric and traditional morphometric techniques are thus confirmed as powerful tools for identifying subtle morphological differences in isolated fossil shark teeth belonging to morphologically similar lamniform genera. Importantly, both approaches reliably support prior qualitative taxonomic assignments, consistently distinguishing the four genera analysed herein. While geometric morphometrics has gained increasing application due to its greater precision and visualization potential (Elewa, 2004; Zelditch et al., 2004), traditional morphometrics remains a practical alternative, particularly when working with fragmented or incomplete specimens (Marramà and Kriwet, 2017).
Geometric morphometrics has been widely used in palaeontology to mitigate issues of over-lumping or over-splitting and to identify evolutionary convergence and morphological adaptations (Friedman, 2010; Hedrick and Dodson, 2013; Frédérich et al., 2016; Marramà et al., 2016; Marramà and Carnevale, 2017). These quantitative approaches, however, are not intended to replace qualitative assessments, which remain crucial for identifying traits not readily captured numerically but might serve as tools to test the accuracy of qualitative taxonomic hypotheses (Marramà and Kriwet, 2017).
Supporting previous comparisons of geometric and traditional morphometrics on extant taxa (Maderbacher et al., 2008; Ilić et al., 2019), our study confirms that geometric morphometrics appears more effective in detecting a greater amount of morphological variation and, for this reason, it should be especially preferred in taxonomic and palaeobiological analyses of fossil shark teeth.
ACKNOWLEDGEMENTS
We thank R. Zorzin (Museo Civico di Storia Naturale di Verona), M. Cerato (Museo dei Fossili di Bolca), M. Fornasiero (Museo di Geologia e Paleontologia dell’Università di Padova), E. Bernard (Natural History Museum, London), A. Palandacic (Naturhistorisches Museum, Vienna), S. Füting and W. Eckloff (Museum für Natur und Umwelt, Lübeck) for the facilities and access to fossil material under their care. The manuscript was improved with constructive review provided by Jacopo Amalfitano (Università degli Studi di Padova) and editorial comments by Zoltán Barkaszi. This work was supported by grants ex-60% 2024 from the Università degli Studi di Torino to GC.
REFERENCES
Abdi, H. and Williams, L.J. 2010. Principal component analysis. Wires Computational Statistics, 2(4):433-459. https://doi.org/10.1002/wics.101
Adams, D.C., Rohlf, F.J., and Slice, D.E. 2004. Geometric morphometrics: ten years of progress following the “revolution”. Italian Journal of Zoology, 71(1):5-16.
https://doi.org/10.1080/11250000409356545
Anderson, M.J. 2001. A new method for non-parametric multivariate analysis of variance. Austral Ecology, 26(1):32-46.
https://doi.org/10.1111/j.1442-9993.2001.01070.pp.x
Brito, P.M. and Dutheil, D.B. 2004. A preliminary systematic analysis of Cretaceous guitarfishes from Lebanon, p. 101-109. In Arratia, G. and Tintori, A. (eds.), Mesozoic Fishes 3 -- Systematics, Paleoenvironments and Biodiversity. Verlag Dr. Friedrich Pfeil, München, Germany.
Budker, P. and Whitehead, P.J.P. 1971. The Life of Sharks. Weidenfeld & Nicolson, London.
Cappetta, H. 1987. Chondrichthyes II -- Mesozoic and Cenozoic Elasmobranchii. In series: Schultze, H.P. (ed.), Handbook of Paleoichthyology, Volume 3B. Verlag Dr. Friedrich Pfeil, München, Germany.
Cappetta, H. 2012. Chondrichthyes V -- Mesozoic and Cenozoic Elasmobranchii: Teeth. In series: Schultze, H.P. (ed.), Handbook of Paleoichthyology, Volume 3E. Verlag Dr. Friedrich Pfeil, München, Germany.
Cappetta, H. and Nolf, D. 2005. Revision of some Odontaspididae (Neoselachii: Lamniformes) from the Paleocene and Eocene of the North Sea Basin. Bulletin de l’Institut Royal des Sciences Naturelles de Belgique, Sciences de la Terre, 75:237-266.
Carvalho, M.R. de., Maisey, J.G., and Grande, L. 2004. Freshwater stingrays of the Green River Formation of Wyoming (Early Eocene), with the description of a new genus and species and an analysis of its phylogenetic relationships (Chondrichthyes: Myliobatiformes). Bulletin of the American Museum of Natural History, 284:1-136.
https://doi.org/10.1206/0003-0090(2004)284%3C0001:fsotgr%3E2.0.co;2
Clarke, K.R. 1993. Non-parametric multivariate analysis of changes in community structure. Australian Journal of Ecology, 18(1):117-143.
https://doi.org/10.1111/j.1442-9993.1993.tb00438.x
Cornwell, W.K., Schwilk, L.D.W., and Ackerly, D.D. 2006. A trait-based test for habitat filtering: convex hull volume. Ecology, 87(6):1465-1471.
https://doi.org/10.1890/0012-9658(2006)87[1465:attfhf]2.0.co;2
Dulvy, N.K., Fowler, S.L., Musick, J.A., Cavanagh, R.D., Kyne, P.M., Harrison, L.R., Carlson, J.K., Davidson, L.N.K., Fordham, S.V., Francis, M.P., Pollock, C.M., Simpfendorfer, C.A., Burgess, G.H., Carpenter, K.E., Compagno, L.J.V., Ebert, D.A., Gibson, C., Heupel, M.R., Livingstone, S.R., Sanciangco, J.C., Stevens, J.D., Valenti, S., and White, W.T. 2014. Extinction risk and conservation of the world’s sharks and rays. eLife, 3:e00590.
https://doi.org/10.7554/eLife.00590
Elewa, A.M.T. 2004. Morphometrics: Applications in Biology and Paleontology. Springer-Verlag, Heidelberg, Germany.
https://doi.org/10.1007/978-3-662-08865-4
Frédérich, B., Marramà, G., Carnevale, G., and Santini, F. 2016. Non-reef environments impact the diversification of extant jacks, remoras and allies (Carangoidei, Percomorpha). Proceedings of the Royal Society B, 283(1842):20161556.
https://doi.org/10.1098/rspb.2016.1556
Friedman, M. 2010. Explosive morphological diversification of spiny-finned teleost fishes in the aftermath of the end-Cretaceous extinction. Proceedings of the Royal Society B, 277(1688):1675-1683.
https://doi.org/10.1098/rspb.2009.2177
Gotelli, N.J. and Ellison, A.M. 2004. A Primer of Ecological Statistics, Second Edition. Sinauer Associates, Sunderland, Massachusetts.
Gunz, P., Mitteroecker, P., and Bookstein, F.L. 2005. Semilandmarks in three dimensions, p. 73-98. In Slice, D.E. (ed.), Modern Morphometrics in Physical Anthropology. Springer, Boston, Massachusetts.
https://doi.org/10.1007/0-387-27614-9_3
Hammer, Ø. and Harper, D.A.T. 2006. Paleontological Data Analysis. Blackwell Publishing, Malden, Massachusetts.
https://doi.org/10.1002/9780470750711
Hammer, Ø., Harper, D.A.T., and Ryan, P.D. 2001. PAST: paleontological statistics software package for education and data analysis. Palaeontologia Electronica, 4(1):1-9.
https://palaeo-electronica.org/2001_1/past/issue1_01.htm
Harper, D.A.T. 1999. Numerical Palaeobiology: Computer-based Modelling and Analysis of Fossils and their Distributions. John Wiley & Sons, Chichester.
https://doi.org/10.1017/S0016756800334410
Hedrick, B.P. and Dodson, P. 2013. Lujiatun psittacosaurids: understanding individual and taphonomic variation using 3D geometric morphometrics. PLoS ONE, 8(8):e69265.
https://doi.org/10.1371/journal.pone.0069265
Hotelling, H. 1933. Analysis of a complex of statistical variables into principal components. Journal of Educational Psychology, 24(7):498-520.
https://doi.org/10.1037/h0070888
Hovestadt, D.C., Hovestadt-Euler, M., and Micklich, N. 2010. A review of the chondrichthyan fauna of Grube Unterfeld (Frauenweiler) clay pit. Kaupia, 17:57-71.
Ilić, M., Jojić, V., Stamenković, G., Marković, V., Simić, V., Paunović, M., and Crnobrnja-Isailović, J. 2019. Geometric vs. traditional morphometric methods for exploring morphological variation of tadpoles at early developmental stages. Amphibia-Reptilia, 40(4):499-509.
https://doi.org/10.1163/15685381-00001193
James, F.C. and McCulloch, C.E. 1990. Multivariate analysis in ecology and systematics: Panacea or Pandora’s box? Annual Review of Ecology, Evolution and Systematics, 21:129-166.
https://doi.org/10.1146/annurev.es.21.110190.001021
Janžekovič, F. and Novak, T. 2012. Chapter 8. PCA -- A powerful method for analyze ecological niches, p. 127-142. In Sanguansat, P. (ed.), Principal Component Analysis -- Multidisciplinary Applications. InTech, Rijeka.
https://doi.org/10.5772/38538
Jolliffe, I.T. 2002. Principal Component Analysis. Springer, New York.
https://doi.org/10.1007/b98835
Kriwet, J., Mewis, H., and Hampe, O. 2015. A partial skeleton of a new lamniform mackerel shark from the Miocene of Europe. Acta Palaeontologica Polonica, 60(4):857-875.
https://doi.org/10.4202/app.00066.2014
Legendre, P. and Legendre, L. 1998. Numerical Ecology, Second Edition. Elsevier, Amsterdam.
Maderbacher, M., Bauer, C., Herler, J., Postl, L., Makasa, L., and Sturmbauer, C. 2008. Assessment of traditional versus geometric morphometrics for discriminating populations of the Tropheus moorii species complex (Teleostei: Cichlidae), a Lake Tanganyika model for allopatric speciation. Journal of Zoological Systematics and Evolutionary Research, 46(2):153-161.
https://doi.org/10.1111/j.1439-0469.2007.00447.x
Maisch, H.M., Becker, M.A., Raines, B.W., and Chamberlain, J.A. 2014. Chondrichthyans from the Tallahatta-Lisbon Formation contact (Middle Eocene), Silas, Choctaw County, Alabama. Paludicola, 9(4):183-209.
Marramà, G. and Carnevale, G. 2017. Morphology, relationships and paleobiology of the Eocene barracudina † Holosteus esocinus (Aulopiformes, Paralepididae) from Monte Bolca, Italy. Zoological Journal of the Linnean Society, 181(1):209- 228.
https://doi.org/10.1093/zoolinnean/zlw029
Marramà, G. and Kriwet, J. 2017. Principal component and discriminant analyses as powerful tools to support taxonomic identification and their use for functional and phylogenetic signal detection of isolated fossil shark teeth. PLoS ONE, 12(11):e0188806.
https://doi.org/10.1371/journal.pone.0188806
Marramà, G., Bannikov, A.F., Tyler, J.C., Zorzin, R., and Carnevale, G. 2016. Controlled excavations in the Pesciara and Monte Postale sites provide new insights about the paleoecology and taphonomy of the fish assemblages of the Eocene Bolca Konservat-Lagerstätte, Italy. Palaeogeography, Palaeoclimatology, Palaeoecology, 454:228-245.
https://doi.org/10.1016/j.palaeo.2016.04.021
Marramà, G., Carnevale, G., Engelbrecht, A., Claeson, K.M., Zorzin, R., Fornasiero, M., and Kriwet, J. 2017. A synoptic review of the Eocene (Ypresian) cartilaginous fishes (Chondrichthyes: Holocephali, Elasmobranchii) of the Bolca Konservat-Lagerstätte, Italy. Paläontologische Zeitschrift, 92(2):283-313.
https://doi.org/10.1007/s12542-017-0387-z
Marramà, G., Engelbrecht, A., Mörs, T., Reguero, M.A., and Kriwet, J. 2018. The southernmost occurrence of Brachycarcharias (Lamniformes, Odontaspididae) from the Eocene of Antarctica provides new information about the paleobiogeography and paleobiology of Paleogene sand tiger sharks. Rivista Italiana di Paleontologia e Stratigrafia, 124(2):283-298.
https://doi.org/10.13130/2039-4942/9985
Marramà, G., Engelbrecht, A., Carnevale, G., and Kriwet, J. 2019. Eocene sand tiger sharks (Lamniformes, Odontaspididae) from the Bolca Konservat-Lagerstätte, Italy: palaeobiology, palaeobiogeography and evolutionary significance. Historical Biology, 31(2):102-116.
https://doi.org/10.1080/08912963.2017.1341503
Marramà, G., Villalobos-Segura, E., Zorzin, R., Kriwet, J., and Carnevale, G. 2023. The evolutionary origin of the durophagous pelagic stingray ecomorph. Palaeontology, 66(4):e12669.
https://doi.org/10.1111/pala.12669
Mitteroecker, P. and Gunz, P. 2009. Advances in geometric morphometrics. Evolutionary Biology, 36(2):235-247.
https://doi.org/10.1007/s11692-009-9055-x
Nyberg, K.G., Ciampaglio, C.N., and Wray, G.A. 2006. Tracing the ancestry of the great white shark, Carcharodon carcharias, using morphometric analyses of fossil teeth. Journal of Vertebrate Paleontology, 26(4):806-814.
https://doi.org/10.1671/0272-4634(2006)26[806:ttaotg]2.0.co;2
Paillard, A., Shimada, K., and Pimiento, C. 2021. The fossil record of extant elasmobranchs. Journal of Fish Biology, 98(2):445-455.
https://doi.org/10.1111/jfb.14588
Pimiento, C., Cantalapiedra, J.L., Shimada, K., Field, D.J., and Smaers, J.B. 2019. Evolutionary pathways toward gigantism in sharks and rays. Evolution, 73(3):588-599.
https://doi.org/10.1111/evo.13680
Purdy, R.W. and Francis, M.P. 2007. Ontogenetic development of teeth in Lamna nasus (Bonnaterre, 1758) (Chondrichthyes: Lamnidae) and its implications for the study of fossil shark teeth. Journal of Vertebrate Paleontology, 27(4):798-810.
https://doi.org/10.1671/0272-4634(2007)27[798:odotil]2.0.co;2
Robertson, M.P., Caithness, N., and Villet, M.H. 2001. A PCA-based modelling technique for predicting environmental suitability for organisms from presence records. Diversity and Distributions, 7(1):15-27. https://doi.org/10.1046/j.1472-4642.2001.00094.x
Rohlf, F.J. 1993. Relative warp analysis and an example of its application to mosquito wings, p. 131-159. In Marcus, L., Bello, E., and García-Valdecasas, A. (eds.), Contributions to Morphometrics. Museo Nacional de Ciencias Naturales, Madrid.
Rohlf, F.J. 2003. TpsRelw, relative warps analysis, version 1.36. Department of Ecology and Evolution, State University of New York at Stony Brook.
Rohlf, F.J. 2005. TpsDig, digitize landmarks and outlines, version 2.05. Department of Ecology and Evolution, State University of New York at Stony Brook.
Rohlf, F.J. and Marcus, L.F. 1993. A revolution morphometrics. Trends in Ecology and Evolution, 8(4):129-132.
https://doi.org/10.1016/0169-5347(93)90024-j
Whitenack, L.B. and Gottfried, M.D. 2010. A morphometric approach for addressing tooth-based species delimitation in fossil mako sharks, Isurus (Elasmobranchii: Lamniformes). Journal of Vertebrate Paleontology, 30(1):17-25.
https://doi.org/10.1080/02724630903409055
Zelditch, M.L., Swiderski, D.L., Sheets, H.D., and Fink, W.L. 2004. Geometric Morphometrics for Biologists: A Primer. Elsevier, Amsterdam.
https://doi.org/10.1016/b978-0-12-778460-1.x5000-5
