

 Patterns of diet and body mass of large ungulates from the Pleistocene of Western Europe, and their relation to vegetation
Article number: 19.3.32A
https://doi.org/10.26879/443
Copyright Palaeontological Association, September 2016
Author biographies
Plain-language and multi-lingual abstracts
PDF version
Submission: 25 November 2013. Acceptance: 20 July 2016
{flike id=1567}
ABSTRACT
Ungulate diets may vary following differences in vegetation, and their body size is affected by a complex set of ecological and physiological variables. Here we analyse Middle and Late Pleistocene British and German ungulate palaeocommunities to test whether there are significant correlations of diet and body size of ungulate species with vegetation openness. We also evaluate the role of interspecific interactions on the diet and body mass of the ungulate species. We use mesowear for dietary analyses and regression equations for estimating body mass from skeletal measures. The results show a correlation between ungulate mesowear and non-arboreal pollen percentages of the localities, but there are marked differences between species. Body masses of rhinoceroses (Rhinocerotidae) and deer (Cervidae) are on average higher in open environments, whereas aurochs (Bos primigenius) does not show clear connection of body size with vegetatonal conditions, and bison (Bison spp.) and wild horses (Equus ferus) have on average smaller mean size in more open ecosystems, possibly because of high population densities and resulting resource limitations. It is evident that the correlation of body size and vegetation openness is not straightforward and is likely to reflect the varying effects of population density, ecological adaptations and environmental conditions on body size in different species.
Juha Saarinen. Department of Geosciences and Geography, University of Helsinki, P.O. Box 64, Gustaf Hällströmin katu 2a, 00014 Helsinki, Finland. juha.saarinen@helsinki.fi
and Department of Earth Sciences, Natural History Museum, Cromwell Road, London SW7 5BD, UK.
Jussi Eronen. Department of Geosciences and Geography, University of Helsinki, P.O. Box 64, Gustaf Hällströmin katu 2a, 00014 Helsinki, Finland. jussi.t.eronen@helsinki.fi
Mikael Fortelius. Department of Geosciences and Geography, University of Helsinki, P.O. Box 64, Gustaf Hällströmin katu 2a, 00014 Helsinki, Finland. mikael.fortelius@helsinki.fi
Heikki Seppä. Department of Geosciences and Geography, University of Helsinki, P.O. Box 64, Gustaf Hällströmin katu 2a, 00014 Helsinki, Finland. heikki.seppa@helsinki.fi
Adrian M. Lister. Department of Earth Sciences, Natural History Museum, Cromwell Road, London SW7 5BD, UK. a.lister@nhm.ac.uk
Keywords: mesowear; body mass; ungulate communities; vegetation openness; Pleistocene
Final citation: Saarinen, Juha, Eronen, Jussi, Fortelius, Mikael, Seppä, Heikki, and Lister, Adrian M. 2016. Patterns of diet and body mass of large ungulates from the Pleistocene of Western Europe, and their relation to vegetation. Palaeontologia Electronica 19.3.32A: 1-58. https://doi.org/10.26879/443
palaeo-electronica.org/content/2016/1567-pleistocene-mammal-ecometrics
INTRODUCTION
The composition of living herbivorous mammal communities generally reflects vegetation patterns: grazing and grass-dominated mixed-feeding species are more abundant in grassland environments than in forest environments, which are characterised by browsers and browse-dominated mixed-feeders (Gordon and Prins, 2008). However, diets within individual ungulate species can vary considerably in open versus closed environments and in different ungulate assemblages following the availability of resources, as well as resource competition with, and resource facilitation by, other ungulate species (e.g., Langvatn and Albon, 1986; Hobbs et al., 1996; Latham, 1999; Arsenault and Owen-Smith, 2002; Stewart et al., 2002).Variation of body size in herbivorous mammal species is also probably influenced, at least in part, by open versus closed habitats and by the quality and abundance of vegetation, in ways that may vary with species’ adaptations (Jarman, 1974; Langvatn and Albon, 1986; Guthrie, 1990; Bro-Jørgensen, 2008). In this study we analyse local patterns of diet of some of the most abundant ungulate species from Middle and Late Pleistocene mammal localities of Western and Central Europe in order to explore their relationship with vegetation reconstructions. We also examine whether body size is correlated with vegetation type and diet. Moreover, we compare the patterns of diet and body size across ungulate species to evaluate the role of diffent ecological strategies and potential resource competition between the species.
Several recent studies have demonstrated dietary variation in fossil ungulate species from localities with different environmental conditions. For example, Kahlke and Kaiser (2011) used mesowear analysis on the Middle Pleistocene rhinoceros Stephanorhinus hundsheimensis in Germany. The population from the cool-climate of Süssenborn has, on average, a mesowear signal indicating a more abrasive diet than that of the interglacial of Voigtstedt. Kaiser (2004) did a similar analysis for the Late Miocene populations of the equid Hippotherium primigenium from Höwenegg and Eppelsheim, Germany. He noted that the population from Höwenegg had a mesowear signal indicating browsing diet roughly similar to that of the modern Sumatran rhinoceros (Dicerorhinus sumatrensis), whereas the population from Eppelsheim had a dietary signal resembling that of the common waterbuck (Kobus ellipsiprymnus), which is a grazer. Palaeoenvironmental data indicate that Höwenegg was probably a subtropical mesophytic forest, which is supported by the overall composition of the mammal fauna, whereas Eppelsheim would likely have included at least seasonally abundant grassy vegetation, which is supported by palaeobotanic finds (Kaiser, 2004). Another example is the study by Rivals et al. (2015a) showing intraspecific variation in the diets of proboscidean species Anancus arvernensis, Mammuthus rumanus and M. meridionalis between Early Pleistocene localities in Europe, based on tooth microwear analysis.
It can be hypothesised that differences in the diets of local fossil populations of a species reflect differences in local vegetation, and probably also the presence of competitors. We have included all the most common species of large ungulates from several British and German Middle and Late Pleistocene localities (see Table 1) to test the correlation of their dietary signals with environmental proxy data obtained from pollen records. Non-arboreal pollen percentages (NAP %) can be used as rough estimates of vegetation openness (Svenning, 2002), although they do not allow precise quantitative estimates of the extent of open landscape, or productivity (Sugita et al., 1999). It can be predicted that the broad dietary composition of the ungulate community is correlated with the degree of openness of vegetation, although it is likely that some species are so specialized in utilizing certain kinds of plant material that their diet does not vary greatly across localities with different plant communities, and they would be absent if their preferred food were missing.
Correlations of ungulate body mass with environmental characteristics can also be predicted but they are likely to be complex. Body size is affected by a variety of physiological and ecological variables, and it may be difficult to separate their effects on the body size of individual species (e.g., Jarman, 1974; Peters, 1983; West et al., 1997; Gillooly et al., 2002; Haskell et al., 2002; Damuth, 2007). Body size has been postulated to relate to temperature, via its effects on heat conservation (e.g., Bergmann, 1847; Peters, 1983), but as a general explanation of mammalian size variation this idea has been strongly criticized (Geist, 1987; Lister, 1992). For herbivorous mammals, more likely determinants include habitat structure, social structure (e.g., Jarman, 1974), and the availability and abundance of their optimal food (e.g., Langvatn and Albon, 1986). In particular, large body size could be associated with open environments for a number of reasons. First, because of mostly seasonally harsh climates but long sunshine hours and fertile soils created by glacial erosion, the open environments of glacial Europe comprised seasonally highly productive plant communities with low chemical defences, thus providing abundant and good-quality sources of food for herbivores (Guthrie, 1990; Zimov et al., 1995; Geist, 1998). Second, large body size enables the processing of large quantities of this often digestively challenging plant food, and also increases resistance to seasonal shortages of food and water (Peters, 1983; Lindstedt and Boyce, 1985; Clauss et al., 2003) during the harsh winters of glacial episodes. Third, large size may help in predator avoidance because of its benefit for energy-efficient locomotion in open environments (Peters, 1983). Fourth, it has been suggested that ungulates tend to form larger groups in open environments and increasing competition for mates among males, which could lead to selection for larger body size (Geist, 1971). Finally, it has been suggested that smaller body sizes could be beneficial in closed environments because of easier maneuverability (Bro-Jørgensen, 2008). However, the relationship between body size and vegetational environment is likely to be complex: body size could also be smaller in open habitats, especially in gregarious ungulate species, because their tendency to form larger groups in open environments could in fact result in increased population densities (Khan et al., 1996; Borkowski, 2000). This could limit the resources available for each individual, resulting in smaller body size via intraspecific competition (e.g., Wolverton et al., 2009). It might also be hypothesised that a shift to suboptimal diet forced by vegetational change or competition might adversely affect the body size of individuals in a local population. Here we examine these relationships by comparing body masses of key ungulate species across localities with vegetation reconstructed from pollen data and with their diets using mesowear analysis.
MATERIALS AND METHODS
Localities and Collections
Middle and Late Pleistocene localities from Britain and Germany were chosen for this study because terrestrial Pleistocene deposits in these regions are extensive and stratigraphically well understood (e.g., Schreve and Bridgland, 2002), and there are many localities with both mammal and pollen records. The ungulate fossil material was studied by Juha Saarinen in the collections of the Natural History Museum of London (NHML), Torquay Museum (TM), the Sedgwick Museum of Geology, Cambridge (SMC), University Museum of Zoology, Cambridge (UMZC), Ipswich Museum (IM), British Geological Survey at Keyworth (BGS), Staatliches Museum für Naturkunde, Stuttgart (SMNS), Staatliches Museum für Naturkunde, Karlsruhe (KMNS) and the Quaternary Palaeontology Research Station of the Senckenberg institute, Weimar (IQP).
To ensure adequate sample sizes, only localities rich in Middle or Late Pleistocene large mammal remains were chosen. Even so, not all species are represented by statistically significant samples. Analyses of the total ungulate faunas were performed only for localities where key species representing more than one ecological guild (specialised browsers, specialized grazers and/or more generalistic mixed-feeders) were present. All species with large enough sample sizes (at least >3, mostly >10) were included in the locality-based analyses. Thus, while taphonomic biases should be borne in mind, we expect the results to adequately reflect the ecomorphological profiles of the faunas.
With the exception of pigs and hippopotamuses, all the ungulate species (Perissodactyla and Artiodactyla) with sufficient sample sizes were included (Table 1). Suidae was excluded because in the Middle and Late Pleistocene of Europe it is represented only by the wild boar (Sus scrofa), the fossils of which are rare, and the original mesowear scoring method of Fortelius and Solounias (2000) cannot be applied to bunodont teeth. Hippopotamus was excluded from the dietary analyses for the same reason, although it probably had a significant role in some interglacial mammal communities, such as the Ipswichian of Barrington, England (Gibbard and Stuart, 1975; Turner, 1975; Stuart, 1976; Stuart and Gibbard, 1986).
Mesowear Analysis
As a proxy for diet, we utilise the mesowear method. This is based on the abrasiveness of plant material consumed by herbivorous mammals and its effect on tooth wear. At present it is understood that low abrasiveness of diet (e.g., dicotyledonous leaves) allows attrition (tooth-to-tooth wear) to dominate, leading to high and sharp tooth cusps, whereas more abrasive components (especially grass) cause the cusps to wear down, becoming lower and rounder. Highly abrasive diet typical for grazers causes low and blunt wear relief on the teeth. This method has been successfully applied to fossil ungulate teeth (e.g., Kaiser, 2004; Mihlbachler and Solounias, 2006; Rivals et al., 2007; Croft and Weinstein, 2008; DeMiguel et al., 2008; Kahlke and Kaiser, 2011; Mihlbachler et al., 2011) and is grounded in studies of modern ungulates of known diet (e.g., Fortelius and Solounias, 2000; Clauss et al., 2007). Morphological adaptations improving wear resistance of herbivorous mammal teeth, such as increased molar crown height (hypsodonty), reflect the conditions under which they evolved and have been shown to be adaptive both to environmental factors (such as precipitation and erosion rates, which regulate the accumulation of mineral particles on plant material), as well as to dietary factors (abrasive food items, mainly grass). The mesowear signal, on the other hand, has been demonstrated to show a purely dietary signal (non-abrasive vs. abrasive plant material, or browse vs. grass) (Louys et al., 2012; Kaiser et al., 2013; Kubo and Yamada, 2014). Mesowear analysis will thus provide a robust proxy for ungulate diet irrespective of abiotic environmental and climatic effects.
Mesowear scoring was undertaken following Fortelius and Solounias (2000). Second upper molars were predominantly used, while first or third upper molars were chosen in some cases for increasing sample sizes. Lower molars of Cervidae were used only in a couple of cases to complement the data, when the mesowear was clearly high and sharp, in which case it would be sharp in upper molars as well (see Kaiser and Fortelius, 2003). For analysing dietary signals between the localities, mesowear scores were transformed into univariate values on a scale from 1 (low abrasiveness of diet, attrition-dominated tooth wear) to 3 (high abrasiveness of diet, abrasion-dominated tooth wear) by using the following method:
1. The shape of the cusps was coded as a numeric value from 1 to 3 (1 = sharp, 2 = rounded, 3 = blunt) and the height of the cusps as 1 or 3 (1 = high, 3 = low).
2. In the sample of teeth of a species from a locality, “shape value” was calculated as the arithmetic mean of the shape values and “height value” as the arithmetic mean of the height values.
3. The mesowear value for the sample was calculated as the arithmetic mean of its “shape value” and “height value”.
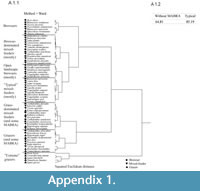 Note that this method of calculating mesowear as a univariate value is similar in principle to those used by Rivals et al. (2007) and Kaiser (2011), but instead of using numeric values from 0 to 3 to reflect the combined cusp height and shape of each individual and then averaging across the sample, we obtain sample averages of cusp height and shape separately and then combine to calculate the final mesowear value. This was done because it more closely follows the original methodology, as introduced by Fortelius and Solounias (2000), allowing for all combinations of cusp shape and relief. To validate this approach, we calculated univariate mesowear values from the original mesowear data for extant species used by Fortelius and Solounias (2000) and tested them by using the same statistical approaches as used by these authors. We performed hierarchical clustering analysis to see if our mesowear values cluster the modern species into biologically meaningful dietary groups, and discriminant analyses to test how well our mesowear values classify the modern species into the “traditional” dietary classes of browsers, mixed-feeders and grazers (see Fortelius and Solounias, 2000). The results of those tests support our approach and are given in Appendix 1.
Body Size
Previous studies of body size variation in Pleistocene mammals have compared individual skeletal measurements (e.g., Lister, 1994) or body mass estimates (e.g., Alberdi et al., 1995) in a single genus or species. Body mass estimates based on regression equations between bone measurements and body masses across a given modern mammal group (e.g., Damuth and McFadden, 1990) provide a way of combining body size data obtained from several skeletal or dental measures. The benefits of this approach are that body mass is a universal measure of size comparable between organisms of different body plan, and that it enables large, statistically significant amounts of material to be analysed.
For the body mass analyses only postcranial bone measurements were used as these are generally the best predictors of body mass (e.g., Damuth and McFadden, 1990), and the addition of dental measurements would require separate analysis as they have different scaling relationships with body size (Damuth and McFadden, 1990). The measurements comprise antero-posterior and medio-lateral diameters of epiphyses and diaphyses of metapodials, tibiae, radii, humeri and femora. Measurement protocols follow Scott (1990). The measurements were taken with digital calipers with 0.1 mm precision. Body mass estimates were based on the regression equations of Scott (1990) for all species except for Rhinocerotidae, and Fortelius and Kappelman (1993) for Rhinocerotidae, based on body masses and skeletal measurements of a range of extant species. Given the generally good statistical power of these predictive equations, we consider it justified to use them for individual body mass estimates within the species (not just at the inter-specific level). Relative body size, on a scale of 0 to 1, was calculated by dividing the mean body masses of the species at a given locality by the largest mean body mass of the species across localities.
Pollen Data
Non-arboreal pollen (NAP) percentages were obtained from original published values where available, but in some cases they were estimated visually from pollen diagrams (Table 1). Pteridophyte spores and aquatic plants were excluded. Pollen from forest shrubs (such as Corylus and Salix) were considered “arboreal” because they do not indicate an open environment.
Connecting the pollen records with large ungulate assemblages from a given locality can be challenging. In a few cases, pollen samples have been obtained from sediment preserved in the bones of large mammals, for example from the Ipswichian of Barrington, England (Gibbard and Stuart, 1975). At other sites, the stratigraphic origin of the mammal fossils within a specific pollen zone is known, and NAP% values of that zone were used in the analyses. In further cases, the stratigraphic relation between the pollen and mammal fossils is unclear, with potential for false association (Sutcliffe, 1975). In such cases, minimum, maximum and mean NAP % were determined for the pollen sequences from the locality and examined separately to take account of uncertainty in the correlation with the mammal fossils. It has been suggested that in some localities, Barrington and Swanscombe in particular, pollen records may give a biased picture of the original vegetation composition. For Barrington, its uniquely high NAP percentage compared to other UK mid-Ipswichian sites has been suggested to result from defecation by grazing hippopotamuses in the river where the deposits formed 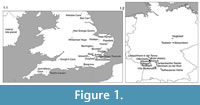 (Gibbard and Stuart, 1975). For Swanscombe, poor and selective pollen preservation makes the residual pollen profile unreliable (Turner, 1985). We discuss these cases separately in the cases where they may have an impact on the interpretations of our results.
For each mammal species, we also calculated the minimum, maximum and mean NAP percentages across localities in which they occur (Table 2). The localities with their ages, mammal species studied and pollen data collated for this study are shown in Table 1. A map of the localities is shown in Figure 1.
Analyses
The following analyses were performed:
1. Linear correlation analysis of the minimum, maximum and mean NAP percentages with species’ mean mesowear values, mean body masses and body size indices across localities. The species body mass - NAP comparisons were done using specimen-level body mass data rather than sample means.
2. Comparison of mean mesowear values with the presence/absence of other ungulate species to explore the role of interspecific relationships.
3. Pairwise correlations of mean body masses between species across localities.
4. Comparison of mean body masses of palaeopopulations of species across localities. This was undertaken by pairwise Wilcoxon tests, because normal distribution or equal variance could not be assumed for the body mass estimate data. This is the case in particular because of the effects of sexual dimorphism, combined with different social structures, on body size distributions within species.
5. Correlations of mean mesowear and mean body mass per species across localities.
Our approach does not take into account the possible effect of sexual dimorphism, which might cause some biases in sample mean body masses, if genders are unequally represented, especially likely if sample sizes are low. Postcranial bones are often impossible or difficult to assign to gender, and thus we could not assess the gender composition of samples, or analyse males and females separately. For perissodactyl species (horses and rhinos) sexual dimorphism in size is generally low and can be disregarded. For species known to be sexually dimorphic, especially artiodactyls such as Cervus elaphus and Bison priscus, sample sizes are mostly large enough to warrant an assumption that males and females are both represented, justifying the use of mean body mass as an estimate of population mean.
Many of the bone samples used here have been measured in studies of individual species variation by previous authors (e.g., Forsten, 1991, 1993, 1999; Lister, 1994; Lister et al., 2010; Breda et al., 2010; Van Asperen, 2010, 2013), but here we compare body mass estimates instead of linear bone dimensions, and compare results across species as well.
There is considerable taxic turnover of mammals between the early and late Middle Pleistocene in Western Europe. Accordingly, Late Middle and Late Pleistocene localities were considered separately from early Middle Pleistocene localities when analysing the body mass, because many species are not common to the two intervals. Some localities for which pollen data were not available, but which have rich ungulate fauna with measurement data, are included in the discussion.
RESULTS
Vegetational Environments of the Mammals
Most of the common and abundant mammal species occur in a wide range of environments, from ones with predominantly closed vegetation (low NAP %, roughly 0 - 30 % NAP) to very open vegetation (high NAP %, roughly 70 - 100 % NAP) (Table 1-Table 2). Of these species, Cervus elaphus and Equus ferus are most clearly associated with both open and closed environments, as shown by the wide range of their associated NAP percentages. Megaloceros giganteus and Bison priscus are commonly associated with rather open environments (i.e., with mean NAP > 50 %), but occur also in relatively low NAP localities. Dama dama, Bos primigenius and Stephanorhinus hemitoechus tend to be mostly associated with relatively closed environments, but their occurrence in the low NAP environment of Barrington, England, indicates variability in this regard as well. The early Middle Pleistocene “woodland” bison (Bison shoetensacki) and rhinoceros (Stephanorhinus hundsheimensis) are predominantly associated with closed environments as shown by their low mean environmental NAP %, but they also occur in semi-open environments (roughly 30 - 70 % NAP). Merck’s rhinoceros ( Stephanorhinus kirchbergensis) is also mostly associated with low NAP environments, but it does occur in localities which indicate semi-open conditions, such as Ilford, England. European elk (moose) Alces alces and roe deer Capreolus capreolus have the lowest environmental NAP percentages, which supports the status of these species as forest-adapted specialists. The reindeer (Rangifer tarandus ) and the woolly rhinoceros (Coelodonta antiquitatis) represent the other extreme, being clearly associated with open environments (NAP > 80 %), and they are more clearly associated with glacial stages than any other species analysed in this study.
Mesowear
The overall mean and range of mesowear values of the most common species, together with their average environmental NAP percentages, are shown in Table 2. For full data see Appendix 2. There are clear interspecific differences in dietary strategies and their correspondence with environmental openness.
Species with low mesowear values are generally associated with relatively low NAP environments and species with high mesowear values with high NAP environments, but this is not always the case (Table 2). Equus ferus and Rangifer tarandus are the most striking exceptions to the pattern. Equus ferus has the highest mean mesowear values of all the species, corresponding with specialized grazing diet, but the species is not restricted to open environments. Conversely, Rangifer tarandus is a browse-dominated feeder with low mesowear values, but occupies environments with high NAP % (Table 2).
Variations in dietary niche breadth are also evident (Table 2). Alces alces, Capreolus capreolus and Stephanorhinus kirchbergensis have low mean mesowear values (close to 1) with relatively small variation, indicating browsing diets for these species . Rangifer tarandus also has a low mean mesowear value typical of browsers, but it shows higher variation than the other browsers. Cervus elaphus , Dama dama and Stephanorhinus hundsheimensis have relatively low (1.11 - 1.16) mean mesowear values, indicating browse-dominated mixed-feeding diet, but show significant local variation, especially C. elaphus. Megaloceros giganteus and Stephanorhinus hemitoechus have intermediate means (1.38 and 1.29, respectively) and high local variation, indicating generalized and flexible mixed-feeding. The large bovids, Bison schoetensacki, Bison priscus and Bos primigenius have intermediate mean mesowear values (1.44 - 1.46) indicating mixed-feeding diets with a significant component of grass, but there are differences in local variation among the species: Bison schoetensacki and Bos primigenius show low variation, B. priscus high. Equus ferus and Coelodonta antiquitatis have high, abrasion-dominated mean values (2.35 and 2.21, respectively), which suggests generally grazing diets, but they show some remarkable local variation.
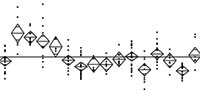
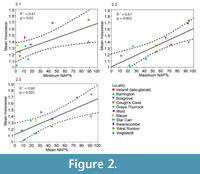 Considering mammalian assemblages as a whole, their combined mean mesowear values in localities for which pollen records were available, show a statistically significant positive correlation with minimum, maximum and mean NAP % (Figure 2 and Table 3). Biases in the sampling of ungulate faunas and pollen may affect the correlation, which might in reality be stronger. For example, hippopotamus is not included in the mesowear signal from Barrington, which probably brings the mean lower than would be expected for the locally high NAP %. Considering individual mammalian families, Cervidae and Rhinocerotidae show statistically significant positive correlations of their mean mesowear signal with the NAP %, Bovidae shows significant positive correlation only with maximum NAP %, and Equidae as a family does not show a significant correlation of mesowear with NAP % (Table 3).
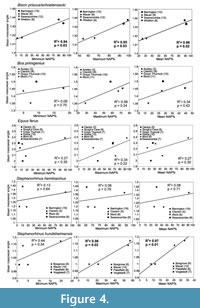
Within individual species, mean mesowear values tend to show positive relationships with NAP % of the localities (Figure 3-Figure 4 and Table 4 bottom rows). All the species with sufficient data to analyse this, except Cervus elaphus and Stephanorhinus hemitoechus (but see Discussion), show positive R2 between mesowear values and NAP % (Figure 3-Figure 4):
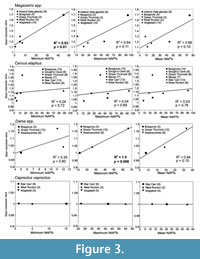 Megaloceros and Praemegaceros spp., i.e., megacerine deer: statistically significant positive correlation of mesowear and minimum NAP % (Figure 3).
- Megaloceros giganteus: significantly higher mean mesowear value in the open late-glacial environment of Ireland, than in the relatively closed environment of Grays Thurrock (Figure 3).
- Dama dama: significant positive correlation of mean mesowear values with maximum NAP % (Figure 3).
- Bison priscus/schoetensacki: significant positive correlation of mean mesowear values with minimum, maximum and mean NAP %, despite the low number of cases (Figure 4).
- Bos primigenius and Equus ferus: positive R2 values, which while non-significant at p = 0.05, are consistent with a positive relationship between NAP and mesowear (Figure 4).
- Stephanorhinus hundsheimensis: significant positive correlation of mean mesowear values with maximum and mean NAP % despite the low number of cases (Figure 4).
- Stephanorhinus kirchbergensis: higher mesowear value in the more open environment of Ilford than in the more closed environment of Grays Thurrock (Appendix 2).
These results show that ungulate species tend to shift their diet according to environment, even if species have different dietary adaptations, and that open-environment browsing (in Rangifer tarandus) as well as closed-environment grazing (in some populations of Equus ferus) are possible strategies. The specialised browser Capreolus capreolus does not show any differences in mesowear values between the localities, indicating that it did not shift its diet according to environment.
Cervus elaphus does not show any significant correlation of mesowear and NAP % (Figure 3). The lack of correlation in Cervus elaphus despite considerable local variation in mesowear values is the most significant exception and requires further consideration.
 Comparisons of mean mesowear values of species in the presence/absence of other ungulate species are shown in Table 4. Most of the species, especially Equus ferus and Bos primigenius, show lower (more attrition-dominated) mesowear values in the presence of mammal species associated with closed environments (Alces alces, Capreolus capreolus and Dama dama) and higher (more abrasion-dominated) values in the presence of species associated with open environments (Bison priscus, Megaloceros giganteus and Coelodonta antiquitatis). However, Cervus elaphus shows an opposite pattern, having significantly more abrasion-dominated mesowear values in the presence of browsers associated with closed environments, especially A. alces (and C. capreolus, although not significantly so). This finding implies that C. elaphus included more grass in its diet when other browse-dominated feeders were present, which could explain the lack of correlation with vegetation patterns in this species (see Discussion).
Body Mass
Mean body masses of each species in the main localities are shown in Appendix 3. We did not find any correlation between body size and mesowear signal across localities in most of the species studied here (Appendix 4). The only statistically significant correlation is the negative correlation between body mass and mesowear in Bison schoetensacki, implying that it had a larger body size when it consumed more browse. The cross-locality correlations of each species’ mean body mass with that of other species, and with environmental NAP percentages, are shown in Table 5 (Appendix 5 for p-values). A general pattern is that some genera (Equus ferus and Bison spp.) show negative correlations of body mass with habitat openness, while others, such as Cervus elaphus, have positive correlation of mean body mass and habitat openness.
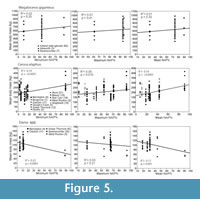 Cervidae. Mean relative body size indices across all cervid species analysed together have significant positive correlation with mean NAP % of localities (R2 = 0.5, p = 0.03), implying that larger individuals and/or species are typical in open environments. However, there are important differences between species. Mean body mass of Cervus elaphus is positively correlated with NAP %, whereas Megaloceros giganteus does not show significant relationship and the pattern for Dama dama appears negative but could be unreliable, as discussed later (Figure 5, Table 5 and Appendix 5). For the other species of deer, intraspecific patterns could not be analysed due to insufficient data from localities with NAP %.
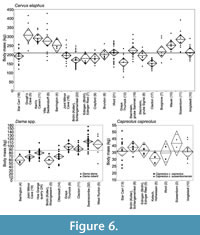
Mean body masses of Cervus elaphus, ranked by locality from oldest (right) to youngest (left), are shown in Figure 6, and pairwise comparisons between localities are shown in Appendix 6. There is spatial and temporal variation, which appears to be connected with environmental variation. In the early Middle Pleistocene of Germany, the population from the relatively open environment of Süssenborn has significantly larger mean body mass than the interglacial population from Voigtstedt and larger mean body mass (though not statistically significant) than the interglacial population from Mauer. The MIS 11 population from Clacton and the MIS 9 population from Grays Thurrock have mean body masses that are significantly below the average for C. elaphus. At Steinheim an der Murr, Germany, C. elaphus from the temperate mammal assemblage of Grube Sigrist (MIS 11) are larger than those of Clacton and Grays, but the deer from the overlying MIS 10 glacial assemblage of Grube Sammet are larger still. The particularly large mean body masses of C. elaphus in the last glacial populations at Villa Seckendorff (considered early Weichselian, possibly MIS 5d-a), Kent’s Cavern (the cave earth fauna, considered MIS 3 in age) and Gough’s Cave (Bølling interstadial) are significantly higher than those of the preceding (last interglacial) and succeeding (Holocene) populations, which are generally associated within more temperate, low NAP environments. The largest mean size of this species occurs at Gough’s Cave, which pertains to a warm interstadial but with open environment. These observations contribute to the positive correlation of mean body mass with NAP % of the localities, indicating that habitat openness is associated with larger size in this species.
 The negative correlation of the mean body mass of Dama dama with the NAP % of localities (Figure 5 and Table 5) is due to the small size of this species in the very high NAP locality of Barrington, England. When Barrington (where the NAP may be locally biased) is excluded from the analyses, any significant correlation is lost (mean NAP %: R2 = 0.13, p = 0.56; min. NAP %: R2 = 0.53, p = 0.17; max. NAP %: R2 = 0.04, p = 0.73). There is a taxonomic difference linked to geological age, however: The stage MIS 11 populations (D. d. clactoniana) have significantly larger mean body mass than the later D. d. dama populations (Appendix 7).
Sample sizes of Capreolus sp. are small and no reliable analysis of the correlation of body mass with environmental proxies could be made. Two specimens from the MIS 16 cool-climate assemblage of Süssenborn are relatively large, but sample sizes are too small for conclusive comparison with the other populations (Figure 6). There is little statistical significance in the spatial and temporal body size variation of this species (Appendix 8).
There is no significant relationship of body mass with vegetation openness in Megaloceros giganteus (Figure 5), but it does have slightly larger mean body masses in the probably more open environments of Isleworth and late glacial Ireland than at Swanscombe (Figure 7). More significantly, continental animals appear to be larger than those of the British Isles: the MIS 11 interglacial population from Swanscombe, of comparable age to Steinheim, has a relatively small mean body mass for M. giganteus (Lister, 1986, 1994), while German last-glacial samples show larger mean sizes than those of Britain and Ireland (Figure 7). These differences are statistically significant (Appendix 9).
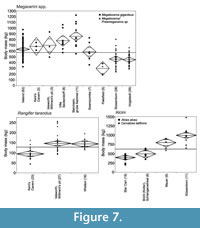 Rangifer tarandus has similar mean body mass in the early Devensian glacial (MIS 5a-d) localities of Isleworth and Wretton, and a significantly smaller mean body mass in the middle Devensian glacial (MIS 3) locality of Kent’s Cavern (Figure 7, see Appendix 10 for pairwise Wilcoxon test comparisons).
There are insufficient data to show any correlation of Alces alces body size with environmental openness. As is well known (e.g., Lister, 1993), the Late Pleistocene and Holocene Alces alces is significantly smaller than its Middle Pleistocene relative Cervalces latifrons (Figure 7, Appendix 11). In the early Middle Pleistocene of Germany, Cervalces latifrons had a significantly larger mean body mass in the apparently more open, probably MIS 16 locality of Süssenborn than in the MIS 15 interglacial locality of Mauer.
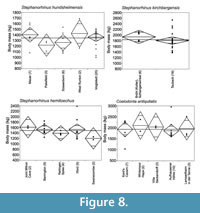 Rhinocerotidae. The body mass of the four rhino species, Stephanorhinus hundsheimensis, S. kirchbergensis, S. hemitoechus and Coelodonta antiquitatis, is shown in Figure 8. There are no significant intraspecific differences in the mean body mass of populations of these species (Appendix 12, Appendix 13, Appendix 14). Because of this, and the shortage of environmental proxy data from the localities, intraspecific connections of body mass and environmental proxies did not yield any conclusive results. Mainly because of the larger size of the open-adapted C. antiquitatis than Stephanorhinus spp., the Rhinocerotidae as a whole show statistically significant positive correlation of mean body mass with mean NAP % of the localities (R2 = 0.52, p = 0.03).
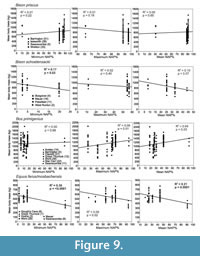 Bovidae, Bovini. The large bovids do not show any clear pattern of body mass in relation to vegetation openness of the localities. Bison priscus and Bos primigenius do not show significant correlation of mean body mass with the NAP % of the localities. Bison schoetensacki, however, shows a negative correlation, although is significant for minimum NAP % only (Figure 9 and Table 5).
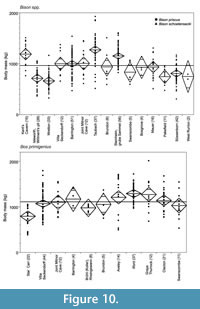 Body mass of Bison priscus and B. schoetensacki in Middle and Late Pleistocene localities from Britain and Germany, ranked from oldest (right) to youngest (left) are shown in Figure 10. There is considerable variation in the body mass of Bison between populations. The earliest populations analysed here (Bison schoetensacki), from West Runton (MIS 17), Süssenborn (? MIS 16) and Pakefield (? MIS 15), have slightly but not significantly smaller mean body mass than the average of all the populations. The Bison priscus populations from Steinheim an der Murr (Grube Sammet, MIS 10), Taubach (MIS 5e) and Kent’s Cavern (MIS 3) have significantly larger than average mean body masses, whereas the two early Devensian (MIS 5a-d) British populations, from Wretton and Isleworth, have significantly smaller than average mean body masses (Appendix 15).
Bos primigenius has relatively similar mean body mass through the record, without any obvious pattern in relation to environmental conditions (Figure 9-Figure 10). The only significant difference is between the largest mean body masses in some of the Middle Pleistocene localities (Grays Thurrock and Ilford) and the smallest, in the Early Holocene population from Star Carr (Appendix 16).
 Equidae. The horse data are concentrated on the Middle and Late Pleistocene caballine horses, primarily the wild horse Equus ferus. They show significant negative correlation of mean body mass with minimum and mean NAP % of localities (Figure 9, Table 5). However, the negative correlation is mostly caused by the small size of this species in the open environment of Gough’s Cave, so the pattern should be interpreted with caution.
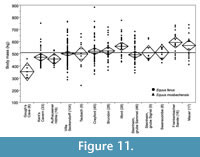
Significantly larger than average mean body mass of E. ferus occurs in the interglacial locality of Ilford (MIS 7), but most of the interglacial assemblages show remarkably consistent mean body masses (Figure 11, Appendix 17). Significantly smaller than average body mass of E. ferus occurs at Steinheim an der Murr (Grube Sammet, MIS 10), Aufhausener Höhle (last glacial), Kent’s Cavern (MIS 3) and especially Gough’s Cave (MIS 2) (Appendix 17). All these localities are correlated with glacial stages, and their faunas indicate open environmental conditions. These findings give support to the negative correlation between the mean body mass of E. ferus and NAP percentages, indicating that the species was on average smaller in open than in closed environments.
DISCUSSION
The results indicate that the diets of local ungulate faunas reflect their environments: the average mesowear signal of the whole ungulate faunas is positively correlated with NAP % of the localities. When ungulate species are studied separately, it is evident that there are significant differences in the correlations between habitat, diet and body size of different species. This is likely to reflect basic differences in the ecological strategies and physiology of the species as well as competition effects between them.
Diet and Habitat
Community-level correlations. Mean mesowear signal of complete ungulate communities shows remarkably high and significant positive correlation with minimum, maximum and mean non-arboreal (NAP) pollen percentages recorded from the mammal bearing sediments or at least closely associated strata from the Middle and Late Pleistocene localities studied here. This would suggest that the result is not overly affected by the accuracy of the stratigraphical association of the mammal and pollen samples, possibly because both are almost always somewhat time-averaged. In reality, the correlations may be even stronger, because of biases in the mesowear signal of some communities. For example, Barrington shows anomalously high NAP % compared to other contemporaneous localities, which is higher than would be expected from the mean mesowear signal of the ungulates and may be partly due to bias in the pollen assemblage itself (see above), but Hippopotamus amphibius could not be included in the mesowear data (see above), and as a grazer it would be likely to affect the total dietary signal significantly. We suggest that studies attempting to reconstruct palaeoenvironmental conditions from mesowear signal of ungulates should ideally be based on as complete ungulate communities as possible. Even better would be to extend the analysis to all herbivorous mammals. This is underlined by the different mesowear patterns of different species, so that the mesowear of a single species is likely to misrepresent the overall community signal. Species differences in the correlation of mesowear signal and vegetation openness are clearly related to different ecological strategies. For example, the reindeer (Rangifer tarandus) is absent from low NAP localities which indicate a closed forest environment, yet it has low mean mesowear value, and together these indicate specialised open-habitat browsing diet.
Family-level correlations. At family-level, Cervidae, Rhinocerotidae and Bovidae ( Bos and Bison) show significant positive correlations of mesowear with the NAP percentages of the localities. These correlations manifest themselves at the level of both taxic composition of the assemblage, and for some species, intra-species flexibility. Equidae as a family (Equus ferus, E. mosbachensis , E. suessenbornensis and E. altidens), however, does not show such correlations. This indicates that Pleistocene palaeoenvironmental inferences could to a certain degree be made from the tooth wear signal of cervids, bovids or especially rhinos, but not from equids alone.
Species-level correlations. Equine horses are highly adapted to grazing, and the key to their success may well be their ability to avoid competition with other ungulates by selecting the most abrasive and digestively challenging plants (grasses) in a variety of environments (Janis et al., 1994). Observations of extant feral horses and cattle in Europe have shown that horses tend to select highly productive low-growing grasses, whereas cattle include more browse, such as shrubs and forbs, in their diet (Menard et al., 2002). It is therefore remarkable that the Middle and Late Pleistocene wild horse, Equus ferus, occurs in a wide range of environments, from relatively low NAP % (e.g., Grays Thurrock) to very high NAP % (e.g., Gough’s Cave). There is also some local variation in its always strongly abrasion-dominated mesowear signal, indicating a small browse component at some localities, which is positively (but not significantly so) related to NAP%. These findings indicate that Equus ferus was an ecologically flexible species of equid which was able to thrive in various environments despite its general adaptation to grazing and usually very abrasion-dominated mesowear signal. The remarkable recent discovery of browse-dominated feeding in a Middle Pleistocene horse population from Schöningen, Germany (Rivals et al., 2015b) supports this conclusion, although in the light of the data presented here it must be considered exceptional. Nonetheless, this discovery further indicates that Pleistocene horses were more variable in their habitat and feeding than has usually been expected from their ecomorphological adaptations to grazing.
Bison priscus, which occurs mostly in open environments but some more closed ones as well, has much more variation in mean mesowear values than Bos primigenius or Bison schoetensacki, both of which are associated predominately with closed environments (Table 2, mesowear SD and NAP%). Nonetheless, both species of bison show significant positive correlation of mesowear signal and NAP%, whereas Bos primigenius does not. This indicates that bison were more flexible than Bos primigenius in their diets, shifting to more abrasive diets in open environments, and B. priscus was also more catholic in its choice of habitat. Bos primigenius has both a limited environmental range and a very similar mesowear signal in all localities, indicating a quite stable mixed-feeding dietary preference. This finding is in agreement with earlier studies that suggest, based on pollen, insects, historical descriptions and landscape analysis, that B. primigenius mostly utilised particular kinds of marshy woodland environments (such as sedge marshes in riverine floodplains), which would have provided relatively constant resources (van Vuure, 2005; Hall, 2008).
The mixed-feeding species Stephanorhinushundsheimensis shows significant correlations of mean mesowear to NAP%, but S. hemitoechus does not. The lack of correlation in S. hemitoechus is largely driven by its very abrasion-dominated mean mesowear value in Swanscombe. However, the validity of the Swanscombe pollen record has been challenged (Turner, 1985), so this result should be interpreted with caution. For the browser S. kirchbergensis and the grazer Coelodonta antiquitatis the correlation of mesowear and vegetation could unfortunately not be analysed because of the shortage of associated pollen data. S. kirchbergensis shows marginally, but not significantly, more abrasive mesowear signal in the more open environment of Ilford than in the closed environment of Grays Thurrock. Van Asperen and Kahlke (2015) analysed the mesowear signals of rhinoceroses of the genus Stephanorhinus from Britain and Germany, and concluded that all the species were mostly flexible mixed-feeders and only S. hundsheimensis from Voigtstedt was a browser. Our results largely support this but indicate more browse-dominated diets for S. kirchbergensis. In this respect our results are closer to those of Hernesniemi et al. (2011). The woolly rhino ( C. antiquitatis) shows surprisingly low mean mesowear value in the German last glacial locality of Aufhausener Höhle, indicating browse-dominated mixed-feeding, which differs drastically from the usual abrasion-dominated, grazing mesowear signal of this species. This could indicate an atypical environment and potentially sub-optimal feeding opportunities for the species, such as browsing on herbs or even forest vegetation, but unfortunately this cannot be investigated because pollen data is lacking from this locality.
Alces alces, Capreolus capreolus and Rangifer tarandus have on average very attrition-dominated mesowear values and little variation, which indicates specialized browsing diets, as in their extant populations (e.g., Geist, 1998; Latham, 1999). Alces alces and Capreolus capreolus have very low mean mesowear values, corresponding to specialist browsers, as in their extant populations. The values show very little variation between localities, but sample sizes are too small for statistical robustness. Rangifer tarandus tends to be an open-landscape browser (Geist, 1998), and this is well recorded by the low mesowear values but high environmental NAP for this species in our data. Dama dama and Cervus elaphus have on average higher and more variable mesowear values indicating browse-dominated mixed-feeding, as in their extant populations (e.g., Geist, 1998; Gebert and Verheyden-Tixier, 2001). There are intriguing differences in the correlation of mesowear and NAP between the species of Cervidae.The abundant and ecologically flexible Cervus elaphus does not show significant correlation of mesowear and NAP of the localities, especially because of its very attrition-dominated mesowear signal in the relatively closed environment of Star Carr. The mesowear signal of Megaloceros giganteus has only two data points, but Megacerini as a whole shows one of the best correlations in this study. Dama dama shows positive relation between mesowear signal and NAP percentages, although the sample sizes are so low that this result must be considered highly tentative.
In sum, although some species do show dietary variation in keeping with environmental vegetation, correlations between mesowear and vegetation openness are likely to be more pronounced across the larger taxonomic groupings because of the varied feeding specializations among the species.
Competition effects. It is likely that competition with other species does affect the diets of at least the ecologically more flexible ungulate species. This can be investigated by examining dietary (mesowear) variation of a species in comparison with the presence or absence of potential competitor species (Table 4). Most of the ungulate species, most significantly Equus ferus and Bos primigenius, have mesowear values indicating a larger component of browse in their diet in the presence of species associated with closed environments (mostly browsers such as Alces alces and Capreolus capreolus), than in the presence of species associated with open environments (such as Bison priscus, Megaloceros giganteus and Coelodonta antiquitatis), which reflects the relationship between diet and vegetational environment rather than any effect of competitive displacement. However, Cervus elaphus, the only species which does not show even tentative correlation of mesowear signal and NAP percentages, shows significantly more attrition-dominated mesowear values at localities where forest-adapted browsers, especially Alces, and less signigficantly Capreolus, are present than where they are absent. This probably indicates resource competition, which could have driven the ecologically flexible C. elaphus to utilize more abrasive plants than when competing browsers are absent. Several observations support this interpretation. Gebert and Verheyden-Tixier (2001) suggest, based on dietary analysis of extant C. elaphus populations in Europe, that the roe deer (Capreolus capreolus) is the most important potential competitor of C. elaphus. The mean mesowear value of C. elaphus is remarkably high in the localities where Capreolus is present (Süssenborn, West Runton, Taubach, Grays Thurrock and Star Carr). The large and well sampled population of C. elaphus from the Early Holocene locality of Star Carr shows the most abrasive mesowear signal of this species, whereas the other species of deer, Alces alces and C. capreolus, show totally attrition dominated mesowear signals. Alces is absent from almost all other studied localities, and Capreolus is rare in most of the Pleistocene localities. Star Carr is therefore an intriguing case where competition over food resources could have driven the dietarily more flexible Cervus elaphus to utilize more of the abrasive plants like grasses and sedges along the lakeshore environment.
Body Size and Synthesis
Differences in mean body mass of ungulate species beween localities, and their correlations with NAP percentages, indicate that vegetation structure, resource availability and interspecific relationships all affected the body size patterns. However, in some cases the analyses did not provide statistically robust results, due to the sometimes very restricted sample sizes (in roe deer and the rhinoceroses in particular).
Among the deer (Cervidae), Cervus elaphus shows positive correlation of body mass with NAP of localities. This trend appears not to be correlated to diet, as there is no significant relationship between mesowear signal and either body size or NAP in this species, even though the species shows considerable dietary flexibility across localities (see above). Nor does it appear to be driven by temperature, as C. elaphus of large size occurs not only in cold, but also in open but warm, contexts (corroborated by Commmonality Analysis in Lister et al., in prep.). The best example of this is Gough’s Cave, dated to the warmest part of the Bølling interstadial (GI-1e) (Jacobi and Higham, 2009), where palynological investigations indicate a very open environment (mean NAP % = 92). The mean body mass of C. elaphus from Gough’s Cave is significantly larger than in any other locality analysed here. This suggests that although deer tend to be larger in “glacial” localities, this is not because of the benefits of larger size for maintaining body temperature in colder climates, but because of the benefits of large size in open habitats. This finding supports results from earlier studies. For example, in a study of MIS 11 red deer, Lister (1996) found small body sizes at Clacton, and also at Swanscombe, but the population from Hoxne, probably from a later, less forested phase of MIS 11 (Ashton et al., 2008), was of more typical size. Langvatn and Albon (1986) showed that there is negative correlation of body size with temperature and precipitation in the extant populations of C. elaphus in Norway (i.e., following “Bergmann’s Rule”), but they suggest this is not because of physiological benefits in heat conservation, but rather because of the positive effect of decrease in temperature and precipitation on nutritional quality and digestibility of plants in that region. The large size of C. elaphus in open environments of the Pleistocene may have been enabled by seasonally high productivity, providing plenty of good quality food for herbivores because of fertile soils produced by glacial erosion and reduced defence mechanisms of the plants (see e.g., Zimov et al., 1995; Geist, 1998). There are many suggested benefits of large size in open environments, such as energy-efficient locomotion over large distances, improved ability to escape predators and benefits of large size for reproductive success in larger groups (Peters, 1983; Geist, 1971).
Our results on body size variation in Megaloceros giganteus correspond well with those of Lister (1994), whose data came largely from the same localities. There is no significant correlation with NAP, but the smallest mean size of this species occurred at Swanscombe, which had more closed vegetation than the other Megaloceros localities analysed here. However, the differences in mean size between localities are small, and the validity of the pollen record from Swanscombe has been challenged (Turner, 1985). Other populations from Middle and Late Pleistocene Britain are similar in size to each other, including the late-glacial (Allerød interstadial) population from Ireland. Samples from Germany are noticeably larger but we lack sufficient environmental proxy data to interpret this. To summarise the evidence, M. giganteus occupied various environments from relatively closed (e.g., Grays Thurrock) to very open (Irish Late Glacial sites), was slightly but not significantly larger in more open environments and had a mixed-feeding diet with more abrasive plant material (grass) in open than in closed environments. Like Cervus elaphus, therefore, it follows the prediction of large size being advantageous in open environments, but unlike C. elaphus it also clearly follows the prediction of a more abrasion-dominated (grazing) diet in open environments. The size variation, however, does not appear to be determined by diet per se.
The lack of consistent body mass-NAP correlation for Dama dama could simply reflect the fact that it only occurs in warm, relatively wooded (low NAP) environments. Instead, there is a temporal trend in Dama dama, with larger body size in the MIS 11 and MIS 9 population of Swanscombe, Clacton and Grays than in the MIS 5e populations of Brühl (Koller), Hoe Grange Quarry, Barrington and Joint Mitnor Cave, reflecting the transition from the larger D. d. clactoniana to the smaller D. d. dama (Lister, 1986). To summarise, D. dama occupied various, but always at least partly wooded, environments during the warm stages of the Pleistocene, and does not show any clear connection between body size and environment or diet, but it did have a more abrasion-dominated diet in more open environments, similar to Megaloceros.
The rhinoceroses show little intraspecific variation in mean body mass between the localities. For some species this is probably due to adaptation to particular kinds of environments where the conditions were roughly similar. The browser Stephanorhinus kirchbergensis is mostly associated with closed environments, whereas the specialized grazer Coelodonta antiquitatis is associated with open environments and is absent from forested (low NAP) localities. The ecologically more flexible species S. hundsheimensis and especially S. hemitoechus, which had mixed-feeding diets and more variable habitats (wider range of NAP %), show somewhat more variation in body size, but still there are no significant differences between localities. The open-adapted C. antiquitatis is the largest species but the closed-adapted S. kirchbergensis is almost as big, so even interspecifically a connection of body size and environmental conditions is elusive in the Rhinocerotidae. Lacombat (2006) suggested that climatic variations played a significant role in the body size variation in Mediterranean and French Pleistocene rhinoceroses, especially Stephanorhinus hemitoechus. However, he also notes a temporal trend of increasing size in most of the rhinoceros species (Lacombat, 2006, 2009), and the variation superimposed on those size trends does not seem to closely correspond with climatic fluctuations. In our data the mean body mass of Stephanorhinus hemitoechus is larger in the MIS 5e locality of Joint Mitnor Cave than in the MIS 11 locality of Swanscombe, but the sample sizes are small, and the difference is not statistically significant.
Bison priscus does not show significant correlation of mean body mass with NAP, but B. schoetensacki shows a negative correlation only with minimum NAP %, providing some indication of larger size in the most densely forested environments. It is also the only species that shows a correlation of body size with mesowear, indicating that it was larger when it consumed more browse. However, because both mesowear and NAP are negatively correlated with size in this species, this would suggest that it was larger in more closed environments where it ate more browse, rather than indicating that browsing diet as such enabled the species to grow larger.
The remarkably small-sized Bison priscus from the Early Devensian of Wretton (Norfolk) and Isleworth (Thames basin) are interesting because while both are open habitats, the Isleworth remains are considered to come from a temperate episode (Kerney et al., 1982) and the Wretton ones from a cooler one (West et al., 1974), again suggesting that temperature is not the deciding factor in determining body size. Among last-glacial samples, the smaller body size of Bison in the flat, open habitats of these localities than at Kent’s Cavern (Devon) potentially fits this pattern, since its hilly, possibly partly wooded environment could have imposed different selective pressures. In summary, smaller body size appears likely to be associated with open environments in Bison.
Bos primigenius shows a relatively small size in the Early Holocene population of Star Carr compared with Pleistocene populations of that species. This finding remains unexplained in our analyses.
The caballine horses (Equus ferus sensu lato) are significantly smaller in high NAP localities, although not necessarily in colder climates. The smallest body size occurs in the open but warm environment of Gough’s Cave. The tendency of horses to have relatively small body size in steppe-like, open vegetated environments during the Pleistocene has been noted by several authors. Sickenberg (1962) noted that the large forms were connected with warm climatic phases and the small forms with cold phases, which contradicts any assumption of thermoregulation based on ‘Bergmann’s rule’. In addition, several authors (Forstén, 1991; Forstén, 1993; Alberdi et al., 1995; Guthrie 2003) have noted a generally decreasing size trend in Eurasian Equus through the Late Pleistocene. Guthrie (2003) suggested the Pleistocene-Holocene climatic warming to be the cause of the size decrease, but as Forstén (1993) notes, the diminishing trend in the body size of the caballine horses started long before the beginning of Holocene, with small-sized animals in cold and open environmental conditions during the glacial phases of the Late Pleistocene. Moreover, horses from previous cold stages (such as MIS 6) have been noted to be small in size (Bates et al., 2000; van Asperen, 2010). Correlation of small body size with open environments seems to be a more general phenomenon among horses, as it can be observed in Miocene equids, especially hipparionines, as well (Saarinen, 2009).
In the Pleistocene, E. ferus ranged from temperate localities with largely forested vegetation (e.g., Grays Thurrock) to open but warm environments (e.g., Gough’s Cave) and cold environments (e.g., Kent’s Cavern). Nonetheless, the dietary signal of E. ferus has low variation and indicates mostly very abrasion-dominated (grazing) diets, which would suggest that even in partly closed environments it usually inhabited its preferred, open habitat patches. Therefore the area occupied by this species (and presumably total population size) was smaller in more closed environments. Higher population densities, possibly related to larger group sizes (e.g., Khan et al., 1996; Borkowski, 2000) in open environments may have selected for reduced body size of E. ferus, because resources available for an individual were limited by intraspecific competition. We suggest that this combination of open-adaptedness and gregarious behaviour leading to large population densities in favourable conditions (open environments), is the most plausible explanation for the observed body size pattern of horses. Similar factors may explain the reduced body size observed in Bison in this study.
Van Asperen (2010) made a thorough analysis of variation in body size and proportions of European caballine horses from Middle to Late Pleistocene. Middle Pleistocene interglacial horses were found to be large and occurring in relatively closed, high-productivity environments, which would be in concert with our interpretation. The particularly small size of the glacial horses was noted in that study as well, but low productivity of those environments rather than high population density was suggested to be the explanation. However, the “mammoth steppes” of the cold stages were, at least seasonally, high productivity environments and able to sustain diverse assemblages of large-sized mammals, many with prominent luxury organs (Zimov, 1995; Geist, 1998). Moreover, as we demonstrate, other species, such as Cervus elaphus, were particularly large in those environments, which does not support the interpretation of low productivity. Some interglacial horse populations, such as those from Swanscombe and Steinheim, have been suggested to comprise small and slender animals because of warm climate and forested vegetation (Forsten, 1999; Van Asperen, 2010, 2013). However, despite the slightly smaller size, we did not find significant differences in the mean body mass estimates in these horse populations compared to other interglacial populations, such as the one with a large mean body size from Ilford. Instead, the horses from open, glacial enviroments are significantly smaller than the ones from interglacial assemblages. We therefore suggest as an alternative explanation that the small sizes of the horses in open environments could be due to the limiting effect of large group sizes (high density) and increased intraspecific competition.
Resource availability, often limited by high population density, has been shown to be the major driver behind body size variation in several extant mammal species, such as reindeer (Skogland, 1983), feral donkeys (Choquenot, 1991) and roe deer (Toïgo et al., 2006). Wolverton et al. (2009) were able to show that there is a negative correlation between individual body size and population density in the extant white-tailed deer (Odocoileus virginianus) in North America, and that body size variation in that species is better explained by geographic differences in food availability than by thermoregulatory benefits suggested by “Bergmann’s Rule”. The effect of population density on individual body size is most evident in gregarious species which form large herds in open environments. Studies of modern reindeer populations (Rangifer tarandus) are a good example. Skogland (1983) noted that average body size in local Norwegian reindeer populations (with population sizes ranging from 500 to 26 000 individuals in areas ranging from 445 to 8000 km2) was negatively correlated with population density. In Finland, forest reindeer (R. t. fennicus) have on average a larger body size than wild and semi-domestic tundra reindeer ( R. t. tarandus) from Lapland (Nieminen and Helle, 1980). Of these subspecies, the tundra reindeer, which inhabits open environments, is more gregarious and regularly forms groups of up to several hundred individuals, whereas the forest reindeer lives most of the year in small groups of 2 to 20 animals (Rankama and Ukkonen, 2001). High population density and low lichen availability cause increased tooth wear rates and smaller body size in reindeer (Kojola et al., 1998). A similar case is the extant North American bison (Bison bison). According to Meagher (1986) the woodland subspecies (B. b. athabascae) is on average larger and moves in smaller groups than the plains subspecies (B. b. bison) which tends to form larger herds (probably increasing population density and intraspecific resource competition [see Khan et al., 1996; Borkowski, 2000]). Moreover, tests on the North American wapiti (Cervus elaphus canadensis) have shown that in a controlled situation where two populations, one with high density and one with low density, were compared yearly between 1998 and 2001, mean body mass was always reduced in the high-density population (Stewart et al., 2005).
In our study bison, like horses, tend to have smaller body sizes in open environments, which conforms to the hypothesis of reduced size because of large group size and density, as in modern North American bison (Meagher, 1986). However, the larger body size in the Early Devensian British reindeer (Rangifertarandus) compared with that of the MIS 3 population from Kent’s Cavern is exactly opposite to the pattern in bison. This suggests that other factors are influencing body size in this species, but this cannot be explored further with our dataset because of the shortage of localities with data and the absence of reliable pollen from Kent’s Cavern. Other species, which in contrast to horses and bison, have larger size in open environments (most notably Cervus elaphus), must also have been influenced by other selective pressures; they probably retained retained significantly smaller group sizes and population densities under open conditions, so that food limitation due to intraspecific competition was less likely the determining factor.
Finally, in all of the species for which the correlation of body size and NAP could be analysed, the significant correlations of mean body mass are with minimum or, in the case of C. elaphus, with mean NAP % of the localities. This would suggest that a transition from moderate to high tree cover (low to moderate NAP cover) has stronger selective force on body size than a transition from low to moderate tree cover (moderate to high NAP cover). For species that are significantly larger in open environments (e.g., Megaloceros giganteus and Cervus elaphus) this would mean that the spread of dense forest vegetation would have favoured a smaller and more compact body size, as suggested by Bro-Jørgensen (2008) on grounds of maneuverability and Geist (1974) on grounds of reduced group size and inter-male competition. Conversely, it implies that for the gregarious species that tend to be smaller in open environments (especially Equus ferus), even moderate closing of the open environment reduces group size and hence intraspecific competition, leading to a larger body size.
CONCLUSIONS
The mesowear (dietary) signals of the most abundant ungulate species in the Middle and Late Pleistocene of Western Europe indicate habitat and dietary adaptations. Overall, there is a positive correlation between local vegetation and diet, both for ungulate assemblages as a whole, and their constituent species. The response of mesowear signal to habitat openness, however, varies considerably between the species, reflecting different ecological strategies and probably also competition relationships between the species.
Our data show different, species-specific patterns of body size response to environmental conditions. Population densities and social structures, together with vegetation and climate, affect the resource availability for each individual of a species, and are thus likely to be the key factors contributing to the different body mass patterns seen across the ungulate groups. We did not, however, find evidence that dietary shifts in accordance with environment have a direct effect on body size.
In some cases, most clearly shown by red deer, larger size is seen in open vegetated environments, which we suggest is not based on physiological benefits for heat conservation, but rather on other ecological factors, primarily the ecological benefits of larger size in open habitats.
Horses, conversely, are smaller at more open sites, and this, to some extent, is true of Bison as well. Both horse and bison are grazing-adapted herbivores with the tendency to occur in large numbers in open environments. We suggest the main factor driving their body mass smaller in open environments is high population density and gregarious behaviour, leading to increased intraspecific resource competition.
ACKNOWLEDGEMENTS
The fossil mammal specimens analysed in this study are housed in the Natural History Museum of London, Torquay Museum, the Sedgwick Museum of Cambridge, University Museum of Zoology (Cambridge), British Geological Survey (Nottingham), Ipswich Museum, Staatliches Museum für Naturkunde in Stuttgart, Staatliches Museum für Naturkunde in Karlsruhe and the Research Station of Quaternary Palaeontology, Senckenberg institute (Weimar). We owe specific thanks to the curators and museum assistants A. Currant and P. Brewer (NHM, London), R. Ziegler (SMN Stuttgart), B. Chandler and C. Jones (Torquay Museum), D. Schreiber (SMN Karlsruhe), A. Ainsworth (Ipswich Museum), M. Lowe (Zoology Museum, Cambridge), M. Riley (Sedgwick, Cambridge), L. Neep and P. Shepherd (British Geological Survey), and R. Kahlke (Research Station of Quaternary Palaeontology, Weimar) for access to, and guidance with, the collections. This work has been funded by the Finnish Graduate School of Geology, Osk. Huttunen Foundation, and Jenny and Antti Wihuri Foundation. Travel grant for a museum visit to England was granted by Nordenskiöld-Samfundet.
REFERENCES
Adam, K.D. 1954. Die mittelpleistozänen Faunen von Steinheim an der Murr (Würtemberg). Quaternaria, 1:131-144.
Alberdi, M.T., Prado, J.L., and Ortiz-Jaureguizar, E. 1995. Patterns of body size changes in fossil and living Equini (Perissodactyla). Biological Journal of the Linnean Society, 54:349-370.
Arnold-Bemrose, H.H. and Newton, E.T. 1905. On an ossiferous cavern of Pleistocene age at Hoe-Grange Quarry, Longcliffe, near Brassington (Derbyshire). Quarterly Journal of the Geological Society, 61:43-57.
Arsenault, R. and Owen-Smith, N. 2002. Facilitation versus competition in grazing herbivore assemblages. Oikos, 97:313-318.
Ashton, N., Lewis, S.G., Parfitt, S.A., Penkman, K.E.H., and Coope, G.R. 2008. New evidence for complex climate change in MIS 11 from Hoxne, Suffolk, UK. Quaternary Science Reviews, 27:652-668.
Ashton, N.M., Lewis, S.G., and Stringer, C.B. 2011. Ancient human occupation of Britain.Developments in Quaternary Science 14, Elsevier, Amsterdam, the Netherlands.
Bates, M.R., Bates, C.R., Gibbard, P.L., Macphail, R.I., Owen, F.J., Parfitt, S.A., and Preece, R.C. Bates, MR; Bates, CR; Gibbard, PL; Macphail, RI; Owen, FJ; Parfitt, SA; Preece, RC; Roberts, MB; Robinson, JE; Whittaker, JE; Wilkinson, KN 2000. Late Middle Pleistocene deposits at Norton Farm on the West Sussex coastal plain, southern England. Journal of Quaternary Science, 15:61-89.
Bates, M.R., Champness, C., Haggart, A., Macphail, R.I., Parfitt, S.A.. and Schwenninger, J.-L. 2014. Early Devensian sediments and palaeoenvironmental evidence from the excavations at the Royal Oak Portal Paddington, West London, UK. Proceedings of the Geologists’ Association, 125:41-55.
Bergmann, C. 1847. Über die Verhältnisse der Wärmeökonomie der Tiere zu ihrer Grösse. Gottinger Studien, 3:595-708.
Bocherens, H. and Fogel, M.L. 1995. Trophic structure and climatic information from isotopicsignatures in Pleistocene cave fauna of Southern England. Journal of Archaeological Science, 22:327-340.
Borkowski, J. 2000. Influence of the density of a sika deer population on activity, habitat use, and groups size. Canadian Journal of Zoology, 78:1369-1374.
Breda, M., Collinge, S.E., Parfitt, S.A., and Lister, A.M. 2010. Metric analysis of ungulate mammals in the early Middle Pleistocene of Britain, in relation to taxonomy and biostratigraphy I: Rhinocerotidae and Bovidae. Quaternary International, 228:136-156.
Bridgland, D.R., Field, M.H., Holmes, J.A., McNabb, J., Preece, R.C., Selby, I., Wymer, J.J., Boreham, S., Irving, B.G., Parfitt, S.A., and Stuart, A.J. 1999. Middle Pleistocene interglacial Thames-Medway deposits at Clacton-on-Sea, England: Reconsideration of the biostratigraphical and environmental context of the type Clactonian Palaeolithic industry. Quaternary Science Reviews, 18:109-146.
Bro-Jørgensen, J. 2008. Dense habitats selecting for small body size: a comparative study on bovids. Oikos, 117:729-737.
Brunnacker, K., Jäger, K.D., Henning, G.J., Preuss, J., and Grün, R. 1983. Radiometrische Untersuchungen zur Datierung mitteleuropäischer Travertinvorkommen. Ethnographisch-Archäologisch Zeitschrift, 24:217-266.
Choquenot, D. 1991. Density-dependent growth, body condition, and demography in feral donkeys: testing the food hypothesis. Ecology, 72:805-813.
Clark, J.G.D. 1954. Excavations at Star Carr - an Early Mesolithic Site at Seamer near Scarborough, Yorkshire. Cambridge University Press, Cambridge.
Clauss, M., Franz-Odendaal, T.A., Brasch, J., Castell, J.C., and Kaiser, T. 2007. Tooth wear in captive giraffes ( Giraffa camelopardalis): mesowear analysis classifies free-ranging specimens as browsers but captive ones as grazers. Journal of Zoo and Wildlife Medicine, 38:433-445.
Clauss, M., Frey, R., Kiefer, B., Lechner-Doll, M., Loehlein, W., Polster, C., Rössner, G.E., and Streich, W.J. 2003. The maximum attainable body size of herbivorous mammals: morphophysiological constraints on foregut, and adaptations of hindgut fermenters. Oecologia, 136:14-27.
Conway, B. 1996. The stratigraphy and chronology of the Pleistocene deposits of Barnfield Pit, Swanscombe. Occasional Paper - British Museum, 94:117-136.
Croft, D.A. and Weinstein, D. 2008. The first application of the mesowear method to endemic South American ungulates (Notoungulata). Palaeogeography, Palaeoclimatology, Palaeoecology, 269:103-114.
Currant, A. and Jacobi, R. 2001. A formal mammalian biostratigraphy for the Late Pleistocene of Britain. Quaternary Science Reviews, 20:1707-1716.
Damuth, J. 2007. A macroevolutionary explanation for energy equivalence in the scaling of body size and population density. American Naturalist, 169:621-631.
Damuth, J. and MacFadden, B.J. 1990. Body Size in Mammalian Paleobiology - Estimation and Biological Implications. Cambridge University Press, New York.
DeMiguel, D., Fortelius, M., Azanza, B., and Morales, J. 2008. Ancestral feeding state of ruminants reconsidered: earliest grazing adaptation claims a mixed condition for Cervidae. BMC Evolutionary Biology, 8:1-13.
Diedrich, C.G. and Rathgeber, T. 2012. Late Pleistocene steppe lion Panthera leo spelaea (Goldfuss 1810) skeleton remains of the Upper Rhine Valley (SW Germany) and contributions to their sexual dimorphism, taphonomy and habitus. Historical Biology, 24:1-28.
Erd, K. 1970. Pollen-analytical classification of the Middle Pleistocene in the German Democratic Republic. Palaeogeography, Palaeoclimatology, Palaeoecology, 8:129-145.
Field, M.H. and Peglar, S.M. 2010. A palaeobotanical investigation of the sediments from the West Runton mammoth site. Quaternary International, 228:38-45.
Forstén, A. 1991. Size decrease in Pleistocene-Holocene true or caballoid horses of Europe. Mammalia, 55:408-419.
Forstén, A. 1993. Size decrease in Late Pleistocene-Holocene caballoid horses (genus Equus ), intra- or interspecific evolution? A discussion of alternatives. Quaternary International, 19:71-75.
Forstén, A. 1999. The horses (genus Equus) from the Middle Pleistocene of Steinheim, Germany, p. 147-154. In Haynes, G., Klimowicz, J., and Reumer, J.W.F. (eds.), Mammoths and the Mammoth Fauna: Studies of an Extinct Ecosystem, DEINSEA, 6. Natuurhistorisch Museum Rotterdam, Rotterdam.
Fortelius, M. and Kappelman, J. 1993. The largest land mammal ever imagined. Zoological Journal of the Linnean Society, 107:85-101.
Fortelius, M. and Solounias, N. 2000. Functional characterization of ungulate molars using the abrasion-attrition wear gradient: a new method for reconstructing paleodiets. American Museum Novitates, 3301:1-36.
Gebert, C. and Verheyden-Tixier, H. 2001. Variation of diet composition of red deer (Cervus elaphus L.) in Europe. Mammal Review, 31:189-201.
Geist, V. 1971. The relation of social evolution and dispersal in ungulates during the Pleistocene, with emphasis on Old World deer and the genus Bison. Quaternary Research, 1:285-315.
Geist, V. 1987. Bergmann’s rule is invalid. Canadian Journal of Zoology, 65:1035-1038.
Geist, V. 1998. Deer of the World - Their Evolution, Behaviour, and Ecology. Stackpole Books, Mechanicsburg, Pennsylvania.
Gibbard, P.L. 1994. Pleistocene History of the Lower Thames Valley. Cambridge University Press, Cambridge.
Gibbard, P.L. and Stuart, A.J. 1975. Flora and vertebrate fauna of the Barrington beds. Geological Magazine, 112:493-501.
Gillooly, J.F., Charnow, E.L., West, G.B., Savage, V.M., and Brown, J.M. 2002. Effects of size and temperature on developmental time. Nature, 417:70-73.
Gordon, I.J. and Prins, H.H.T. 2008. The ecology of browsing and grazing. Ecological Studies 195. Springer, Berlin.
Guthrie, R.D. 1990. Frozen Fauna of the Mammoth Steppe: the Story of Blue Babe. The University of Chicago Press, Chicago.
Guthrie, R.D. 2003. Rapid body size decline in Alaskan Pleistocene horses before extinction. Nature, 426:169-171.
Hall, S.J.G. 2008. A comparative analysis of the habitat of the extinct aurochs and other prehistoric mammals in Britain. Ecography, 31:187-190.
Haskell, J.P., Ritchie, M.E., and Olff, H. 2002. Fractal geometry predicts varying body size scaling relationships for mammal and bird home ranges. Nature, 418:527-529.
Hernesniemi, E., Blomstedt, K., and Fortelius, M. 2011. Multi-view stereo three-dimensional reconstruction of lower molars of Recent and Pleistocene rhinoceroses for mesowear analysis. Palaeontologia Electronica 14.2.2T:1-15 palaeo-electronica.org/2011_2/246/index.html.
Hobbs, N.T., Baker, D.L., Bear, G.D., and Bowden, D.C. 1996. Ungulate grazing in sagebrush grassland: mechanisms of resource competition. Ecological Applications, 6:200-217.
Hubbard, R. 1996. The palynological studies from the Waechter excavations. Occasional Paper - British Museum, 94:191-199.
Innes, J.B., Blackford, J.J., and Simmons, I.G. 2011. Mesolithic environments at Star Carr, the Eastern Vale of Pickering and Environs: local and regional contexts. Journal of Wetland Archaeology, 11:85-108.
Jacobi, R.M. and Higham, T.F.G. 2009. The early lateglacial re-colonization of Britain: new radiocarbon evidence from Gough's Cave, southwest England. Quaternary Science Reviews, 28:1895-1913.
Janis, C.M., Gordon, I.J., and Illius, A.W. 1994. Modelling equid/ruminant competition in the fossil record. Historical Biology, 8:15-29.
Jarman, P.J. 1974. The social organisation of antelope in relation to their ecology. Behaviour, 48:215-267.
Kahlke, R.-D., García, N., Kostopoulos, D.S., Lacombat, F., Lister, A.M., Mazza, P.A., Spassov, N., and Titov, V.V. 2010. Western Palaearctic palaeoenvironmental conditions during the Early and early Middle Pleistocene inferred from large mammal communities, and implications for hominin dispersal in Europe. Quaternary Science Reviews, 30:1368-1395.
Kahlke, R.-D. and Kaiser, T.M. 2011. Generalism as a subsistence strategy: advantages and limitations of the highly flexible feeding traits of Pleistocene Stephanorhinus hundsheimensis (Rhinocerotidae, Mammalia). Quaternary Science Reviews, 30:2250-2261.
Kaiser, T.M. 2004. The dietary regimes of two contemporaneous populations of Hippotherium primigenium (Perissodactyla, Equidae) from the Vallesian (Upper Miocene) of Southern Germany. Palaeogeography, Palaeoclimatology, Palaeoecology, 198:381-402.
Kaiser, T.M. 2011. Feeding ecology and niche partitioning of the Laetoli ungulate faunas, p. 329-354. In Harrison, T. (ed.), Paleontology and Geology of Laetoli: Human Evolution in Context. Volume 1: Geology, Geochronology, Paleoecology and Paleoenvironment. Springer, New York.
Kaiser, T.M. and Fortelius, M. 2003. Differential mesowear in occluding upper and lower molars: opening mesowear analysis for lower molars and premolars in hypsodont horses. Journal of Morphology, 258:67-83.
Kaiser, T.M., Müller, D.W.H., Fortelius, M., Schulz, E., Codron, D., and Clauss, M. 2013. Hypsodonty and tooth facet development in relation to diet and habitat in herbivorous ungulates: implications for understanding tooth wear. Mammal Review, 43:34-46.
Khan, J.A., Chellam, R., Rodgers, W.A., and Johnsingh, A.T.J. 1996. Ungulate densities and biomass in the tropical dry deciduous forest of Gir, Gujarat, India . Journal of Tropical Ecology, 12:149-162.
Kley, A. 1966. Die Höhle bei Aufhausen, Kreis Göppingen. Jahreshefte für Karst- und Höhlenkunde, 6:115-138.
Kerney, M.P., Gibbard, P.L., Hall, A.R., Robinson, J.E., and Coope, R.G. 1982. Middle Devensian river deposits beneath the ‘Upper Floodplain’ terrace of the River Thames at Isleworth, West London. Proceedings of the Geologists’ Association, 93:385-393.
Koenigswald, W.v. and Beug, H.J. 1988. Schlussbetrachtung, p. 321-327. In Koenigswald, W.v. (ed.), Zur Paläoklimatologie des letzten Interglazials im Nordteil der Oberrheinebene.Paläoklimaforschung, 4. Gustav Fischer Verlag, Stuttgart.
Kojola, I., Huitu, O., Toppinen, K., Heikura, K., Heikkinen, S., and Ronkainen, S. 2004. Predation on European wild forest reindeer (Rangifer tarandus) by wolves ( Canis lupus) in Finland. Journal of Zoology (London), 263:229-235.
Kubo, M.O. and Yamada, E. 2014. The inter-relationship between dietary and environmental properties and tooth wear: comparisons of mesowear, molar wear rate, and hypsodonty index of extant sika deer populations. PLOS ONE, 9:1-12.
Lacombat, F. 2006. Pleistocene rhinoceroses in Mediterranean Europe and in Massif Central (France). Courier Forschungsinstitut Senckenberg, 256:57-69.
Lacombat, F. 2009. Biochronologie et grands mammifères au Pléistocène moyen et supérieur en Europe occidentale : l’apport des Rhinocerotidae (genre Stephanorhinus). Quaternaire, 20:429-435.
Langvatn, R. and Albon, S.D. 1986. Geographic clines in body weight of Norwegian red deer: a novel explanation of Bergmann’s rule? Holarctic Ecology, 9:285-293.
Latham, J. 1999. Interspecific interactions of ungulates in European forests. Forest Ecology and Management, 120:13-21.
Leroi-Gourhan, A. 1986. Pollen analysis of sediment samples from Gough's Cave, Cheddar. Proceedings - University of Bristol Spelaeological Society, 17:141-144.
Lewin, J. and Gibbard, P.L. 2010. Quaternary river terraces in England: forms, sediments and processes. Geomorphology, 120:293-311.
Lindstedt, S.L. and Boyce, M.S. 1985. Seasonality, fasting endurance, and body size in mammals. American Naturalist, 125:873-878.
Lister, A.M. 1984. The fossil record of elk (Alces alces (L.)) in Britain. Quaternary Newsletter, 44:1-7.
Lister, A.M. 1986. New results on deer from Swanscombe, and the stratigraphical significance of deer in the Middle and Upper Pleistocene of Europe. Journal of Archaeological Science, 13:319-338.
Lister, A.M. 1992. Mammalian fossils and Quaternary biostratigraphy. Quaternary Science Reviews, 11:329-344.
Lister, A.M. 1993. Evolution of mammoths and moose: the Holarctic perspective, p. 178-204. In Martin, R.A. and Barnosky, A.D. (eds.), Morphological Change in Quaternary Mammals of North America. Cambridge University Press, Cambridge.
Lister, A.M. 1994. The evolution of the giant deer, Megaloceros giganteus (Blumenbach). Zoological Journal of the Linnean Society, 112:65-100.
Lister, A.M. 1996. The morphological distinction between bones and teeth of fallow deer ( Dama dama) and red deer (Cervus elaphus). International Journal of Osteoarchaeology, 6:119-143.
Lister, A.M., Parfitt, S.A., Owen, F.J., Collinge, S.E., and Breda, M. 2010. Metric analysis of ungulate mammals in the early Middle Pleistocene of Britain, in relation to taxonomy and biostratigraphy II: Cervidae, Equidae and Suidae. Quaternary International, 228:157-179.
Louys, J., Ditchfield, P., Meloro, C., Elton, S., and Bishop, L.C. 2012. Stabile isotopes provide independent support for the use of mesowear variables for inferring diets in African antelopes. Proceedings of the Royal Society B, 279:4441-4446.
Maul, L.C., Heinrich, W.-D., Parfitt, S.A., and Paunescu, A.-C. 2007. Comment on the correlation between magnetostratigraphy and the evolution of Microtus (Arvicolidae, Rodentia, Mammalia) during the Early and early Middle Pleistocene, p. 243-263. In Kahlke, R.-D., Maul, L.C., and Mazza, P. (eds.), Late Neogene and Quaternary Biodiversity and Evolution: Regional Developments and Interregional Correlations. Volume II. Proceedings of the 18th International Senckenberg Conference, Courier Forschungsinstitut Senckenberg, 259. Schweizerbart Science Publishers, Stuttgart.
Maul, L.C. and Parfitt, S.A. 2010. Micromammals from the 1995 mammoth excavation at West Runton, Norfolk, UK: morphometric data, biostratigraphy and taxonomic reappraisal. Quaternary International, 228:91-115.
Meagher, M. 1986. Bison bison. Mammal Species, 266:1-8.
Menard, C., Duncan, P., Fleurance, G., Georges, J.-Y., and Lila, M. 2002. Comparative foraging and nutrition of horses and cattle in European wetlands. Journal of Applied Ecology, 39:12-133.
Mihlbachler, M.C., Rivals, F., Solounias, N., and Semprebon, G.M. 2011. Dietary change and evolution of horses in North America. Science, 331:1178-1181.
Mihlbachler, M.C. and Solounias, N. 2006. Coevolution of tooth crown height and diet in oreodonts (Merycoidodontidae, Artiodactyla) examined with phylogenetically independent contrasts. Journal of Mammalian Evolution, 13:11-36.
Mullenders, W.W. 1993. New palynological studies at Hoxne, p. 150-155. In Singer, R., Gladfelter, B.G., and Wymer, J.J. (eds.), The Lower Paleolithic Site at Hoxne, England. The University of Chicago Press, Chicago and London.
Nieminen, M. and Helle, T. 1980. Variations in body measurements of wild and semi-domestic reindeer (Rangifer tarandus) in Fennoscandia. Annales Zoologici Fennici, 17: 275-283.
Penkman, K.E.H., Preece, R.C., Bridgland, D.R., Keen, D.H., Meijer, T., Parfitt, S.A., White, T.S., and Collins, M.J. 2011. A chronological framework for the British Quaternary based on Bithynia opercula. Nature, 476:446-449.
Peters, R.H. 1983. The Ecological Implications of Body Size. Cambridge University Press, Cambridge.
Rankama, T. and Ukkonen, P. 2001. On the early history of the wild reindeer (Rangifer tarandus L.) in Finland. Boreas, 30:131-147.
Rivals, F., Julien, M.-A., Kuitems, M., Van Kolfschoten, T., Serangeli, J., Drucker, D.G., Bocherens, H., and Conard, N.J. 2015b. Investigation of equid paleodiet from Schöningen 13 II-4 through dental wear and isotopic analyses: Archaeological implications. Journal of Human Evolution, 89:129-137.
Rivals, F., Mol, D., Lacombat, F., Lister, A.M., and Semprebon, G.M. 2015a. Resource partitioning and niche separation between mammoths (Mammuthus rumanus and Mammuthus meridionalis) and gomphotheres ( Anancus arvernensis) in the Early Pleistocene of Europe. Quaternary International 379:164-170.
Rivals, F., Solounias, N., and Mihlbachler, M.C. 2007. Evidence for geographic variation in the diets of late Pleistocene and early Holocene Bison in North America, and differences from the diets of recent Bison. Quaternary Research, 68:338-346.
Roberts, M.B. 1986. Excavation of the Lower Paleolithic site at Amey’s Eartham Pit, Boxgrove, West Sussex: a preliminary report. Proceedings of the Prehistoric Society, 52:215-245.
Roberts, M.B. and Parfitt, S.A. 1999. Boxgrove: a Middle Pleistocene Hominid Site at Eartham Quarry, Boxgrove, West Sussex. Archaeological Report 17, English Heritage, London.
Saarinen, J. 2009. Body mass patterns of Eurasian Miocene large land mammals and their connections to environment and climate. Unpublished Master’s Thesis. University of Helsinki, Helsinki, Finland.
Schreve, D.C. 1997. Mammalian biostratigraphy of the later Middle Pleistocene in Britain. Unpublished Ph.D. Thesis. University of London, London, UK.
Schreve, D.C. 2000. The vertebrate assemblage from Hoxne, Suffolk, p. 155-164. In Lewis, S.G., Preece, R.C., and Whiteman, C.A. (eds.), The Quaternary of Norfolk and Suffolk, Field Guide. Quaternary Research Association, London.
Schreve, D.C. 2001. Differentiation of the British late Middle Pleistocene interglacials: the evidence from mammalian biostratigraphy. Quaternary Science Reviews, 20:1693-1705.
Schreve, D.C. and Bridgland, D.R. 2002. Correlation of English and German Middle Pleistocene fluvial sequences based on mammalian biostratigraphy. Netherlands Journal of Geosciences / Geologie en Mijnbouw, 81:357-373.
Schreve, D., Howard, A., Currant, A., Brooks, S., Buteux, S., Coope, R., Crocker, B., Field, M., Greenwood, M., Greig, J., and Toms, P. 2013. A Middle Devensian woolly rhinoceros ( Coelodonta antiquitatis) from Whitemoor Haye Quarry, Staffordshire (UK); paleoenvironmental context and significance. Journal of Quaternary Science, 28:118-130.
Scott, K.M. 1990. Postcranial dimensions of ungulates as predictors of body mass, p. 301-335. In Damuth, J. and MacFadden, B.J. (eds.), Body Size in Mammalian Palaeobiology - Estimation and Biological Implications. Cambridge University Press, New York.
Sickenberg, O. 1962. Über die Grösse der pleistozänen Pferde der Caballus-Gruppe in Europa und Nordasien. Eiszeitalter und Gegenwart, 12:99-124.
Skogland, T. 1983. The effects of density dependent resource limitation on size of wild reindeer. Oecologia, 60:156-168.
Stewart, K.M., Bowyer, R.T., Kie, J.G., Cimon, N.J., and Johnson, B.K. 2002. Temporospatial distributions of elk, mule deer, and cattle: resource partitioning and competitive replacement. Journal of Mammalogy, 83:229-244.
Stuart, A.J. 1976. The history of the mammal fauna during the Ipswichian/Last Interglacial in England. Philosophical Transactions of the Royal Society B, 276:221-250.
Stuart, A.J. and Gibbard, P.L. 1986. Pleistocene occurrence of hippopotamus in Britain. Quartärpaläontologie, 6:209-218.
Stuart, A.J. and Lister, A.M. 2010. The West Runton freshwater bed and the West Runton mammoth: summary and conclusions. Quaternary International, 228:241-248.
Sugita, S., Gaillard, M.-J., and Broström, A. 1999. Landscape openness and pollen records: a simulation approach. The Holocene, 9:409-421.
Sutcliffe, A.J. 1975. A hazard in the interpretation of glacial-interglacial sequences. Quaternary Newsletter, 17:1-3.
Svenning, J.-C. 2002. A review of natural vegetation openness in north-western Europe. Biological Conservation, 104:133-148.
Töigo, C., Gaillard, J.-M., Van Laere, G., Hewison, M., and Morellet, N. 2006. How does environmental variation influence body mass, body size, and body condition? Roe deer as a case study. Ecography, 29:301-308.
Turner, C. 1975. Der Einfluss grosser Mammalier auf die interglaziale Vegetation. Quartärpaläontologie, 1:13-19.
Turner, C. 1985. Problems and pitfalls in the application of palynology to Pleistocene archaeological sites in western Europe. Palynologie archeologique, Centre Nationale pour la Recherche Scientifique, 17: 347-373.
Urban, B. 1992. Die Rolle der Quartärbotanik und ihre Bedeutung für die Fundstelle des Homo erectus heidelbergensis von Mauer, p. 111-119. In Beinhauer, K.W. and Wagner, G.A. (eds.), Schichten von Mauer - 85 Jahre Homo erectus heidelbergensis. Edition Braus, Reiss-Museum der Stadt Mannheim.
Van Asperen, E.N. 2010. Ecomorphological adaptations to climate and substrate in the Middle Pleistocene caballoid horses. Palaeogeography, Palaeoclimatology, Palaeoecology, 297:584-596.
Van Asperen, E.N. 2013. Position of the Steinheim interglacial sequence within the marine oxygen isotope record based on mammal biostratigraphy. Quaternary International, 292:33-42.
Van Kolfschoten, T. 2000. The Eemian mammal fauna of central Europe. Netherlands Journal of Geosciences / Geologie en Mijnbouw, 79:269-281.
Van Vuure, C. 2005. Retracing the Aurochs. History, Morphology and Ecology of an Extinct Wild Ox. Pensoft, Sofia-Moscow.
Wagner, G.A., Maul, L.C., Löscher, M., and Schreiber, H.D. 2011. Mauer - the type site of Homo heidelbergensis: paleoenvironment and age. Quaternary Science Reviews, 30:1464-1473.
Watts, W.A. 1977. The Late Devensian vegetation of Ireland. Philosophical Transactions of the Royal Society B, 280:274-293.
West, G.B., Brown, J.H., and Enquist, B.J. 1997. A general model for the origin of allometric scaling laws in biology. Science, 276:122-126.
West, R.G. 1969. Pollen analyses from interglacial deposits at Aveley and Grays, Essex. Proceedings of the Geologists’ Association, 80:271-282.
West, R.G. 1980. The Pre-Glacial Pleistocene of the Norfolk and Suffolk Coasts. Cambridge University Press, Cambridge.
West, R.G., Dickson, C.A., Catt, J.A., Weir, A.H., and Sparks, B.W. 1974. Late Pleistocene deposits at Wretton, Norfolk II. Devensian Deposits. Philosophical Transactions of the Royal Society B, 267:337-420.
West, R.G., Lambert, C.A., Sparks, B.W., and Dickson, J.H. 1964. Interglacial deposits at Ilford, Essex. Philosophical Transactions of the Royal Society B, 247:185-212.
Wolverton, S., Huston, M.A., Kennedy, J.H., Cagle, K., and Cornelius, J.D. 2009. Conformation to Bergmann's Rule in white-tailed deer can be explained by food availability. The American Midland Naturalist, 162:403-417.
Ziegler, R. 1996. Die Grosssäuger aus der Frühwürm-zeitlichen Fauna von der Villa Seckendorff in Stuttgart-Bad Cannstatt. Stuttgarter Beiträge zur Naturkunde, serie B (Geologie und Paläontologie), 237:1-63.
Ziegler, R. and Dean, D. 1998. Mammalian fauna and biostratigraphy of the pre-Neandertal site of Reilingen, Germany. Journal of Human Evolution, 34:469-484.
Zimov, S.A., Chuprynin, V.I., Oreshko, A.P., Chapin III, F.S., Reynolds, J.F., and Chapin, M.C. 1995. Steppe-tundra transition: a herbivore-driven biome shift at the end of the Pleistocene. The American Naturalist, 146:765-794 .
