

 Numerical taxonomy and genus-species identification of Czekanowskiales in China based on machine learning
Article number: 27.1.a10
https://doi.org/10.26879/1357
Copyright Paleontological Society, January 2024
Author biographies
Plain-language and multi-lingual abstracts
PDF version
Submission: 12 November 2023. Acceptance: 16 January 2024.
ABSTRACT
Czekanowskiales were the main component of the global Mesozoic flora and were sensitive to changes in the climate and environment during that period. However, accurate identification of Czekanowskiales fossils is difficult due to the similarities in some macroscopic and cuticular patterns among different genera and species. In the present study, a dataset of macroscopic and cuticular traits was collated based on the Czekanowskiales fossils from China. This study focused on the numerical taxonomy and identification of Czekanowskiales at the generic and species levels using cluster analysis, trait selection, and supervised learning methods for machine learning. Our results show that the studied 35 species can be clustered into three major groups, as consistent in a great extent with traditional taxonomic methods. Macroscopic traits are more important for the identification at the generic level, while cuticular traits are more valuable for the identification at the species level. The classification and regression tree as well as logistic regression algorithms demonstrated superior performance in the genus and species identification, and the inclusion of cuticular traits could significantly improve the accuracy of identification. This study provides quantitative analytical evidence for the taxonomy of Czekanowskiales fossils.
Bo Zhang. College of Geography and Environmental Science, Northwestern Normal University, Lanzhou, China. 15036502833@163.com
Cunlin Xin. College of Geography and Environmental Science, Northwestern Normal University, Lanzhou, China; State Key Laboratory of Palaeobiology and Stratigraphy, Nanjing Institute of Geology and Palaeontology, Chinese Academy of Sciences, Nanjing 210008, China. xincunling@163.com (Corresponding author)
Dong Yang. College of Geography and Environmental Science, Northwest Normal University, Lanzhou, China. yangdong@nwnu.edu.cn
Zhipeng Jiao. College of Geography and Environmental Science, Northwest Normal University, Lanzhou, China. 18894315015@163.com
Songxin Liu. College of Geography and Environmental Science, Northwest Normal University, Lanzhou, China. lsxin199562@163.com
Guoyun Di. College of Geography and Environmental Science, Northwest Normal University, Lanzhou, China. gydi2019@163.com
Han Zhao. College of Geography and Environmental Science, Northwest Normal University, Lanzhou, China. 12333k3@163.com
Key words: Machine learning; Czekanowskiales; numerical taxonomy; fossil identification
Final citation: Zhang, Bo, Xin, Cunlin, Yang, Dong, Jiao, Zhipeng, Liu, Songxin, Di, Guoyun, and Zhao, Han. 2024. Numerical taxonomy and genus-species identification of Czekanowskiales in China based on machine learning. Palaeontologia Electronica, 27(1):a10.
https://doi.org/10.26879/1357
palaeo-electronica.org/content/2024/5126-quantitative-analysis-by-machine-learning
Copyright: January 2024 Paleontological Society.
This is an open access article distributed under the terms of Attribution-NonCommercial-ShareAlike 4.0 International (CC BY-NC-SA 4.0), which permits users to copy and redistribute the material in any medium or format, provided it is not used for commercial purposes and the original author and source are credited, with indications if any changes are made.
creativecommons.org/licenses/by-nc-sa/4.0/
INTRODUCTION
Czekanowskiales were prominent constituents of the Mesozoic flora and included several genera, such as Czekanowskia, Hartzia, Solenites, Sphenarion, and Phoenicopsis (Li et al., 1988). Fossils of these genera are widespread across multiple regions, including China, Russia, Siberia, the Korean Peninsula, Central Asia, and Mongolia (Harris et al., 1974; Liu et al., 2016; Kirichkova, 2016). Owing to the remarkable sensitivity of the Czekanowskiales members to environmental changes, fossils in this order have been important materials in paleobotanical studies (Harris, 1951; Krassilov, 1970; Gromov et al., 1980; Deng, 1995; Kiritchkova et al., 2002; Li, 2018). The initial classification of Czekanowskiales was largely based on the observable macroscopic traits of the fossilized leaves (Krassilov, 1968; Gomolitzky and Khudayberdyev, 1978; Harris, 1979; Sinitsa, 1985; Samylina and Kirichkova, 1991). In subsequent years, several researchers focused on the cuticular patterns of Czekanowskiales, with particular emphasis on cuticular patterns in Phoenicopsis and Czekanowskia (Samylina and Kirichkova, 1993; Zhou and Guignard, 1998; Sun et al., 2015; Huang et al., 2016). These investigations have contributed significantly to the advancement of our understanding of Czekanowskiales. However, most related studies have been dedicated to individual genera and species, with relatively limited emphasis on systematic and taxonomic concerns. Additionally, only a few studies have incorporated quantitative identification (Xin et al., 2019a; Xiao et al., 2020; Wang et al., 2022).
The foundational aspect of paleobotany research is the taxonomy and identification of fossils. However, the conventional approaches employed in these processes are often tedious and rely heavily on the researcher's knowledge, experience, and subjective judgment (Zhou et al., 2020). Furthermore, incomplete preservation of the cuticular traits of a specimen often leads to accurate identification of fossilized plants when traditional methods are used (Zhou, 2003; Jia et al., 2017), despite the valuable information these fossils contain regarding physiology, morphology, and taxonomy (Sun et al., 2009a). Therefore, it is necessary to objectively evaluate the reliability of conventional taxonomy and identification methods and the taxonomic value of the fossilized plant morphological traits. In this regard, efficient and low-cost quantitative methods are more suitable.
Quantitative analysis methods have been instrumental in expanding and deepening paleobotanical research, allowing for a more comprehensive and quantitative approach (Wang, 2018). For instance, cluster analysis has been employed to investigate the geographic distribution of fossil flora, as demonstrated in previous studies (Mi et al., 1986; Sun, 1989; Lin et al., 1993; Wang et al., 1999; Li, 2016; Xin et al., 2019b). However, the use of quantitative analysis methods in the taxonomy and identification of fossil plants has been relatively limited (Mi et al., 1991; Holdener, 1994; Lv, 2010; Wang, 2018). Traits are a critical aspect relied upon in biological research and are useful tools for studying organisms and their phylogenetic relationships (Adams et al., 2004; Van and Schultheiß, 2010). To promote research in this area, it is essential to select an appropriate method for encoding traits and incorporating additional trait data into quantitative analysis. With the rapid development of computer technology, machine learning has emerged as a more convenient and efficient platform, offering richer algorithms for quantitative analysis research. Machine learning can be divided into two categories: unsupervised and supervised learning (Zollanvari, 2023). Unsupervised learning integrates the cluster analysis method in traditional quantitative analysis to achieve numerical taxonomy of sample sets by calculating the similarity between samples. In contrast, supervised learning involves mapping traits and labels (e.g., generic and species names) from sample sets to identify new samples. Several scholars have explored the identification of fossil plant and animal images via the convolutional neural network (CNN) algorithm in supervised learning, and the results have shown high average accuracy (Xu et al., 2020; Marchant et al., 2020; Liu and Song, 2020; Liu et al., 2022). However, the CNN algorithm also has limitations (Sabour et al., 2017), such as the high demand for training data, which often requires tens or even hundreds of thousands of images to achieve good results. Therefore, relying on manual statistical trait data can significantly reduce the training cost of machine learning and offer more possibilities for quantitative analysis of paleontological specimens and their preserved traits where they are limited.
Therefore, the aim in this study was to compile statistical data on the morphological traits of 35 species of the Czekanowskiales from China and to use a hierarchical clustering algorithm to numerically classify them. Furthermore, five supervised learning algorithms, including logistic regression (LR), k-nearest neighbors (KNN), naive Bayes (NB), a classification and regression tree (CART), and a support vector machine (SVM), were used to train an identification model to accurately identify unknown genera and species of Czekanowskiales. The best algorithm was selected based on the evaluation of the average accuracy and confusion matrix. To improve the applicability of the method, supervised learning on the macroscopic trait dataset was also conducted separately, with the aim being to meet the identification needs of a large number of fossilized plants samples. In this study, we used morphological data to provide quantitative analytical evidence for the traditional taxonomy of Czekanowskiales, as well as providing tools or recommendations for identifying Czekanowskiales in future research. Additionally, key traits for the identification of Czekanowskiales were confirmed, which effectively enhanced the validity using of morphological traits in traditional methods.
MATERIALS AND METHODS
Research Materials
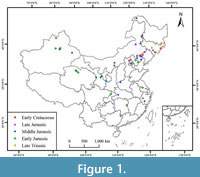 The present study utilized measurements taken from published monographs, the scientific literature, and the National Specimen Information Infrastructure (NSII) of China. This research focused on 35 species from four different Czekanowskiales genera from the Mesozoic in China. Table 1 presents the details of the selected research objects, while Figure 1 provides a visualization of their geographic distribution. To ensure the integrity of the data, we counted and analyzed only a portion of the literature on fossils that were well preserved, and cuticle studies were carried out. For the most part, the data documented in the literature have generally fulfilled our statistical needs, and for some of the undocumented data, we used CorelDRAW X8 software to measure each image according to its respective scale>, and the measured traits are shown in Table 2. At least two fossil specimens were measured for each operational taxonomic unit, and as many specimens as possible were measured to yield a total of 80 specimens documented in 206 images.
Encoding Traits
In this study, the coding of qualitative traits was performed using both label encoding and one-hot encoding, as indicated in Table 3. These methods can convert categorical variables into a form that is easily used by machine learning algorithms. Label encoding involves assigning sequences of equally spaced numerical values, such as 0, 1, 2, 3, etc., to each trait; this is a simple encoding method. However, the sequences of the encoded values could lead to errors. On the other hand, one-hot encoding involves converting the original trait variables into multidimensional variables that are categorized by the value of the original trait while replacing and quantifying the new trait values in a binary (0, 1) manner. One-hot encoding does not create sequences among the variables; therefore, this encoding method is more reasonable than label encoding is, but it is prone to dimensionality (i.e., it performs well on the training set but lacks the ability to generalize to new data) when there are more categories of traits and variables. To address this issue, label encoding was used in cluster analysis and trait selection, while one-hot encoding was used in supervised learning after trait selection was completed.
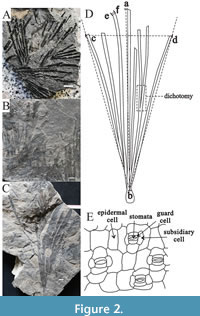 Macroscopic and cuticular traits were evaluated through measurement and counting. The macroscopic traits are henceforth referred to as "macro traits," while the cuticular traits are referred to as "cuticular traits," as shown in Figure 2. Unattainable traits, such as stomatal type and stomatal parameters, were eliminated from consideration, resulting in 32 mixed traits, comprising 13 macro traits and 19 cuticular traits. Among these mixed traits, 16 are quantitative, and the other 16 qualitative, as shown in Table 2. Quantitative traits were directly derived from the measured data, and their measurements are detailed in Figure 2. The following provides a brief interpretation of such traits:
Leaf cluster width: the distance between two points on the most lateral lobe (Figure 2, dotted line cd);
Leaf cluster length (or lobe length): the longest distance from the leaf tip to the leaf base (Figure 2, dotted line ab);
Leaf cluster aspect ratio: the ratio of leaf cluster length to leaf cluster width;
Lobe width: average of the maximum widths of well-preserved lobes (Figure 2, line ef);
Lobe aspect ratio: the ratio of lobe length to lobe width;
The number of lobes: the number of all lobes clustered on short branches (after dichotomizing);
The number of dichotomies: the sum of the number of dichotomies in the leaves;
Angle between the most lateral lobes: the angle of expansion of the most lateral lobes (Figure 2, angle cbd);
The number of veins: the sum of the number of veins on the leaves;
The area of epidermal cells was calculated as the product of the length and width of epidermal cells, including upper and lower epidermal cells, and nonrectangular morphological cells were measured using the minimum circumscribed rectangle method, the same as below;
The aspect ratio of epidermal cells was calculated as the ratio of the length to the width of epidermal cells, including upper and lower epidermal cells;
Area of the stomatal complex: the product of the length and width of the complex composed of subsidiary cells, guard cells and their intermediate stomata pit;
Aspect ratio of the stomatal complex: the ratio of the length to the width of the stomatal complex; and
The number of subsidiary cells: the number of subsidiary cells on the stomatal complex.
Cluster Analysis Method
To better understand the interspecific variability in Czekanowskiales, we processed the statistical specimen-level dataset and used it for cluster analysis. The quantitative trait data were averaged across specimens of the same species, while the qualitative trait variables were assigned the highest frequency values. With the Python, we encoded the labels of the qualitative trait variables and standardized the data matrices to unify the metric scales. Finally, we used the dendrogram function in the SciPy library for cluster analysis of the 35 species of Czekanowskiales, where the distance metric was set to Euclidean and the intercluster similarity was set to Ward's variance minimization.
Trait Selection Method
The purpose of trait selection is to maximize the extraction of key traits from the initial selection of traits for use in supervised learning algorithms. The process involves retaining traits with high information content and eliminating those with low information content, while also ensuring that there is no redundancy in the information between traits. In this study, the ExtremeTreesClassifier algorithm (Geurts et al., 2006) was used to calculate the importance scores of traits, and Pearson correlation coefficients between each trait were calculated to eliminate redundant traits. The trait selection process involved three steps: (1) ranking the traits in descending order of their importance scores, (2) eliminating traits with correlation coefficients greater than 0.7 starting from the trait with the highest importance score, and (3) designating as key traits any included trait whose cumulative score exceeded 0.7.
Supervised Learning Method
The supervised learning algorithm was used to train the model for genus and species identification in Czekanowskiales. Logistic regression (LR) was selected from linear algorithms; k-nearest neighbors (KNN), naive Bayes (NB), a classification and regression tree (CART), and a support vector machine (SVM) were selected from nonlinear algorithms for comparative analysis. The algorithms were evaluated using metrics such as accuracy and a confusion matrix. To prevent overfitting, a 3:1 ratio was used to divide the dataset into a training set and a test set that did not influence each other during the model training process. The training set data were verified using the 10-fold crossover method, and the average accuracy of the model in 10 iterations was used to select the optimal algorithm. The hyperparameters of the algorithm were tuned using the GridSearchCV module (Pedregosa et al., 2011), and the performance of the algorithm was ultimately evaluated using the test set (Wei, 2018). Due to the unbalanced number of samples from different genera and species in the dataset, the ‘class_weight’ parameter in the algorithm was set to ‘balanced’ to create weights that were inversely proportional to the frequency of samples from different genera and species in order to mitigate the effects of unbalanced data (Albon, 2018).
RESULTS
Numerical Taxonomy of Czekanowskiales
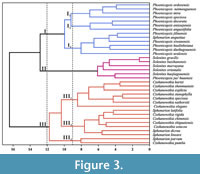 Based on the mixed trait statistical data, 35 species of Czekanowskiales were subjected to cluster analysis (Figure 3). With a Euclidean distance coefficient of 12.0, all the Czekanowskiales were classified into three distinct groups (I, II, and III).
Group I comprised 13 taxonomic units and could also be subdivided into three subgroups (I1, I2 and I3) at a Euclidean distance of 9.0. (1) Subgroup I1: This subgroup is composed entirely of Phoenicopsis. The lobes of this subgroup are generally linear, measuring between 13-17 cm in length and 0.4-0.6 cm in width, without any dichotomy. The angle between most of the lateral lobes is found to be between 30-42°, and the leaf veins are parallel, with approximately 8-12 lines. The upper and lower epidermal structures of these plants are similar, exhibiting long rectangular cell shapes with a straight anticlinal wall pattern and no surface ornamentation. The stomatal apparatus is oval and arranged in a row. (2) Subgroup I2: This subgroup is also composed entirely of Phoenicopsis. This subgroup typically has 5-7 lobes, each of which are 8-10 cm long and 0.5-0.6 cm wide, without dichotomy. The short shoot possesses scaly leaves, and the angle between the most lateral lobes is 43-51°, while the leaf veins are parallel and approximately 9-12 in number. The upper and lower epidermal structures are similar and contain long rectangular cells arranged in rows. The leaves have an elliptical stomatal apparatus of the lower stomatal type. (3) Subgroup I 3: This subgroup comprises Phoenicopsis and Sphenarion. Typically, these plants have thinly linear to linear lobes that are 7.5-9 cm long and 0.17-0.4 cm wide, and they are not dichotomized or are dichotomized only once. The leaf veins are parallel, with approximately 3-6 in number. The upper and lower epidermis of the leaves have similar structures, with cells arranged in rows, the anticlinal wall of cells being straight or straight and slightly curved, and the surface free of ornamentation. The stomatal apparatus is oval, and the surface of the subsidiary cells is papillate.
Group II comprises six taxonomic units, which include all five species of Solenites and one species of Phoenicopsis. The lobes of this group are generally thinly linear to linear, with 8-12 lobes and an angle of 38-50° between the most lateral lobes. The leaf veins and short shoots are inconspicuous. The upper and lower epidermis displayed similar structures, consisting of long rectangular cells arranged in rows, with the anticlinal cell walls being straight. The leaves are of the double-sided stomatal type, with the stomatal apparatus arranged in rows.
Group III comprises 16 taxonomic units and can also be subdivided into three subgroups (III1, III 2, and III3) at a Euclidean distance of 9.0. (1) Subgroup III1: This subgroup is composed entirely of Czekanowskia. These plants are characterized by thinly linear to linear lobes that are 10-15 cm long and 0.06-0.1 cm wide and are dichotomized 2-4 times, with an angle between the most lateral lobes of 26-30°. The upper and lower epidermis exhibited similar structures, with cells arranged in rows. Additionally, the leaves are of the double-sided stomata type, with oval stomata apparatuses arranged in rows. (2) Subgroup III2: This subgroup included Czekanowskia and Sphenarion. In general, Subgroup III2 exhibited 4-7 lobes, ranging from 6-10.5 cm long to 0.08-0.4 cm wide; the leaf veins are inconspicuous. The upper and lower epidermis possess similar structures, and the cells are elongated rectangles or polygons arranged in rows, with the anticlinal wall of cells appearing straight or slightly curved. The stomata apparatuses are oval and arranged in rows. (3) Subgroup III3: Only Sphenarion parvum and Czekanowskia pumlia are included. This subgroup generally has 3-4 lobes, is approximately 3 cm long and 0.05-0.15 cm wide, and has short shoots with scaly leaves. The angle between most of the lateral lobes is 35-45°, and leaf veins are not prominently visible. The upper and lower epidermis are similar in structure, and the cells are long polygonal in shape and irregularly arranged. The leaves have a double-sided stomatal type, and the stomatal apparatus is oval and arranged in rows.
Genus and Species Identification of Czekanowskiales
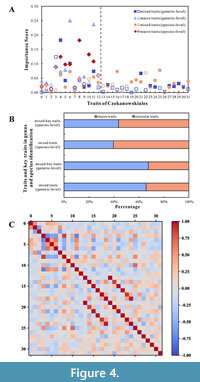 Selection of key traits for genus-level identification. We calculated the importance scores of the 32 traits using the ExtraTreesClassifier algorithm (Figure 4A), the proportions of importance scores for macro trait and cuticular trait information used for genus and species identification (Figure 4B) and Pearson correlation coefficients for these traits (Figure 4C). The correlation coefficient between the 'lobe aspect ratio' and 'lobe width' was found to be -0.704; as the former score is higher, the latter was excluded. Similarly, several other traits were also excluded, such as the surface ornamentation of upper epidermal cells, the shape of the lower epidermal cells, the stomatal type, the area of upper epidermal cells, and the aspect ratio of upper epidermal cells. Ultimately, 15 traits were selected as key traits for genus-level identification, including the lobe aspect ratio, number of dichotomies, leaf vein types, surface ornamentation of the lower epidermal cells, number of lobes, number of veins, aspect ratio of the stomatal complex, shape of upper epidermal cells, shape of the lobe apex, shape of the stomatal apparatus, area of the lower epidermal cells, area of stomatal complex, aspect ratio of lower epidermal cells, lobe shape, and number of subsidiary cells. The cumulative importance score of the mixed-key traits reached 0.716.
The dataset containing only macro trait information was analyzed to calculate importance scores for each trait. The Pearson correlation coefficient was used to evaluate the correlation between macro traits. The correlation coefficient between ‘leaf vein types’ and ‘lobe width’ was found to be -0.739. Accordingly, ‘lobe width’ was excluded, and a total of seven macro traits were selected as key traits for genus-level identification among the 13 macro traits. These traits included the number of dichotomies, leaf vein types, lobe width, the number of lobes, the lobe aspect ratio, lobe shape, and the number of veins. The cumulative importance score of the macro-key traits was 0.737.
Selection of key traits for species-level identification. Upon combining the importance scores of the mixed traits and the Pearson correlation coefficients between the traits, the elimination of redundant traits was performed sequentially. Eventually, 16 traits were selected as key traits for species-level identification among the 32 mixed traits. The selected traits include stomatal type, anticlinal wall of the upper epidermis cells, number of dichotomies, the lobe aspect ratio, number of veins, shape of the lower epidermal cells, aspect ratio of the lower epidermal cells, surface ornamentation of subsidiary cells, arrangement of the lower epidermal cells, surface ornamentation of the lower epidermal cells, leaf veins types, short shoot, area of the stomatal complex, the number of lobes, leaf cluster length (or lobe length), and shape of the stomatal apparatus. The cumulative importance score for the mixed-key traits reached 0.710.
Using only the dataset comprising macro trait information, combined importance scores for each trait and Pearson correlation coefficients between traits and redundant traits were removed in order. Finally, a total of six traits, including the number of veins, shape of the lobe apex, lobe aspect ratio, leaf vein types, number of dichotomies, and number of lobes, were finally selected as macro-key traits for species-level identification among the 13 macro traits, with a cumulative importance score of 0.742.
Comparison of Identification Results for the Different Supervised Learning Algorithms
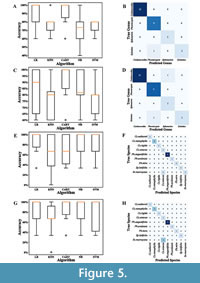 Five supervised learning algorithms were employed for genus and species identification in Czekanowskiales. Figure 5 shows the data distribution of the identification results obtained by different algorithms and the confusion matrix for the best algorithm.
Comparison of genus-level identification results. Based on the mixed-key trait dataset, the CART algorithm was ultimately selected to test the prediction effectiveness of the test set (Figure 5A). Subsequently, the parameters of the algorithm were tuned to optimize its performance. As the confusion matrix illustrates (Figure 5B), 25 of the 26 samples in the test set were correctly identified with a prediction accuracy of 96.2%.
Using only the macro-key trait dataset, the CART algorithm was selected to assess the prediction efficacy of the test set (Figure 5C). Following the optimization of the algorithm for parameter tuning, 24 out of the 26 samples in the test set were accurately identified, as illustrated by the confusion matrix (Figure 5D), indicating a prediction accuracy of 92.3%.
Comparison of species-level identification results. Based on the mixed-key trait dataset, the LR algorithm was selected to assess the prediction effectiveness of the test set (Figure 5E). After tuning the parameters, the LR algorithm correctly identified 14 of the 15 samples in the test set, as illustrated by the confusion matrix (Figure 5F), yielding a prediction accuracy of 93.3%.
Using only the macro-key trait dataset, the CART algorithm was selected to evaluate the prediction efficacy of the test set (Figure 5G). After algorithm parameter optimization, 13 out of the 15 test set samples were correctly identified according to the confusion matrix (Figure 5H), yielding a prediction accuracy of 86.7%.
DISCUSSION
Comparison of Traditional Taxonomy with Numerical Taxonomy
Three different levels of consistency between our results and the traditional taxonomy are recognized, as described below.
Excellent consistency. The taxonomic consistency of Solenites and Czekanowskia is excellent, with all Solenites clustering in Group II and all Czekanowskia clustering in Group III. The genus Solenites was first proposed by Lindley and Hutton (1834), and Nathorst (1919) established the criteria for Solenites based on the presence of a short shoot and nondichotomous leaf, while those with a dichotomous leaf were designated as Czekanowskia. This classification has been widely accepted (Harris, 1951; Si and Li, 1963; Wu, 1993; Deng and Lu, 2008; Li et al., 2015). Moreover, the dichotomizing pattern of leaves has been considered a key morphological characteristic for differentiating between Solenites and Czekanowskia (Yan and Sun, 2004).
Good consistency. For some other groups, our results match relatively well with those of traditional taxonomy. In the present study, Phoenicopsis is mainly classified in Group I, while Phoenicopsis jus'huaensis was classified in Group II along with Solenites, which is somewhat different from the traditional taxonomic view. A comparison of the two taxa reveals several similarities. However, the lobe of Phoenicopsis jus'huaensis is wider, the leaf veins are distinctly parallel (unlike those of Solenites, which generally have indistinct leaf veins), and the surface of the epidermal cells displays papillate ornamentation. These traits serve as the main basis for identifying Phoenicopsis (Sun, 1987). Therefore, this study supports the traditional taxonomic view and classifies Phoenicopsis jus'huaensis as Phoenicopsis. Phoenicopsis is a form-genus established by Heer (1876) based on specimens from the Irkutsk Basin, Siberia, formerly USSR. Florin (1936) revised the genus into three genera, Stephenophyllum, Windwardia, and Culgoweria, based on epidermal structural traits, and Samylina (1972) subsequently revised the above three genera into subgenera.
In the present study, the taxonomic analysis of Sphenarion resulted in clustering predominantly in Group III. However, Sphenarion angusitae exhibited partial similarity in cuticular pattern with Phoenicopsis, clustering with the latter in Group I. Nevertheless, while the lobe of Phoenicopsis is usually nondichotomous or occasionally dichotomous, as reported in previous studies (Miao, 2006; Li, 2018), Sphenarion angusitae exhibited a clearly dichotomous lobe, similar to other members of the Sphenarion group (Huang et al., 2017), and were more elongated with narrow cuneate shapes. Thus, considering the noticeable macro-morphological differences between the two groups, Sphenarion angusitae was retained within the Sphenarion genus in this study.
Inconsistency. Unlike traditional taxonomy, our numerical taxonomy divides the four genera of Czekanowskiales into only three groups, leading to difficulty in distinguishing the affinities of Czekanowskia and Sphenarion. Specifically, Sphenarion latifolia is close to Czekanowskia in Group III and Subgroup III2, while Czekanowskia pumlia is close to Sphenarion in Group III and Subgroup III3. While Czekanowskia species have long, linear leaves that are divided into two to three dichotomies at sharp angles to form narrow, entire lobes, and Sphenarion latifolia has narrowly cuneate and relatively wide leaves (Chen et al., 1984; Qian et al., 1987). Despite these differences, similarities in the number of dichotomies, leaf vein types and the shape and arrangement of leaf stomata may explain their clustering. Czekanowskia pumlia was established by Li et al. (1988). This species has short leaf, differs from other Czekanowskia species with elongated leaves but shares common traits with Sphenarion latifolia, such as short leaves. However, differences in traits such as short shoots, epidermal cells, and surface ornamentation of subsidiary cells distinguish Czekanowskia pumlia from other Sphenarion species. This study supports traditional taxonomy and emphasizes the need for further investigation of the numerical taxonomic position and affinities of these genera.
Analysis of Some Genera and Species Mixed in the Clustering Results
As discussed above, based on comparisons of related trait data, we conclude that the small differences among the traits are the direct cause of the mixing of some genera and species. However, the underlying reasons that inform our decision to continue to support traditional taxonomy rather than make revisions are the limitations of the cluster analysis method itself.
(1) Cluster analysis, as a common unsupervised learning algorithm, categorizes the observations into groups by calculating similarities. As an exploratory analysis, there is a certain amount of uncertainty, and therefore, the results may not always reflect the actual taxonomy of the data. In other words, the relationships between artificially created taxonomic labels and traits may be more complex.
(2) The application of label encoding methods to qualitative trait information in cluster analysis can also affect the accuracy of the results (Albon, 2018). Label encoding methods give more weight to qualitative traits with higher encoding values; however, we found that it is difficult to find a more appropriate encoding method for cluster analysis.
(3) Redundant traits in the cluster analysis affected the results. Due to the small number of specimens of some species, the ExtremeTreesClassifier algorithm was not applicable, which made it difficult for us to perform effective trait selection in the cluster analysis. Therefore, we had to consider all the traits.
For the above reasons, the numerical taxonomy results are not entirely consistent with traditional taxonomy results, as also revealed in previous studies (Xin et al., 2019a; Xiao et al., 2020; Wang et al., 2022). Nevertheless, for this study, we believe that the significance or necessity of cluster analysis is that the consistency it shows with traditional taxonomy provides evidence for the validity of traditional taxonomy in quantitative analysis. Based on this, we carried out supervised learning training using the genus and species names of each fossil specimen according to traditional taxonomy, which allowed us to provide a new tool for identifying Czekanowskiales. In our future research, in order to solve the problems mentioned above, we will continue to focus on and explore more possibilities for applying cluster analysis (or unsupervised learning).
Comparative Analysis of Key Traits
Some macro-traits, such as the aspect ratio of the lobe, the number of lobes, dichotomies, veins, and their shapes, are commonly selected as key traits regardless of the application scenario (Figure 4A). These observations are consistent with the findings of previous studies. Notably, lobe size and number, leaf dichotomizing status, leaf vein shape, and number are essential markers for macroscopically distinguishing various genera of Czekanowskiales, as has been reported in previous studies (Chen et al., 1988; Mi et al., 1996; Sun et al., 2016; Ji, 2020). With the simultaneous use of cuticular trait data, the key traits commonly include the surface ornamentation of the lower epidermal cells, aspect ratio of the lower epidermal cells, shape of the stomatal apparatus, and area of the stomatal complex. Wilkinson (1979) showed that cuticular traits such as the stomatal apparatus and surface ornamentation of epidermal cells exhibit obvious specificity. Furthermore, the size of epidermal cells is usually influenced by the distribution of stomata; i.e., epidermal cells within the stomatal zone are shorter than those within the nonstomatal zone (Sun et al., 2009b; Li et al., 2014; Huang, 2016).
The importance of traits in discriminating between samples can be represented by the trait importance score (Albon, 2018). We compared the cumulative importance scores of macro traits and cuticular traits in the identification of the Czekanowskiales genera and species, and the proportions of macro traits and cuticular traits remained stable before and after the selection of key traits (Figure 4B). Additionally, the total score (67.6%) and average score of macro-key traits were greater for genus-level identification, whereas the total score (43.72%) and average score of macro-key traits were lower for species-level identification. This finding suggests that macro traits are more important for genus-level identification, while cuticular traits are more important for species-level identification of Czekanowskiales. This may be because, in the past, the establishment of the genus Czekanowskiales relied mainly on macroscopic traits (Wu et al., 1980; Zhou, 1984; Wang, 1984; Sun et al., 2001); thus macro trait differences among genera are more recognizable for supervised learning models than are cuticular trait differences. Moreover, cuticular patterned traits are important in the taxonomy and identification of the genus Suturovagina from the Lower Cretaceous in Jilin Province, China (Mairot et al., 2014). Overall, macro traits and cuticular traits play different roles in machine learning for identifying fossils, and the combination of both has been effective in improving the reliability of fossil plant identification.
Comparative Analysis of Genus and Species Identification
We compared five different algorithms by evaluating their average accuracy and standard variance. Then, we selected the optimal algorithm for genus and species identification of Czekanowskiales in various application scenarios through test set validation. The CART algorithm is the most effective for genus-level identification, achieving an average accuracy of 90.0% and a test set validation accuracy of 96.2% after algorithm tuning. Even when only macro traits are used, the average accuracy can reach 88.3%, and the test set validation accuracy was 92.3% after algorithm tuning. On the other hand, the LR algorithm is most effective for species-level identification using mixed traits, with an average accuracy of 86.7% and the test set validation accuracy was 93.3% after algorithm referencing. When using only macro traits information, the optimal algorithm for species-level identification is CART, for which the average accuracy was 83.3%, and the test set validation accuracy was 86.7% after algorithm referencing. Our analysis indicated that hyperparameter optimization effectively improved identification accuracy, and the inclusion of cuticular traits also contributed to this improvement.
A Discussion on Machine Learning Methods
Considering the outstanding performance of machine learning methods in identifying Czekanowskiales, their application to more fossilized taxa specimens could be attempted in future studies. However, the exploration of machine learning algorithms undoubtedly relies on strong support from datasets. The statistical analysis of fossil trait datasets is a rigorous and complex task, particularly with regard to trait selection, which requires a balance between validity and necessity since redundant or misleading data can reduce the accuracy of the algorithm. Another important factor is the variation in the extent of study of various fossil plant taxa. For instance, in a previous study by Xin et al. (2019a) on 42 fossil species in the Dicksoniaceae population in the Mesozoic from China, due to a lack of information on fossil cuticles of pteridophytes, only 12 macro traits were selected, resulting in a less informative study. In addition, the abovementioned study used the principal component analysis method for data dimensionality reduction, which resulted in composite variables (i.e., principal components) that are ambiguous and poorly interpreted. In view of this, we added additional traits, especially cuticular traits, to the present study, as well as explored innovative methods of trait selection and fossil identification. This study helps to demonstrate the significance of cuticular traits for identifying fossil plant taxa and improving the accuracy of machine learning methods, effectively validating the scientific results and useful experience of previous researchers. In addition, the results of trait selection have important reference value for related research.
The application and popularity of machine learning methods rely on the continuous improvement of the paleontology knowledge base and fossil specimen discovery. For example, Zhou et al. (2020) systematically compiled data from Ginkgoales, revising the classification of some genera and species. This constantly updated knowledge based on research by human scholars is the basis for computers being able to better simulate human identification skills. Subsequently, Wang et al. (2022) employed cluster analysis to investigate the affinities and systematic classification of Ginkgophyta. However, in this study, perhaps because of the limited learning ability of unsupervised learning algorithms when facing complex classification problems, the classification results of the two abovementioned were somewhat different. Nevertheless, machine learning methods provide essential validation material for traditional taxonomic studies and show promising applications in fossil identification. Convolutional neural networks and deep learning methods offer solutions for identifying fossils in images, but these methods are more suited for identifying fossils at the broad class level rather than at the genus and species level (Duan, 2023). Considering the limited amount of image sample data available for small taxa and the scientific need for identification at the genus and species level, trait analysis based on manual statistics is undoubtedly a more feasible option at this stage.
Machine learning, as a disruptive innovation, has exceeded human abilities in some areas. However, machine learning cannot replace human scientists in paleontological research. It can serve as a complementary tool to enhance research efficiency and promote quantitative approaches to the subject. For instance, Peking University has built a practical platform for quantitative analysis of paleontological morphology based on the open source software RStudio-Server (Xiong et al., 2022), whose rich analysis algorithms provide good support for researchers to carry out quantitative analysis, machine learning, and visualization of paleontological morphology. However, considering the serious difficulties in digitizing large-scale fossil materials, it will take extraordinary effort from more researchers and additional breakthroughs in advanced technologies to truly realize the widespread application of machine learning in paleontology (Wilf et al., 2016, 2021).
CONCLUSIONS
(1) Using cluster analysis, 35 species of the order Czekanowskiales were clustered into three major groups. Species belonging to the same genus as defined by traditional taxonomy showed a high level of clustering. These results provide quantitative analytical evidence for the traditional taxonomy of Czekanowskiales.
(2) For supervised machine learning, macro traits play a more significant role in identifying Czekanowskiales at the generic level, while cuticular traits are more important in identifying Czekanowskiales at the species level.
(3) Multiple supervised learning algorithms were evaluated to determine the best algorithms for different application scenarios: the CART algorithm performed best at the genus level and species-level identification based on macro traits, while the LR algorithm performed best at species-level identification based on mixed traits. Notably, the accuracy of identification can be significantly improved for all algorithms with the inclusion of cuticular traits.
Unfortunately, due to the paucity of specimen data for some Czekanowskiales species, species-level identification of these specimens is not possible. However, given the good performance of the macro trait datasets in species-level identification, this approach may be more directly applicable to future identification efforts of other Czekanowskiales species. Moreover, active exploration of trait selection and genus and species identification methods will provide guidance or recommendations for identifying more challenging plant taxa, such as Mesozoic ferns and Cenozoic angiosperms.
ACKNOWLEDGEMENT
This study was supported by the National Natural Science Foundation of China (No. 41972020), the State Key Laboratory of Palaeobiology and Stratigraphy (Nanjing Institute of Geology and Palaeontology, CAS) (No. 193129), and the Northwest Normal University Postgraduate Research Grant 2021 (2021KYZZ01041).
REFERENCES
Adams, D.C., Rohlf, F.J., and Slice, D.E. 2004. Geometric morphometrics: ten years of progress following the ‘revolution’. Italian Journal of Zoology, 71:5–16.
https://doi.org/10.1080/11250000409356545
Albon, C. 2018. Machine Learning with Python Cookbook: Practical Solutions from Preprocessing to Deep Learning. O’Reilly Media, Sebastopol.
Chen, F., Dou, Y.W., and Huang, Q.S. 1984. The Jurassic Flora of West Hills Beijing. Geology Press, Beijing. (In Chinese)
Chen, F., Meng, X.Y., and Ren, S.Q. 1988. Early Cretaceous Flora and Coal-bearing Sites of the Fuxin and Tiefa Basins, Liaoning. Geology Press, Beijing. (In Chinese)
Deng, S.H. 1995. Early Cretaceous flora of Huolinhe Basin, Inner Mongolia. Geology Press, Beijing. (In Chinese)
Deng, S.H. and Lu, Y.Z. 2008. Fossil plants from Lower Cretaceous of the Jiuquan Basin, Gansu, northwest China and their palaeoclimatic implications. Acta Geologica Sinica, 82:104–114. (in Chinese, with English abstract)
https://doi.org/10.3321/j.issn:0001-5717.2008.01.013
Du, Y.S. and Tong, J.N. 2009. Introduction to Palaeontology and Historical Geology, 2nd edition. China University of Geosciences Press, Wuhan. (In Chinese)
Duan, X. 2023. Automatic identification of conodont species using fine-grained convolutional neural networks. Frontiers in Earth Science, 10:1046327.
https://doi.org/10.3389/feart.2022.1046327
Florin, R. 1936. Die fossilen Ginkgophyten von Franz-Joseph-Land nebst Erörterungen über vermeintliche Cordaitales mesozoischen Alters. I. Spezieller Teil. Palaeontographica Abteilung B, 81:71–173.
Geurts, P., Ernst, D., and Wehenkel, L. 2006. Extremely randomized trees. Machine learning, 63:3–42. https://doi.org/10.1007/s10994-006-6226-1
Gomolitzky, N.P. and Khudayberdyev, R.H. 1978. About the Middle Asia Jurassic flora. The Paleobotanist, 25:104–108.
https://doi.org/10.54991/jop.1976.1001
Gromov, V.V., Lebedev, E.L., and Stavtsev, A.L. 1980. Geological structure of Ul'insk depression Okhotsk belt. Sovetskaya Geologiya, 3:74–85. (In Russian)
Harris, T.M. 1951. The Fructification of Czekanowskia and Its Allies. Philosophical Transactions of the Royal Society B: Biological Sciences, 235:483–508.
https://doi.org/10.1098/rstb.1951.0006
Harris, T.M. 1979. The Yorkshire Jurassic Flora V. Coniferales. British Museum (Natural History), London.
Harris, T.M., Millington, W., and Miller, J. 1974. The Yorkshire Jurassic Flora IV. 1. Ginkgoales; 2. Czekanowskiales. British Museum (Natural History), London.
Heer, O. 1876. Beiträge zur Jura-Flora Ostsibiriens und des Amurlandes (in Flora fossilis arctica, Bd, 4, H. 2). Mémoires de l’Académie impériale des sciences de St. Pétersbourg, 25:1–122.
Holdener, E.J. 1994. Numerical taxonomy of fenestrate bryozoans: evaluation of methodologies and recognition of intraspecific variation. Journal of Paleontology, 68:1201–1214.
https://doi.org/10.1017/S0022336000034193
Huang, W. 2016. The discovery of Jehol biota and fossil plants from southeastern Jilin, China. Unpublished PhD Thesis, Jilin University, Changchun, Jilin, China. (In Chinese, with English abstract)
Huang, W., Sun, C.L., Wang, H.S., Na, Y.L., Li, Y.F., and Li, T. 2016. New Phoenicopsis leaves (Czekanowskiales) from the Middle Jurassic Daohugou Biota, China and their roles in phytogeographic and paleoclimatic reconstruction. Palaeoworld, 25:388–398.
https://doi.org/10.1016/j.palwor.2015.09.004
Huang, W., Dilcher, D.L., Wang, H.S., Na, Y.L., Li, Y.F., Li, T., and Sun, C.L. 2017. First record of Sphenarion (Czekanowskiales) with epidermal structures from the Middle Jurassic of Inner Mongolia, China. Palaeoworld, 26:510–518.
https://doi.org/10.1016/j.palwor.2016.05.005
Ji, Y.Z. 2020. Microstructure of several fossil plants from Permian and Cretaceous in Hexi area, Gansu and geological significance. Unpublished MSc Thesis, Lanzhou University, Lanzhou, Gansu, China. (In Chinese, with English abstract)
Jia, H., Sun, B.N., David, K.F., and Meng, X.N. 2017. The application of principal component analysis to the identification of Fagaceae leaf fossils. Acta Palaeontologica Sinica, 56:538–548. (In Chinese, with English abstract)
Kiritchkova, A.I., Travina, T.A., and Bistritskaja, L.I. 2002. The Phoenicopsis Genus: Systematics, History, Distribution and Stratigraphic Significance, in Biochronology and Correlation of Phanerozoic of Oil and Gas Basins of the Russia, Issue 3. VNIGRI Publications, Saint-Petersburg. (In Russian)
Kirichkova, A.I., Kostina, E.I., and Nosova, N.V. 2016. Continental Jurassic stratigraphy of Irkutsk amphitheater. Neftegazovaya Geologiya, Teoriya i Praktika, 11:19–20. (In Russian)
https://doi.org/10.17353/2070-5379/19_2016
Krassilov, V.A. 1968. A new group of Mesozoic gymnosperms – Czekanowskiales. Doklady Akademii Nauk SSSR, 178:942–945. (In Russian)
Krassilov, V.A. 1970. Approach to the classification of Mesozoic Ginkgoalean plants from Siberia. The Palaeobotanist, 18:12–19.
https://doi.org/10.54991/jop.1969.814
Li, J. 2018. Ginkgophyte fossils from the Middle Jurassic in Huating, Gansu province and paleoatmospheric CO2 reconstruction. Unpublished MSc Thesis, Lanzhou University, Lanzhou, Gansu, China. (In Chinese, with English abstract)
Li, P.J., He, Y.L., Wu, X.W., Mei, S.W., and Li, B.Y. 1988. Early and Middle Jurassic Strata and Their Floras from Northeastern Border of Qaidam Basin, Qinghai. Nanjing University Press, Nanjing. (In Chinese, with English abstract)
Li, Q.J. 2016. Plant composition and paleoenvironmental analysis of Middle Jurassic flora in Huating, Gansu province. Unpublished MSc Thesis, Lanzhou University, Lanzhou, Gansu, China. (In Chinese, with English abstract)
Li, T. 2018. The Late Triassic Yangcaogou flora from Beipiao, Liaoning of China and the reconstruction of plant ecosystem. Unpublished PhD Thesis, Jilin University, Changchun, Jilin, China. (In Chinese, with English abstract)
Li, T., Li, Y.F., Na, Y.L., Huang, W., and Sun, C.L. 2014. Discovery of subgenus Phoenicopsis (Culgoweria) from Middle Jurassic of Ordos Basin, Inner Mongolia. Global Geology, 33:524–534. (In Chinese, with English abstract)
Li, Y.F., Sun, C.L., Li, T., Na, Y.L., Chen, Y.J., and Xing, D.H. 2015. Solenites (Czekanowskiales) from the Late Mesozoic Jehol Biota of southeastern Jilin, China and its paleoclimatic implications. Acta Geologica Sinica (English Edition), 89:1088–1102.
https://doi.org/10.1111/1755-6724.12516
Lin, H.P., Sun, C.L., and Yuan, Q.Y. 1993. The application of robust princial component analysis to Early Jurassic floristic division of Eurasia continent. Journal of Jilin University, 2:219–223. (In Chinese, with English abstract)
Lindley, J. and Hutton, W. 1834. The Fossil Flora of Great Britain, v. 2. James Ridgway, London.
Liu, J., Ma, L.T., Peng, L., Chen, Y.Q., Zhang, L., Fan, J.J., and Yan, D.F. 2016. Cuticular of Czekanowskia (Vachrameevia) shiguaiensis from the Middle Jurassic in Baojishan Basin, Gansu and its paleoenviromental significance. Global Geology, 35:909–919. (In Chinese, with English abstract)
https://doi.org/10.3969/j.issn.1004-5589.2016.04.001
Liu, X.K. and Song, H.J. 2020. Automatic identification of fossils and abiotic grains during carbonate microfacies analysis using deep convolutional neural networks. Sedimentary Geology, 410:105790.
https://doi.org/10.1016/j.sedgeo.2020.105790
Liu, X.K., Jiang, S.Y., Wu, R., Shu, W.C., Hou, J., Sun, Y.F., Sun, J.R., Chu, D.L., Wu, Y.Y., and Song, H.J. 2023. Automatic taxonomic identification based on the fossil image dataset (>415,000 images) and deep convolutional neural networks. Paleobiology, 49:1–22.
https://doi.org/10.1017/pab.2022.14
Lv, X.D. 2010. Fossil fruit of Trapa L. from the Miocene in eastern Zhejiang and its paleoenvironment. Unpublished MSc Thesis, Lanzhou University, Lanzhou, Gansu, China. (In Chinese, with English abstract)
Mairot, C., Guignard, G., Yang, X.J., and Zhou, Z.Y. 2014. Cuticle micro-and ultrastructure of Suturovagina Chow et Tsao (Cheirolepidiaceae): taxonomic and palaeoecological implications. Review of Palaeobotany and Palynology, 205:9–21.
https://doi.org/10.1016/j.revpalbo.2014.02.011
Marchant, R., Tetard, M., Pratiwi, A., Adebayo, M., and de Garidel-Thoron, T. 2020. Automated analysis of foraminifera fossil records by image classification using a convolutional neural network. Journal of Micropalaeontology, 39:183–202.
https://doi.org/10.5194/jm-39-183-2020
Mi, J.R., Zhang, C.B., and Sun, C.L. 1986. On the problem of the division of Late Triassic palaeobotanic province in the north of China. Journal of Jilin University, 4:1–9. (In Chinese, with English abstract)
Mi, J.R., Yuan, Q.Y., Sun, C.L., and Hou, H.T. 1991. Classification of some fossil Ginkgolean leaves by computerization. Journal of Integrative Plant Biology, 33:297–303+337–338.
Mi, J.R., Sun, C.L., Sun, Y.W., Cui, S.S., and Ai, Y.L. 1996. Early-Middle Jurassic Phytoecology and Coal-accumulating Environments in Northern Hebei and Western Liaoning. Geology Press, Beijing. (In Chinese)
Miao, Y.Y. 2006. Ginkgoales and Czekanowskiales from the Middle Jurassic in western Junggar Basin of Xinjiang, China. Unpublished PhD Thesis, Jilin University, Changchun, Jilin, China. (In Chinese, with English abstract)
Nathorst, A.G. 1919. Ginkgo adiantoides (Unger) Heer im Tertiär Spitsbergens nebst einer kurzen Übrigen der übrigen fossilen Ginkgophyten desselben Landes. Geologiska Föreningen I Stockholm Förhandlingar, 41:234–248.
Pedregosa, F., Varoquaux, G., Gramfort, A., Michel, V., Thirion, B., Grisel, O., Blondel, M., Prettenhofer, P., Weiss, R., Dubourg, V., Vanderplas, J., Passos, A., Cournapeau, D., Brucher, M., Perrot, M., and Duchesnay, É. 2011. Scikit-learn: Machine learning in Python. The Journal of Machine Learning Research, 12:2825–2830.
Qian, L.J, Bai, Q.Z., Xiong, C.W., Wu, J.J., Xu, M.Y., He, D.C., and Wang, S.Y. 1987. Mesozoic Coal-bearing Strata of Southern China. China Coal Industry Publishing House, Beijing. (In Chinese)
Sabour, S., Frosst, N., and Hinton, G.E. 2017. Dynamic routing between capsules. Advances in neural information processing systems, 1–30.
https://doi.org/10.48550/arXiv.1710.09829
Samylina, V.A. 1972. Systematics of the genus Phoenicopsis, in Vakhrameev, V., ed. Mesozoic Plants (Ginkgoales and Czekanowskiales) of Eastern Siberia. Proceedings of the Geological Institute of the Russian Academy of Sciences, 230:44–81. (In Russian)
Samylina, V.A. and Kiritchkova, A.I. 1991. The genus Czekanowskia (Systematics, History, Distribution and Stratigraphic Significance). Nauka, Leningrad. (In Russian)
Samylina, V.A. and Kiritchkova, A.I. 1993. The genus Czekannowskia Heer: principles of systimatics, range in space and time. Review of Palaeobotany and Palynology, 79:271–284.
https://doi.org/10.1016/0034-6667(93)90026-Q
Si, X.J. and Li, X.X. 1963. Fossil Plants of China (Mesozoic Plants from China). Science Press, Beijing. (In Chinese)
Sinitsa, S.M. 1985. Jurassic Continental Biocoenosis of Southern Siberia and Surrounding Areas. Nauka, Moscow. (In Russian)
Sun, B.N., Yan, D.F., Xie, S.P., and Wang, Y.D. 2009a. Fossil Plant Stomata and Carbon Isotope Analysis and Applications. Science Press, Beijing. (In Chinese)
Sun, C.L., Dilcher, D.L., Wang, H.S., Sun, G., and Ge, Y.H. 2009b. Czekanowskia from the Jurassic of Inner Mongolia, China. International Journal of Plant Sciences, 170:1183–1194.
https://doi.org/10.1086/605869
Sun, C.L., Na, Y.L., Dilcher, D.L., Wang, H.S., Li, Tao., and Li, Y.F. 2015. A new species of Phoenicopsis subgenus Windwardia (Florin) Samylina (Czekanowskiales) from the Middle Jurassic of Inner Mongolia, China. Acta Geologica Sinica (English Edition), 89:55–69.
https://doi.org/10.1111/1755-6724.12394
Sun, F.S. 1989. On subdivision of Angara floral province in light of cluster analysis. Acta Palaeontologica Sinica, 28:773–785. (In Chinese, with English abstract)
Sun, G. 1987. Cuticles of Phoenicopsis from northeast China and Inner Mongolia with discussion on its taxonomy. Acta Palaeontologica Sinica, 26:662–681+688+767–770. (In Chinese, with English abstract)
Sun, G., Zheng, S.L., Dilcher, D.L., Wang, Y.D., and Mei, S.W. 2001. Early Angiosperms and Their Associated Plants from Western Liaoning, China. Shanghai Scientific and Technological Education Publishing House, Shanghai. (In Chinese)
Sun, K.Q., Cui, J.Z., and Wang, S.J. 2016. Fossil Gymnosperms in China (I), vol. 3. Higher Education Press, Beijing. (In Chinese)
van Bocxlaer, B. and Schultheiß, R. 2010. Comparison of morphometric techniques for shapes with few homologous landmarks based on machine-learning approaches to biological discrimination. Paleobiology, 36:497–515.
https://doi.org/10.1666/08068.1
Wang, J., Zhang, Q.X., and Shen, G.L. 1999. Permian phytogeography of Cathaysian Flora in China in the light of cluster analysis. Acta Palaeontologica Sinica, 38:530–543. (In Chinese, with English abstract)
https://doi.org/10.3969/j.issn.0001-6616.1999.04.010
Wang, J.J., Xin, C.L., Wang, L.H., Zhang, Y.M., Jiao, Z.P., Di, G.Y., and Liu, S.X. 2022. Numerical taxonomy of Ginkgophyta fossils in China. Historical Biology, 34:2037–2052.
https://doi.org/10.1080/08912963.2021.1999939
Wang, L., Yang, T., and Sun, G. 2014. First discovery of Phoenicopsis (Phoenicopsis) neimengensis sp. nov. from Huolinhe coalfield in Inner Mongolia. Global Geology, 33:735-745. (In Chinese, with English abstract)
Wang, L.H. 2018. Study on quantitative analysis and tempo-spatial distribution of 42 species of Dicksoniaceae from China. Unpublished MSc Thesis, Northwest Normal University, Lanzhou, Gansu, China. (In Chinese, with English abstract)
Wang, Z.Q. 1984. Kingdom Plant. Tianjin Institute of Geology and Mineral Resources, Ministry of Geology and Mineral Resources. Paleontological Atlas of North China (II), Mesozoic Section. Geology Press, Beijing. (In Chinese)
Wei, Z.Y. 2018. Machine Learning: Python in Practice. Publishing House of Electronics Industry, Beijing. (In Chinese)
Wilf, P., Zhang, S., Chikkerur, S., Little, S.A., Wing, S.L., and Serre, T. 2016. Computer vision cracks the leaf code. Proceedings of the National Academy of Sciences, 113:3305–3310.
https://doi.org/10.1073/pnas.1524473113
Wilf, P., Wing, S.L., Meyer, H.W., Rose, J.A., Saha, R., Serre, T., Cúneo, N.R., Donovan, M.P., Erwin, D.M., Gandolfo, M.A., González-Akre, E., Herrera, F., Hu, S., Iglesias, A., Johnson, K.R., Karim, T. S., and Zou, X. 2021. An image dataset of cleared, x-rayed, and fossil leaves vetted to plant family for human and machine learning. PhytoKeys, 187:93–128.
https://doi.org/10.3897/phytokeys.187.72350
Wilkinson, H.P. 1979. The plant surface. In Metcalf, C.R. and Chalk, L. (eds.), Anatomy of the Dicotyledons. 2nd edition. Clarendon Press, Oxford, UK.
Wu, S.Q. 1999. Upper Triassic plants from Sichuan. Series of the Nanjing Institute of Geology and Palaeontology, Chinese Academy of Sciences, 14:1–69. (In Chinese)
Wu, S.Q., Ye, M.N., and Li, B.X. 1980. Upper Triassic and Lower and Middle Jurassic plants from the Hsiangchi Group, western Hubei. Collected Works of the Nanjing Institute of Geology and Palaeontology, Chinese Academy of Sciences, 14:63–178. (In Chinese)
Wu, X.W. 1993. Index of generic names founded on Mesozoic-Genozoic specimens from China in 1865–1990. Acta Palaeontologica Sinica, 4:495–524. (In Chinese, with English abstract)
Xiao, L., Wang, X., Li, X.M., Li, X.C., Jia, H., Sun, N., Liang, J.Q., Wang, Q., Li, J.X., and Yong, Y.Y. 2020. Numerical taxonomy of Miocene Trapa L. fossil fruits from eastern Zhejiang, China. Earth Science Frontiers, 27:110–123. (In Chinese, with English abstract)
Xin, C.L., Wang, J.J., Wang, L.H., and Zhang, Y.M. 2019a. Numerical taxonomy and Bayes discriminant analysis on 42 fossil species in Dicksoniaceae from China. Acta Geologica Sinica (English Edition), 93:183–198.
https://doi.org/10.1111/1755-6724.13777
Xin, C.L., Wang, L.H., Ji, J.J., Zhang, Y.M., and Wang, J.J. 2019b. Geological age and palaeogeographical study of the Yaojie Flora in Gansu province. Acta Geologica Sinica, 93:302–316. (In Chinese. with English abstract)
https://doi.org/10.3969/j.issn.0001-5717.2019.02.003
Xiong, W.T., Xue, J.Z., Zhang, J.J., Guo, Y.J., and Cui, Y. 2022. Teaching Platform of Quantitative Paleontology Based on R Software: Theory, Practice and Experiment. China Modern Educational Equipment, 5:1–4. (In Chinese, with English abstract)
Xu, Y.X., Dai, Z.Y., Wang, J.B., Li, Y., and Wang, H.Y. 2020. Automatic recognition of palaeobios images under microscope based on machine learning. IEEE Access, 8:172972–172981.
https://doi.org/10.1109/ACCESS.2020.3024819
Yan, D.F. and Sun, B.N. 2004. The discovery of Solenites murrayana L. et H. in Yaojie coal field, Gansu and its geological significance: Journal of Lanzhou University (Natural Sciences), 40:84–88. (In Chinese, with English abstract)
https://doi.org/10.3321/j.issn:0455-2059.2004.03.019
Yang, T., Liang, F., Bai, S.C., and Guo, X.R. 2018. New discovery of Solenites (Czekanowskialean) from Upper Triassic Haojiagou Formation in Urumqi, Xinjiang. Global Geology, 37:1–8. (In Chinese, with English abstract)
Zhou, Z.Y. and Guignard, G. 1998. Leaf cuticle ultrastructure of two Czekanowskialeans from the Middle Jurassic Yima Formation of Henan, China. Review of Palaeobotany Palynology, 102:179–187.
https://doi.org/10.1016/S0034-6667(98)80018-3
Zhou, Z.Y. 1984. Early Liassic plants from southwest Hunan, China. Science Press, Beijing. (In Chinese)
Zhou, Z.Y. 2003. Mesozoic Ginkgoaleans: phylogeny, classification and evolutionary trends. Plant Diversity, 4:377–396. (In Chinese. with English abstract)
Zhou, Z.Y., Yang, X.J., and Wu, X.W. 2020. Palaeobotanica Sinica: Ginkgophytes. Science Press, Beijing. (In Chinese)
Zollanvari, A. 2023. Machine Learning with Python: Theory and Implementation. Springer Nature, New York.
