

 Flatbed scanners as versatile tools for studying surface details of compression fossils
Article number: 27.2.a27
https://doi.org/10.26879/1353
Copyright Palaeontological Association, May 2024
Author biographies
Plain-language and multi-lingual abstracts
PDF version
Submission: 1 November 2023. Acceptance: 4 May 2024.
ABSTRACT
Compression fossils can be challenging to interpret, especially when necessary information is not apparent from colour alone, e.g., when there is little organic matter preserved. In this case, the shape of the fossil’s surface can often still provide much information about the morphology of the preserved organism. Stereo photography and recording images with incident light from different directions (Multi Light Image Collections) are suitable methods to retrieve surface details for inspection or further processing. It has been shown that CCD-type flatbed scanners (one of two widespread scanner architectures) act as cameras with cylindrical projections. The displacement of subjects perpendicular to the scanning direction allows capturing stereographic image sets, like using regular photographic camera lenses, which approximate a point projection. This technique is particularly well-suited for documenting compression fossils. As most CCD-type flatbed scanners illuminate the scanned area with a single movable lamp, the resulting images are evenly illuminated from one direction. This can be utilized to create Multi Light Image Collections by rotating the subject on the scanner surface. When rotated by defined angles, standard photometric stereo programs can be used to retrieve digital models of the surface, such as normal maps (a graphical representation of the surface shape). While consumer grade CCD-type flatbed scanners are not suited for all size ranges of fossils and desired image magnifications, for many compression fossils they can serve as a versatile tool for documenting surface shapes, especially when dedicated imaging equipment is unavailable.
Mario Schädel. Institute for Evolution and Ecology, University of Tübingen, Auf der Morgenstelle 28, 72076 Tübingen, Germany. (Corresponding author) mario.schaedel@gmail.com
Richard Schubert. Berlin-3D-Art, Blücherstr. 55, 10961 Berlin, Germany. schubert@berlin-3d-art.de
Keywords: Stereoscopic imaging; stereo anaglyph; Multi Light Image Collection; Photometric Stereo; Reflectance Transformation Imaging; RTI
Final citation: Schädel, Mario and Schubert, Richard. 2024. Flatbed scanners as versatile tools for studying surface details of compression fossils. Palaeontologia Electronica, 27(2):a27.
https://doi.org/10.26879/1353
palaeo-electronica.org/content/2024/5216-scanning-fossil-surfaces
Copyright: May 2024 Palaeontological Association.
This is an open access article distributed under the terms of the Creative Commons Attribution License, which permits unrestricted use, distribution, and reproduction in any medium, provided the original author and source are credited.
creativecommons.org/licenses/by/4.0
INTRODUCTION
Flatbed Scanners
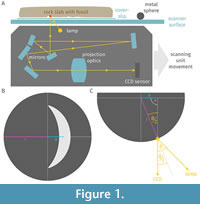 Flatbed scanners, often termed document scanners, are as the latter name suggests mainly used to scan printed documents but can also be used for other materials (Buchmann, 2011; Vasco et al., 2014; Song et al., 2017). In flatbed scanners, image data are captured sequentially, while a carriage unit moves across a glass window, behind which the subject is placed (Figure 1A). The final image is then formed by interpolating and stitching together lines of image data, unlike in digital cameras, where a rectangular image sensor captures all data for the final image almost simultaneously. Flatbed scanners can be categorized into two primary architectures based on the type of sensor and optics they employ. Contact Image Sensor (CIS) scanners use a linear array of sensors spanning the entire width of the scan area. Each individual sensor is equipped with a small Gradient Index (GRIN) lens and an LED light source (Göröcs and Ozcan, 2014). While being very energy efficient, the depth of field of these devices is very small (Wang, 2000), preventing CIS type scanners from producing sharp images of most fossils (Bybee and Branham, 2008). In contrast, Charge Coupled Device (CCD) type scanners, like photographic cameras, rely on a unified optical system. To accommodate the working distance of the optical system within a compact, movable unit, consumer-grade CCD-type scanners utilize a set of mirrors to split the optical path (Figure 1A, Figure 2E; Wang, 2000). The operating principle of such scanners combines two projection types: 1) the projection of the lens, which in simple terms can be viewed as a point projection and occurs perpendicular to the scan movement, and 2) a parallel projection, which arises from stitching together rows of image data along the scanning direction. This results in a cylindrical projection in the final image (Schubert, 2000).
 Flatbed scanner specifications often include the image resolution, measured in dpi (dots per inch), referring to the density of pixels relative to the true size of the scanned subject. Since the linear CCD sensor array captures only one row of pixels at the time, the image resolution is constrained by the sensor resolution and the precision of the drive moving the carriage unit. Digital interpolation ensures that in the resulting image file, pixels correspond to quadratic areas. The mechanical precision in modern scanners allows recording overlapping lines of pixels, which means that the digital resolution does not necessarily reflect the optical performance of the scanner (Simcoe, 2009).
In document or photo scanners of the CCD-type architecture, incident lighting is provided by either one or two lamps, spanning the entire width of the scan area. These lamps are in the carriage unit and their light is not coaxial with the optical path (Figure 1A; Göröcs and Ozcan, 2014). In a dual-lamp system, often only one lamp is used during the main scan while the other aids to detect debris or scratches in a consecutive scan (Seiko Epson Corporation, 2005). Because the lamps span the entire recorded area, the illumination they provide is very even, yet not diffuse, but highly directional (Schubert, 2000; Haug et al., 2013).
Flatbed scanners have been used as imaging devices for palaeontological objects, such as insect compression fossils (Beckemeyer and Byers, 2001; Liu and Ren, 2008; Li and Ren, 2009) and compression fossils of other arthropods (Haas et al., 2003) and even large insect inclusions in amber (Staniczek, 2002). Further, flatbed scanners have been used to document serial grinding sections, which have been used to generate three-dimensional models of buried organisms (Hammer, 1999; Pascual-Cebrian et al., 2013).
Stereoscopic Imaging
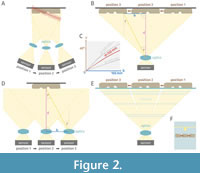
Stereoscopy is a technique that utilizes the human binocular vision to create an impression of depth from a set of two images. For this, the images must show the same scene from slightly different angles (Wheatstone, 1838). To retrieve sets of stereoscopic images from fossils, the fossils must be imaged at least twice from slightly different angles. A change in viewing angle can be achieved by tilting a camera setup (Figure 2A) relative to the photographed subject. This requires the least amount of unused field of view (the subject can fill the entire field of view) but depending on the scale of the fossil and the desired field of view, the depth of field might be not large enough so that the entire subject is in focus, even though the depth of field might be sufficient for a single image (Figure 2A). Another option is to either move the subject within the field of view (Figure 2B) or to move the field of view relative to the subject (Figure 2D), emulating the distance between the pair of human eyes (“stereo base”). However, for close-up photography, the latter approach only works with relatively large lens opening angles (short focal lengths), which for a given subject determine the maximum achievable amount of parallax. The viewing angle γ can be described by the distance d between the lens centre and the focal plane and the distance b of the viewed point to the centre of the field of view (Figure 2B):
γ = arctan(b/d)
Flatbed Scanners as Stereoscopic Cameras
The optical properties of a CCD-type scanner allow creating a stereoscopic effect by translating a subject perpendicular to the movement of the carriage unit (Figure 2F). Translations in the opposite direction, however, do not lead to a stereoscopic effect because the scanner lens moves along this axis during the scan (Schubert, 2000). With CIS type scanners, it is impossible to achieve a stereoscopic effect because they do not have a unified optical system (parallel projection). In CCD-type scanners, along the midline the view onto the subject is perfectly perpendicular to the scanner surface, i.e., the viewing angle γ is zero. The greater the displacement from the midline, in either direction, the more the viewing angle deviates from zero. This relationship between the displacement from the midline and the viewing angle is not linear (Figure 2C) and depends on the opening angle of the lens, which manifests in the distance between the lens centre and the focal plane, which is just above the glass window of the scanner (Figure 2B, E). When used to scan documents, the difference in viewing angle is negligible, as such flat subjects produce little parallax. However, for subjects with a higher relief, such as many compression fossils, the difference in viewing angle can be large enough to produce stereoscopic images with a well perceivable impression of depth. This technique has already been leveraged to produce stereoscopic images of fossils - notably, this has been used to create “virtual peels” of fossils by swapping the left and right image to invert the relief (Haug et al., 2013).
Stereoscopic Visualisation Techniques
There are several ways to view stereoscopic imagery, all of which have in common that one image is only visible by the left eye and the other by the right eye. This can be achieved without technical aid by looking at vertically aligned side-by-side images (small left-right distances lead to easier perception and less eye strain). This is referred to as “free-viewing”, which requires unimpaired binocular vision and to have learned at least one of two techniques: “parallel viewing” (left-eye image on the left side) or “cross-eyed viewing” for the reversed image order, for which there are plenty of tutorials freely available (Vogt and Wagner, 2012). Aside from free viewing, printed or on-screen image pairs can also be viewed with the aid of mirrors or lenses (Wheatstone, 1838; McKay, 1951; Wainman et al., 2020). Other forms of technical aid are used to separate the left and right view of horizontally aligned stereoscopic image pairs or sequences that are superimposed, interleaved, or quickly alternating. This includes several types of filter or shutter glasses and lenticular lens arrays (Schratt and Riedl, 2005). Lenticular lens arrays allow to accommodate more than two views, producing a motion parallax effect alongside the autostereoscopic impression. Lenticular lens arrays can be attached to printed stereoscopic imagery (Schubert, 2002; Schubert and Bornowski, 2013), but can also be used in conjunction with digital screens (Berkel et al., 1996).
In stereo anaglyphs the two views are superimposed, forming a single image, of which the views can be separated by means of a pair of complementary filters (Rollmann, 1853). Since stereo anaglyphs require only inexpensive cardboard glasses with film filters and can be easily embedded in both digital and printed documents, they are widely used in natural history publications, with red cyan being the most widespread filter colour combination (e.g., Haug et al., 2013; Sturm, 2020). Pairs of images can be converted into stereo anaglyphs using dedicated programs or feature-rich raster graphic editors (Turnnidge and Pizzanelli, 1997; Purnell, 2003).
There are two common artefacts of stereoscopic imagery. The first - “binocular rivalry” - is not limited to stereo anaglyphs and occurs when the views differ more than anticipated, replacing the stereoscopic effect with a flickering involuntary alternation between the views (Blake, 1989; for anaglyph-specific mitigation see Krupev and Popova, 2009). The other common artefact, known as “crosstalk” or “ghosting”, is specific to stereo anaglyphs and occurs when the filters fail to block the unintended image (Dubois, 2001; Woods and Harris, 2010). Mitigation approaches include optimizing the horizontal alignment (Ideses and Yaroslavsky, 2005), creating anaglyphs from desaturated images (e.g., Hörnig et al., 2016) or applying colour transformations (decreases the colour accuracy; Dubois, 2001, 2009; Krupev and Popova, 2008). Pairs and sequences of stereoscopic images can also be presented as videos or animated image files (e.g., Haug et al., 2012). While less suitable for precise examination, this representation is more accessible for viewers with impaired binocular and/or colour vision.
Recording and Processing Multi Light Image Collections
A rough approximation of the shape of photographed subjects is already possible using only a single image via an approach called “Shape from Shading” (Prados et al., 2006). More precise information about the shape of a subject can be retrieved from a set of images that share the same view but differ in direction of illumination, referred to as a Multi Light Image Collection (MLIC; Pintus et al., 2019). Photometric Stereo produces a model of a subject’s surface from such a set of images, where the orientation of each point on the surface is represented by the vector perpendicular to the surface, i.e., the normal vector (Woodham, 1980). The resulting normal vector orientation can be coded as RGB colour values, allowing the model to be stored and viewed as an image file (Klette, 2014). Photometric stereo allows to recover even fine surface details, which otherwise are only accessible through expensive dedicated tools like mechanical or optical surface scanners (MacDonald, 2011; Nam et al., 2016).
Another term that often occurs in the context of Multi Light Imaging is Reflectance Transformation Imaging (RTI). RTI comprises a set of techniques that either aim for photorealistic relighting or for highlighting surface details, such as through specular enhancement or diffuse gain (Malzbender et al., 2000, 2001). Initially being limited to a method called Polynomial Texture Mapping (Malzbender et al., 2001), the term RTI has been extended to other methods that share the aim of producing relightable scenes (Ponchio et al., 2019; Pintus et al., 2019).
While it is possible and, in some situations, even necessary to record a Multi Light Image Collection by manually repositioning a light source between image captures, this makes the image acquisition tedious and requires including reference spheres in all images to estimate the illumination directions (Cosentino, 2013; Kim et al., 2016; Porter et al., 2016). Ring or dome-shaped arrays of individually controllable lights allow for a much more rapid image acquisition and spare the need to include reference spheres during the actual documentation, as the illumination configuration can be kept constant, and the light directions can be estimated beforehand or afterwards (Hammer et al., 2002; Brecko and Mathys, 2020; Hughes-Hallett et al., 2021; Tao et al., 2021). There are commercially available ring or dome light setups for Multi Light Imaging; yet, such setups can also be custom-built from simple electronic components, making them much more affordable (e.g., Kinsman, 2016; Schädel, 2023).
Despite not having gained widespread adoption in the field of palaeontology, Multi Light Imaging has already been used as a tool to study and visualize the surface relief of various types of fossils (e.g., Hammer et al., 2002; Cui et al., 2018; Kenchington et al., 2018; Demers-Potvin et al., 2020, 2021; Park et al., 2022; Henkemeier et al., 2023). Normal maps have recently seen some adoption as a form of visualisation, especially in studies centred around fossils of winged insects (e.g., Béthoux et al., 2021; Chen et al., 2021; Cui et al., 2022; Schädel et al., 2022).
Multi Light Imaging Using Flatbed Scanners
CCD-type flatbed scanners produce an even but highly directional illumination. This allows to capture Multi Light Image Collections by rotating a subject on the scanner surface between consecutive scans, which changes the azimuthal illumination angle relative to the subject. If the rotation angles are known, a classical photometric stereo can be used to obtain a normal map of the subject. The feasibility of this technique has already been demonstrated for a selection of non-palaeontological objects (Clarkson et al., 2009; Pan and Skala, 2013; Skala et al., 2014).
CCD-type flatbed scanners can be used to capture surface relief information of subjects through stereoscopic imaging and through Multi Light Imaging. Still, flatbed scanners have rarely, respectively never, been used in this way to document fossils. In this study, we demonstrate the potential of the two imaging techniques using palaeontological samples. We provide a detailed description of the practical steps involved in capturing and processing the scan data, but also discuss the limitations of using flatbed instead of specialised equipment.
MATERIAL AND METHODS
Material
To demonstrate the potential of the herein described imaging techniques, we chose a set of insect compression fossils. The fossils range in size from less than 10 mm body size to almost 50 mm in length. The fossils documented in this study are all housed at the palaeontological collection of the University of Tübingen (GPIT). One specimen stems from the Toarcian (Early Jurassic) of Grassel (Zessin, 2010) in the municipality of Meine, near Braunschweig (northern Germany). The remaining specimens come from the Miocene fossil site Öhningen (e.g., Salvador et al., 2022) located in the Öhningen municipality, near Lake Constance (southern Germany).
Methods
Scanner operation. For all figured scans, an Epson Perfection V750 Pro (Seiko Epson Corporation) high-end consumer grade photo scanner was used. With the scanner being connected via USB, scans were performed using the vendor unspecific scan software XSane (GPL v.2 licence). The packages “epsonscan2” and “epsonscan2-non-free-plugin” for Linux were installed and upon start of XSane the“epson2:libusb:001:012” driver was selected. Despite the dual lamp system, by default only one lamp was active during the scan. Most scans were performed with a colour depth of 16 bit and a resolution of 4800 dpi (optical resolution of the scanner approximately 2450 dpi, Pascual-Cebrian et al., 2013). The scans were either saved as TIFF or PNG files. Except for one fossil, which was too large, the fossils were placed on a 60 mm by 50 mm microscope glass cover slip, to ease a precise movement on the scanner surface and to avoid scratches on the glass window of the scanner. Before further processing, the TIFF files were converted to PNG format using ImageMagick (https://imagemagick.org, GPL v.3 compatible license).
Stereoscopic imaging. For creating stereoscopic image sets, the fossil was placed on a cover slip and was scanned several times. Between each scan, it was moved by 10 mm perpendicular to the axis of the carriage unit movement. This was done with the aid of a ruler, which also made it easier to avoid rotation when manually translating the specimen.
Multi light imaging. To retrieve the surface shape of the fossils using a photometric stereo approach, the specimens were placed on a 60 mm by 50 mm glass cover slip, which itself was placed into a window of a custom-made laser-cut wooden turntable with a rotation scale. A laser-cut ready vector graphic drawing of the turntable is available from tthe Appendix and the accompanying data repository. Sequences of scans were performed, between which the specimens were rotated in known and equal steps. One specimen, which was too large to fit the window of the turntable, was manually rotated in steps of 90 degrees, using the near rectangular shape of the rock slab as a guidance.
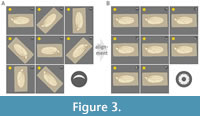 The images were aligned with respect to the scanned subject (uniform image background), transforming the image set into an MLIC (Figure 3). For some specimens, this was done in Fiji (Schindelin et al., 2012), using the plugin “Linear Stack Alignment with SIFT” (Lowe, 2004, restricted to non-commercial use); for other specimens this was done using the “rigid” alignment in TrakEM2 (part of Fiji, also using SIFT for alignment). In both cases, a “rigid” (translation plus rotation) transformation was specified. Since we manually set the field of view for each scan, the image files varied in dimension. To compensate for this, we opened all images separately in ImageJ and combined them into a stack (“Images to Stack”), resulting in uniform image dimensions. This step could be avoided by choosing the same image dimension for all scans (longer scan times due to recording more out of interest areas). As scanner images can be large in file size, using a virtual stack (not loaded into RAM) might be necessary depending on the computer hardware.
For comparison, one of the specimens was also documented using a custom ring light source with individually controllable power LEDs (Nichia NVSW219CT: 2 W, 280 lm, 5000K, CRI 80), which was mounted on a Laowa 25 mm 2.5-5× macro lens which itself was mounted on a Nikon D7200 DSLR camera. To cover all aspects of the fossil with in-focus images, a motorized focus-stacking stand with a XY stage (https://www.mjkzz.com) was used to record focus stacks and panoramic tiles. A Raspberry Pi Pico microcontroller was used to automate the MLIC capture process. In the motor control software (Focus Stacking Studio, https://www.mjkzz.com) an appropriately long waiting period was set to accommodate the MLIC capture process. More information on this setup, including build instructions and microcontroller code, are available from an open access poster (Schädel, 2023) and and the accompanying code repository (https://github.com/mcranium/MLIC-tools).
Approximating light directions. In a set of images where the subject is being rotated on a CCD-type flatbed scanner, the direction from which the most light hits the surface of the scanned subject has two components: (1) a rotation angle φ denoting how much the subject has been rotated, corresponding to the azimuth in a horizontal coordinate system and (2) an inclination angle θ denoting the angle between the light direction and the axis perpendicular to the scanner surface. The inclination angle θ is given by the design of the scanner and inversely relates to the altitude in a horizontal coordinate system. In principle, the inclination angle θ can be measured by disassembling the scanner and performing measurements on the relevant components. However, to avoid damage to the hardware, we refrained from this and instead approximated the inclination angle from reflection highlights in scans of small metal spheres (retrieved from ballpoint pens). We measured the radius r of the sphere and the distance a between the centre of the sphere and the centre of the specular reflection, which provides the inclination angle θ (Figure 1B-C):
θ = 2 * arcsin(a/r)
For an alternative method to determine the inclination angle, see Ng and Tajuddin (2001). Using the rotation and inclination angle, which for the herein used scanner was approximately 45 degrees, the light directions were converted into Cartesian coordinates, ignoring the true distance between the light source and the scanned point by setting the radius r to 1 for all illuminations:
x = r * sin(θ) * cos(ϕ)
y = r * sin(θ) * sin(ϕ)
z = r * cos(θ)
The calculations were performed using a custom R script, which was also used to save the Cartesian coordinates for each set of images into a text file (Appendix and accompanying data repository). Such text files, often referred to as “light point files”, are widely used in Multi Light Image Collection processing. Note that the exact formatting requirements for such files vary between programs.
Photometric stereo. Surface shape features of the fossils (in form of normal vectors) were reconstructed using the photometric stereo approach proposed by Woodham (1980). Two programs were used interchangeably to process the aligned images. Some of the herein figured fossils (GPIT-PV-112875, GPIT-PV-112869, GPIT-PV-112869) were processed using a set of ImageJ plugins (ImageJ-Photometric-Stereo-Tools, Marc Walton, MIT licence, available at https://github.com/NU-ACCESS/ImageJ-Photometric-Stereo-tools). This was done following the instructions available from the software repository, but leaving out the therein described light direction estimation, which did not produce satisfactory results for our samples. Instead, we used the light directions estimated through the above-described procedure. This was done by importing correctly formatted light point files (see plugin documentation and examples).
The remaining specimens (GPIT-PV-112874, GPIT-PV-112870, GPIT-PV-112875) were processed using the ‘Robust Photometric Stereo’ software package (Wu et al., 2010, MIT licence; Ikehata et al., 2012, 2014). We processed our images using a slightly modified version of the demonstration script from the software repository (available at https://github.com/yasumat/RobustPhotometricStereo, GPL), which was run under Python 3.10.4 on Linux. From the methods available in the software package, the conventional least-square regression (Woodham, 1980) was used, since there are almost no specular reflections in our input images that would require the use of more sophisticated, slower algorithms. Both of the herein used software implementations are in general platform independent, meaning they can be used on most modern desktop operating systems. With the aligned images available and the light directions estimated, it should be possible to use more user-friendly programs, such as RTIBuilder (https://culturalheritageimaging.org, GPL v. 3) or Relight (https://github.com/cnr-isti-vclab/relight, GPL v. 3) for recovering surface normals.
The resulting normal map images were optimized for better colour contrast and a more uniform appearance throughout the figure plates using the levels tool in GIMP 2.10.32 (https://www.gimp.org/, GPL v.3 licence) without modifying the individual RGB channel levels (exaggeration of the relief). A reference image of a sphere converted into a 2D normal map was produced using Blender v.3.3 (https://www.blender.org/, GPL v.3) to provide a visual aid for viewing the normal maps, by giving the impression of a convex (half-) spherical object being located next to the fossil (following Béthoux et al., 2021). Note that the two software implementations differ in how the normal vectors are coded as RGB values - a transformation between the two is possible by inverting colour channels (for simple conversions, see https://github.com/mcranium/MLIC-tools).
Microscopic imaging. Some objects were also photographed with a Keyence VHX 6000 digital microscope with automatic focus-merging and panorama stitching functionality. To record stereoscopic image sets, the optical apparatus of the microscope was tilted to the left and right symmetrically, using the inbuilt tilting mechanism of the microscope. For two specimens, the microscope vendor software was used to create to-scale (not exaggerated) height profile lines. The height information for the profile lines likely stems from a depth map created using a depth from defocus approach (exact mechanism unknown to the authors, proprietary closed source software).
Image manipulation and graphic design. Images were optimised for colour, brightness, contrast, and sharpness using GIMP. Inkscape 1.2.1 (https://inkscape.org/, GPL v.3 licence) was used to create the drawings and to arrange the figure plates.
Stereo representations. Stereo pairs were arranged in Inkscape using the horizontal guides for manual vertical alignment. To reduce eye strain, the horizontal distance between corresponding points was set to be as low as possible, while still showing the object at a sufficiently large scale. This was done by limiting the overall size on the figure plate and eliminating out of interest image areas on the right side of the left and the left side of the right image. Stereo anaglyphs, designed to be viewed with red-cyan filter glasses, were created with StereoPhotoMaker 6.28 (Masuji Suto, closed source freeware, available at https://stereo.jpn.org/eng/stphmkr/; Toeppen and Sykes, 2009). The images were manually aligned and for all herein figured anaglyphs the “SPM (red-cyan)” artefact mitigation option was used.
Rendering of artificial lighting conditions and depth map visualisation. Artificial lighting conditions were simulated in Blender (https://www.blender.org, GPL v.3) using the cycles render engine. A simple plane mesh, identical in dimension to the normal map, was placed into the scene and captured with an orthographic camera positioned perpendicular to the plane. The surface reflectiveness was modelled using the normal map. A virtual sunlight and diffuse background lighting was used to illuminate the scene. The surface colour and surface properties “Metallic”, “Specular”, and “Roughness” were adjusted to obtain the presented result.
A depth map was generated from the normal map using the program AwesomeBump (Krzysztof Kolasinski, https://github.com/kmkolasinski/AwesomeBump, GPL v.3), which utilizes a multi-grid iteration approach to calculate the surface heights from the surface normals (detailed explanation available from its software repository). The depth map was then used in Blender to displace vertices of a densely gridded plane mesh (“Displace” modifier). Subsequently, one of the original scanned images was mapped onto the plane as a colour texture. The resulting model was then artificially lit and captured using a virtual camera, with and without the stereo anaglyph mode enabled.
RESULTS
Image Quality
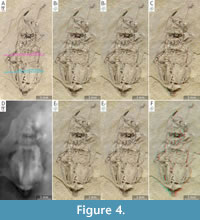 In the sample of fossils we documented, which exclusively consisted of insect compression fossils, the image quality of the flatbed scanner was sufficient to document most aspects of the overall morphology (Figure 4B, E). The image quality in terms of resolution and sharpness comes close to that of images taken with a basic macrophotography setup. However, high-magnification photography or microscopy can produce images of distinctly higher quality (Figure 4A). The illumination achieved with the flatbed scanner appeared even and directional, producing distinct shadows in subjects with a steep relief.
Stereoscopy
In stereographic image sequences created by subject translation on the flatbed scanner pairs resulting from larger translation (larger “stereo base”) distance showed a distinctly higher perceived depth, regardless of the viewing mode (Figure 4B-C vs. 4E-F). By recording such sequences of images with increasing left-right displacement, image pairs with desired depth perception (natural or exaggerated relief) can be conveniently chosen afterwards. Even image pairs with a strongly exaggerated perceived relief appeared to be free of conspicuous artefacts and subjectively appeared easy to view (parallel viewing and stereo anaglyphs, Figure 4E-F). Conversely, stereo pairs and anaglyphs created by tilting the optical apparatus of the digital microscope produced increasingly more eye strain at larger tilting angles (Figure 5A-B vs. D-E). This is also apparent from the stereo anaglyphs, when they are looked at without stereo glasses - the stereo anaglyphs corresponding to large tilt angles show a less natural appearing colour, because of larger left-right distances between corresponding points.
Multi Light Image Collections
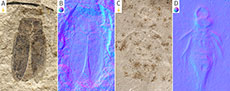
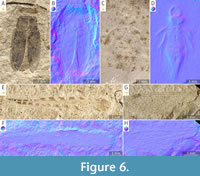 For many of the specimens we had at hand - all of them being compression fossils - it was possible to record Multi Light Image Collections and produce normal maps of acceptable quality. In some cases, the recorded scans could not be aligned successfully using automatic image alignment tools, i.e., after the alignment many aspects of the fossils were still not aligned well enough to produce a normal map without severe artefacts (see discussion below). Except for the cases where the alignment was deemed unsuccessful, the normal maps produced from the MLICs recorded with the flatbed scanner were generally of decent quality. In most of the fossils we documented, many morphological features were already apparent from the colour and brightness of the fossilized cuticle. However, in the case of a fossil dragonfly nymph without exposed cuticle, the normal map allowed to visualize many important morphological features, which were not directly apparent from a single scan due to the lack of colour and brightness contrast of the fossil to the matrix and due to obstructing sediment colouration (Figure 6C vs. 6D). The flatbed scanner normal maps also allowed to visualize three-dimensional aspects of the fossil, such as sediment overlying a specific part of the specimen (e.g., Figure 6A vs. 6B).
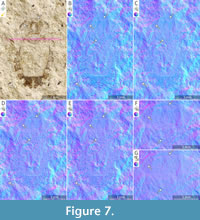 Classical Photometric Stereo requires a set of at least three images with different illumination directions. To test the potential increase in quality of the normal map that additional images might have, for one fossil we produced normal maps based on 3, 4, 8, and 16 images (Figure 7). The normal map produced from only three images contains areas with a high local colour contrast, which upon closer inspection seem to represent artefacts, likely related to the small number of different illumination settings (Figure 7B, bottom white arrow). Normal maps based on four or more images do not show such distinct artefacts. Yet, these normal maps appear to be not as sharp in some areas, when compared to the normal map based on three images. Normal maps produced from four, eight, and 16 images per MLIC show little difference in terms of sharpness and impact of artefacts.
A comparison of normal maps produced using a flatbed scanner and one produced using a macro-photographic setup (Figure 7B-F vs. 7G) revealed that such dedicated Multi Light Imaging setups - even when limited to a ring light configuration - can produce normal maps of much higher resolution, allowing to inspect much smaller details.
DISCUSSION
Flatbed Scanners for Imaging Fossils
In principle, CCD-type flatbed scanners can be used to document fossils equivalently to digital cameras. As flatbed scanners are optimized for their intended use of scanning documents, they are not as versatile as digital cameras with interchangeable lenses. This leads to limitations, which the potential user needs to be aware of. Compared to dedicated macrophotography lenses, which offer reproduction ratios close to or even greater than 1:1, in CCD-type flatbed scanners the image on the sensor is much smaller than the scanned subject it corresponds to, limiting the optical resolution that can be achieved with them (e.g., Simcoe, 2009). Despite not being as limited in depth of field as CIS-type flatbed scanners, CCD-type scanners are still rather limited in their ability to produce in-focus images of subjects with a high relief. This limits the range of fossils that can be scanned successfully to such that fit the scan area, have a rather flat relief and of which the features of interest are not minuscule in scale. Consequentially, for most small compression fossils, the limiting factor is the size of the smallest features that should be observable in the scan. For some of the herein presented fossils, it is apparent that the optical resolution of the scanner severely impacts distinctiveness of small-scale biological features (Figure 6G and Figure 7A).
Apart from the above-mentioned optical limitations, there are also properties of CCD-type flatbed scanners that make them convenient and useful imaging devices for palaeontologists. For many fossils, the image resolution provided by the scanner is indeed sufficient to capture the relevant morphological features, and many modern scanner models are capable of capturing images with a high colour depth. The illumination provided by CCD-type scanners originates either from an LED array or from a fluorescent tube lamp that spans the entire or almost the entire width of the scan area. A scanned line on the fossil is only lit by a narrow band of light passing through the slit of the carriage unit. This produces a very even, yet not diffuse lighting that can recover relief information by casting shadows. The azimuthal direction of illumination relative to the fossil can be conveniently adjusted by rotating the fossil on the scanner. The unique type of image distortion produced by CCD-type flatbed scanners (cylindrical projection; Schubert, 2000) - negligible for scanning documents - is usually not noticeable in scans of fossils in the absence of geometric shapes such as circles or rectangles.
The low cost and good availability, combined with their ease of use, are additional points in favour of using flatbed scanners to document fossils (Bybee and Branham, 2008). While the high-end models among the consumer grade CCD-type photo scanners can cost more than 1000 Euros, many scanner models that deliver comparable results are available at a much lower price, especially when considering the second-hand market. Often, such devices are already present in research institutions because they have been used to digitize negatives from analogue photography or handmade drawings. As all delicate parts are located inside the housing below a glass plate and a lid, flatbed scanners are also not prone to impairment by dust and can be stored fully assembled, making them quickly accessible when needed. Their use also does not require knowledge about their optical properties, which makes them easily usable without much training.
The Use of Cover Slips
Fossils, unlike many other materials, often have mineral particles that are hard and pointy enough to scratch the glass window of the scanner. Placing fossils on microscope cover slips is a simple way to avoid scratches (Figure 1A). If itself scratched, the cover slips can be discarded and replaced by intact ones. Additionally, cover slips can be used as sleds to translate or rotate specimens. The straight edges of the cover slip can, for example, be used to move a specimen along a straight ledge (e.g., a ruler). The shape of the cover slip can also be utilized in a turntable by designing the movable circular part with a window that tightly fits the cover slip (laser-cut turntable pattern available from the Appendix and the data repository).
However, the use of cover slips also comes with a few downsides. Being placed on a cover slip, the scanned subject is further away from the surface of the scanner. This is problematic, as scanners are designed to scan documents that directly rest on the window. Thus, using cover slips likely leads to a decrease in image quality, especially in scanner models not capable of adjusting the focus. Placing cover slips onto the scanner window also often leads to a peculiar interference pattern caused by reflections between the closely adjacent surfaces (“Newton’s rings”), apparent as concentric rings of rainbow colours (Figure 4B; Hooke, 1665). This effect can be prevented by enlarging the distance between scanner and cover slip - unfortunately, this moves the fossil further away from the focal plane of the scanner. Alternatively, special fluids can be inserted between the scanner and the cover slip, suppressing the effect by modifying the refractive indices (Osborne, 1958). Since Newton’s rings seem to have little effect on the perceptibility of the stereographic images and the quality of normal maps and can hardly be mistaken for fossil structures, their occurrence can be seen as an aesthetic issue like rainbow colours in cross polarisation photography.
Stereoscopic Imaging with Flatbed Scanners
Due to the optical elements present in CCD-type flatbed scanners, it is possible to change the viewing angle onto a fossil by translating it perpendicular to the scanning direction (Figure 2F), thereby creating a parallax effect, which can be used to create stereoscopic image pairs and sequences. Just as when recording stereoscopic imagery using regular cameras and lenses, it is critical to avoid any rotation when translating the fossil on the scanner surface, as even small rotations can lead to a severe decrease in quality of the stereogram, regardless of the mode of visualisation. To avoid rotation, a guidance ledge can be used, along which one can translate the specimen. This is particularly effective when the specimen is placed on a microscope cover slip (see discussion above). Using a physical ruler for guidance allows creating stereoscopic image series efficiently and with translation steps of known length. Such image series can be used to create animations where the fossil appears to be tilted (available from the Appendix and the data repository) or for autostereoscopic image displays utilizing lenticular lens arrays, which additionally allow for a motion parallax effect. The latter can be done in the form of lenticular prints (e.g., Schubert, 2002; Schubert and Bornowski, 2013) or digital autostereoscopic displays (Berkel et al., 1996).
When recording stereoscopic imagery, it is important to already have the desired final orientation of the visualisation in mind, because any rotation of the images prior to the horizontal alignment of free-view images pairs or the formation of anaglyphs, will result in a significant decrease in depth perception (zero perceivable depth at 90-degree rotation). While this is not limited to CCD-type flatbed scanners, for their use this causes an additional constraint. The illumination in a CCD-type flatbed scanner is directional and, its direction towards the scan area cannot be changed (fixed position of the lamp in the carriage unit). Therefore, scans designated for stereo anaglyphs or side-by-side pairs can only be illuminated either from the top or bottom side of the image, eliminating the possibility to comply with a top-left illumination standard in stereographic image pairs.
Another scanner-specific limitation of creating stereoscopic images is the maximum size of the subject. If the width of a fossil comes close to or even exceeds the width of the scanning area, there is little room to displace the fossil to either side without escaping the scan area, in which case one would have to decrease the desired field of view to achieve the desired amount of perceived depth. For larger fossils, this could be a limiting factor, especially when a distinctly exaggerated depth impression is desired.
Recording stereographic imagery with a CCD-type flatbed scanner is comparable to photographing a subject, which is translated between the captures while the camera remains its field of view or, vice versa, to translate a camera between the captures while the subject stays in place (Figure 2B, D-E). In this comparison, the optical elements and the CCD sensor array of the scanner equal a relatively wide-angle macro lens in combination with a large camera sensor. Translating either the camera or the subject requires a large field of view, which drastically limits the achievable optical magnification and resolution. Therefore, this approach is often avoided in macrophotography in favour of tilting either the camera or the photographed subject to create a parallax effect. This eliminates the need to choose the field of view larger than the region of interest and even allows using panoramic images, such as those created with modern digital microscopes (Figure 5A-B, D-E). However, depending on the magnification and the viewing angle, the tilting approach may require recording focus stacks even for flat subjects that would otherwise not require focus stacking (Figure 2A). Also, tilting results in a left-right compression of structures. If not corrected for, the left-right compression can have a negative impact on the perception of stereo anaglyphs and side-by-side image pairs (“binocular rivalry”; Blake, 1989). With increasing tilt angle, this artefact gains in impact (Figure 5A-B vs. 5D-E). Stereoscopic image pairs where the parallax is achieved through translation, such as those created with a CCD-type flatbed scanner show little binocular rivalry at similar perceived depth (Figure 5A-B, D-E vs. 5C, F). Furthermore, the lack of distortion along one of the axes in images produced by CCD-type flatbed scanners, aids a very precise alignment when creating stereo anaglyphs (Schubert, 2000).
It is possible to automate the process of recording stereoscopic image pairs and sequences with a flatbed scanner by introducing a motorized stage that translates the fossil. This level of automation can drastically speed up the creation of large stereoscopic image series with short translation steps between the scans (Schubert, 2000, 2002). So far, this has only been implemented with a reversed scanner orientation (scanner surface bottom facing), implementations with a regularly oriented scanner should also be possible.
Multi Light Imaging with Flatbed Scanners
Based on the fossils presented herein, we could show that the normal maps derived from CCD-type flatbed scanner imagery are of sufficient quality to show surface shape features that are not apparent from individual (macro-) photographic images. This especially holds true for fossils with little colour contrast (Figure 6C-D) or fossils where the colour does not strictly follow the shape of the fossilized organism (Figure 6A-B). This aspect could be even more relevant for casts or rubber peels that lack informative colour variation entirely.
While the classical Photometric Stereo approach requires a minimum number of three images of different illumination directions (Woodham, 1980), photographic setups for Multi Light Imaging often utilize many individually controllable light sources, to provide a better data basis for high quality normal maps or reflection models (e.g., Nam et al., 2016). For our flatbed scanner approach, we could see a drastic difference in quality between normal maps derived from three and those derived from four images, which show much less visually apparent inconsistencies (Figure 7B-C). However, when adding more images by decreasing the rotation steps between subsequent scans, there was no apparent increase in quality of the normal maps (Figure 7C-E). This could be explained by insufficiently well- aligned images making up the MLIC, which likely has a greater impact on the quality of the normal map than a restricted number of illumination conditions.
Since images retrieved from CCD-type flatbed scanners show a distinct distortion perpendicular to the scan direction (Schubert, 2000), it is not possible to achieve a perfect alignment by rotation and translation alone (“rigid alignment”) because of the parallax effect (stronger with higher relief). Our attempts to compensate for this effect by using an alignment algorithm that allows to locally deform the images (“elastic alignment”, developed for histological sections; Borovec et al., 2020) did not lead to an improved alignment. This is especially unfortunate because this, aside from the optical properties of the scanner, appears to be the most limiting factor of using CCD-type flatbed scanners for recovering normal maps through photometric stereo. Without properly compensating for the image distortion and the resulting parallax effect when performing the image alignment, recording four to six scans for each MLIC seems to be a reasonable compromise between the potential increase in quality and the increase in time and effort for additional scans. Without having a turntable at hand and for larger rock slabs, it is possible to lift and rotate the specimen manually by 90 degrees (visual estimation) and still retrieve reasonably good results (Figure 6E-F).
When using a sturdy photographic setup for recording Multi Light Image Collections, it is usually not needed to align the images at all, since the field of view stays constant between the captures. Together with the option to use dedicated macro lenses, it comes as no surprise that macro-photographic MLI approaches can recover much finer surface shape details than consumer-grade flatbed scanners (Figure 7F vs. 7G). Without the need to rotate the specimen, ring or dome light photographic setups allow to rapidly acquire large MLICs (Nam et al., 2016). Beyond that, it is possible to record focus-stacks of MLICs - ideally with a ring or dome light setup attached to the lens. The retrieved normal maps can then be merged to a single, in-focus normal map using standard focus-merging algorithms (Schädel et al., 2022; Schädel, 2023).
It is evident from the limitations discussed above that CCD-type flatbed scanners are not ideal tools to capture MLICs. Nevertheless, CCD-type flatbed scanners can provide a convenient and accessible alternative to macro photographic setups with dedicated lighting gear (expensive if not custom-built). Unlike when manually repositioning a light source (e.g., Kim et al., 2016), when using CCD-type scanners, one is not required to have reference spheres in the field of view of every recorded image. This is because the inclination angle of the scanner illumination is constant and when adhering to a standardized rotation routine (e.g., four images with 90-degree rotation in between), one can reuse previously estimated light directions (stored as light point files).
Visualisation Techniques for Multi Light Image Collection Data
As visual representations of fossils, normal maps fulfill two purposes. First, they can be used to store gathered information about the surface shape of the fossil and second, they can also be used as a form of visual data representation because they can be inspected visually with little familiarisation. Their inspection can be facilitated by including a reference object of known shape, such as a sphere (e.g., Pintus et al., 2019; Béthoux et al., 2021). While shape information derived from photometric stereo can be stored in the form of an image file, the inspection of surface features still requires the viewer to establish a certain level of intuition for normal maps. Therefore, depending on the situation and target audience, forms of representation closer to naturally occurring scenes might be more appropriate. The information contained in a normal map can be utilized to simulate different lighting conditions with or without using the original colour information. Discarding the colour information can be advantageous in a palaeontological context when colour does not reflect biologically relevant features and is perceived as obstructing or when sediment or fossils are particularly rich in brightness contrast (e.g., dark fossil on dark sediment with very bright patches). In palaeontology, this gave rise to various techniques of applying unicoloured pigments to fossils (“whitening”, often done using ammonium chloride), before recording images (Parsley et al., 2018). A similar appearance can be achieved through digital image processing, which is referred to as “digital whitening” (Hammer and Spocova, 2013).
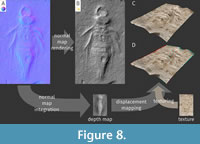 Derivatives of normal maps are not limited to mimicking whitened fossils. Various surface properties, such as its albedo, colour, and reflectiveness can be altered digitally for highlighting specific features of a subject’s surface (Figure 8B). Normal maps comprise information about the surface orientation at each point, with pixels as discrete spatial units. This provides indirect information about the depth/height at each pixel, allowing to derive depth/height maps from normal maps through “normal integration” (Quéau et al., 2018; Cao et al., 2021, 2022). Depth maps can then be used directly as a form of visual representation (e.g., Schädel et al., 2022) or to produce 3D mesh models through displacement mapping, which can be combined with colour information from the originally recorded images (“texturing”; Figure 8C-D). Reflectance Transformation Imaging (RTI) includes several techniques to model and modify surface features. Instead of relying on original colour images and normal maps, RTI creates reflectance models of surfaces - often in the form of polynomial texture maps (PTMs). These models hold additional information not present in normal maps, allowing to model and visualize effects like self-shadowing, inter-reflections, and subsurface scattering (light penetrating the subject’s surface) for creating photorealistic or feature enhanced (e.g., “virtual whitening”) digital representations (Malzbender et al., 2000, 2001; Hammer et al., 2002; Hammer and Spocova, 2013; for a conceptual classification see Pintus et al., 2019). It should be feasible to use RTI programs to process flatbed scanner MLICs. However, this was not attempted here in favour of the normal map derived techniques.
CONCLUSION
Modern consumer grade CCD-type flatbed scanners are versatile tools that can be used to capture fine surface details of compression fossils. Capturing surface details can be done either by translating the specimen perpendicular to the scanning direction, utilizing the stereoscopic effect caused by the scanner optics or by rotating the specimen, by which the one-sided illumination of the scanner can be used for a photometric stereo approach. Flatbed scanners are limited by the quality of their optical apparatus, when compared to dedicated macrophotography gear. Nevertheless, it is possible to produce high quality stereographs and normal maps of fossil specimens without modifying the scanner hardware and using standard scanner software. Being available in many research facilities as document scanning devices, flatbed scanners can provide an accessible entry point to advanced imaging techniques.
ACKNOWLEDGEMENTS
We thank O. Betz and J. Nebelsick (both University of Tübingen) for providing the first author access to their equipment and facilities. We thank I. Werneburg (University of Tübingen) and A. Krahl (formerly University of Tübingen) for providing access to fossil specimens of the university collection. The first author thanks M. Yavorskaya (University of Tübingen) for her support and help with the preparation of the manuscript and for the translation of the abstract.
SUPPLEMENTARY FILES
Unprocessed image files and other supplementary files are available from the Appendix and in identical form from the accompanying Zenodo repository (https://doi.org/10.5281/zenodo.10058701). For additional information on recording and processing Multi Light Image Collections, please visit https://github.com/mcranium/MLIC-tools.
REFERENCES
Beckemeyer, R.J. and Byers, G.W. 2001. Forewing morphology of Dunbaria fasciipennis Tillyard (Palaeodictyoptera: Spilapteridae), with notes on a specimen from the University of Kansas Natural History Museum. Journal of the Kansas Entomological Society, 74:221–230.
Béthoux, O., Norrad, R.E., Stimson, M.R., King, O.A., Allen, L.F., Deregnaucourt, I., Hinds, S.J., Lewis, J.H., and Schneider, J.W. 2021. A unique, large-sized stem Odonata (Insecta) found in the early Pennsylvanian of New Brunswick (Canada). Fossil Record, 24:207–221.
https://doi.org/10.5194/fr-24-207-2021
Blake, R. 1989. A neural theory of binocular rivalry. Psychological Review, 96:145–167.
https://doi.org/10.1037/0033-295X.96.1.145
Borovec, J., Kybic, J., Arganda-Carreras, I., Sorokin, D.V., Bueno, G., Khvostikov, A.V., Bakas, S., Chang, E.I.-C., Heldmann, S., Kartasalo, K., Latonen, L., Lotz, J., Noga, M., Pati, S., Punithakumar, K., Ruusuvuori, P., Skalski, A., Tahmasebi, N., Valkonen, M., Venet, L., Wang, Y., Weiss, N., Wodzinski, M., Xiang, Y., Xu, Y., Yan, Y., Yushkevic, P., Zhao, S., and Muñoz-Barrutia, A. 2020. ANHIR: Automatic non-rigid histological image registration challenge. IEEE Transactions on Medical Imaging, 39:3042–3052.
https://doi.org/10.1109/TMI.2020.2986331
Brecko, J. and Mathys, A. 2020. Handbook of best practice and standards for 2D+ and 3D imaging of natural history collections. European Journal of Taxonomy, 1–115.
https://doi.org/10.5852/ejt.2020.623
Buchmann, S.L. 2011. Moths on the flatbed scanner: The art of Joseph Scheer. Insects, 2:564–583.
https://doi.org/10.3390/insects2040564
Bybee, S.M. and Branham, M. A. 2008. Scanning rocks for data. American Entomologist, 54:214–217.
https://doi.org/10.1093/ae/54.4.214
Cao, X., Shi, B., Okura, F., and Matsushita, Y. 2021. Normal integration via inverse plane fitting with minimum point-to-plane distance, p. 2382–2391. 2021 IEEE/CVF Conference on Computer Vision and Pattern Recognition (CVPR), Nashville, TN, USA.
https://doi.org/10.1109/CVPR46437.2021.00241
Cao, X., Santo, H., Shi, B., Okura, F., and Matsushita, Y. 2022. Bilateral normal integration, p. 13661, 552–567. In Avidan, S., Brostow, G., Cissé, M., Farinella, G.M., and Hassner, T. (eds.), Computer Vision - ECCV 2022. Lecture Notes in Computer Science. Springer Nature Switzerland, Cham.
https://doi.org/10.1007/978-3-031-19769-7_32
Chen, L., Gu, J.-J., Yang, Q., Ren, D., Blanke, A., and Béthoux, O. 2021. Ovipositor and mouthparts in a fossil insect support a novel ecological role for early orthopterans in 300 million years old forests. (M. Zhu, P.J. Wittkopp, M. Zhu, and J. Haug, Eds.). eLife, 10:e71006.
https://doi.org/10.7554/eLife.71006
Clarkson, W., Weyrich, T., Finkelstein, A., Heninger, N., Halderman, J.A., and Felten, E.W. 2009. Fingerprinting blank paper using commodity scanners, p. 301–314. 30th IEEE Symposium on Security and Privacy, Oakland, CA, USA. https://doi.org/10.1109/SP.2009.7
Cosentino, A. 2013. Macro photography for reflectance transformation imaging: a practical guide to the highlights method. e-conservation Journal, 71–85.
https://doi.org/10.18236/econs1.201310
Cui, Y., Brauner, S., Schneider, J.W., and Béthoux, O. 2022. Grylloblattidan insects from Sperbersbach and Cabarz (Germany), two new early Permian and insect-rich localities. Journal of Paleontology, 96:355–374.
https://doi.org/10.1017/jpa.2021.101
Cui, Y., Toussaint, S., and Béthoux, O. 2018. The systematic position of the stonefly †culonga Sinitshenkova, 2011 (Plecoptera: Leuctrida) reassessed using Reflectance Transforming Imaging and cladistic analysis. Arthropod Systematics & Phylogeny, 76:173–178.
https://doi.org/10.3897/asp.76.e31925
Demers-Potvin, A., Szwedo, J., Paragnani, C., and Larsson, H. 2020. First North American occurrence of hairy cicadas discovered in a Late Cretaceous (Cenomanian) exposure from Labrador, Canada. Acta Palaeontologica Polonica, 65:85–98.
https://doi.org/10.4202/app.00669.2019
Demers‐Potvin, A.V., Larsson, H.C.E., Cournoyer, M., and Béthoux, O. 2021. Wing morphology of a new Cretaceous praying mantis solves the phylogenetic jigsaw of early‐diverging extant lineages. Systematic Entomology, 46:205–223.
https://doi.org/10.1111/syen.12457
Deregnaucourt, I., Wappler, T., Anderson, J.M., and Béthoux, O. 2021. The wing venation of the Protomyrmeleontidae (Insecta: Odonatoptera) reconsidered thanks to a new specimen from Molteno (Triassic; South Africa). Historical Biology, 33:306–312.
https://doi.org/10.1080/08912963.2019.1616291
Dubois, E. 2001. A projection method to generate anaglyph stereo images, p. 1661–1664. IEEE International Conference on Acoustics, Speech, and Signal Processing, Salt Lake City, UT, USA.
https://doi.org/10.1109/ICASSP.2001.941256
Dubois, E. 2009. Conversion of a stereo pair to anaglyph with the least-squares projection method. downloaded 27 August 2023.
https://www.site.uottawa.ca/~edubois/anaglyph/LeastSquaresHowToPhotoshop.pdf
Göröcs, Z. and Ozcan, A. 2014. Biomedical imaging and sensing using flatbed scanners. Lab Chip, 14:3248–3257.
https://doi.org/10.1039/C4LC00530A
Haas, F., Waloszek, D., and Hartenberger, R. 2003. Devonohexapodus bocksbergensis, a new marine hexapod from the Lower Devonian Hunsrück Slates, and the origin of Atelocerata and Hexapoda. Organisms Diversity & Evolution, 3:39–54.
https://doi.org/10.1078/1439-6092-00057
Hammer, Ø. 1999. Computer-aided study of growth patterns in tabulate corals, exemplified by Catenipora heintzi from Ringerike, Oslo Region. Norsk Geologisk Tidsskrift, 79:219–226.
Hammer, Ø., Bengtson, S., Malzbender, T., and Gelb, D. 2002. Imaging fossils using reflectance transformation and interactive manipulation of virtual light sources. Palaeontologia Electronica, 5.4:1–9.
https://palaeo-electronica.org/2001_1/past/issue1_01.htm
Hammer, Ø. and Spocova, J. 2013. Virtual whitening of fossils using polynomial texture mapping. Palaeontologia Electronica, 16.2.4T: 1–10.
https://doi.org/10.26879/384
Haug, J.T., Mayer, G., Haug, C., and Briggs, D.E.G. 2012. A Carboniferous non-onychophoran lobopodian reveals long-term survival of a Cambrian morphotype. Current Biology, 22:1673–1675.
https://doi.org/10.1016/j.cub.2012.06.066
Haug, C., Kutschera, V., Ahyong, S., Vega, F., Maas, A., Waloszek, D., and Haug, J. 2013. Re-evaluation of the Mesozoic mantis shrimp Ursquilla yehoachi based on new material and the virtual peel technique. Palaeontologia Electronica,16.2.5T:1–14.
https://doi.org/10.26879/340
Henkemeier, N., Jäger, K.R.K., and Sander, P.M. 2023. Redescription of soft tissue preservation in the holotype of Scaphognathus crassirostris (Goldfuß, 1831) using Reflectance Transformation Imaging. Palaeontologia Electronica, 26.2:a16.
https://doi.org/10.26879/1070
Hooke, R. 1665. Micrographia: or some physiological descriptions of minute bodies made by magnifying glasses. With observations and inquiries thereupon. J. Martyn and J. Allestry, London.
Hörnig, M.K., Sombke, A., Haug, C., Harzsch, S., and Haug, J. T. 2016. What nymphal morphology can tell us about parental investment - a group of cockroach hatchlings in Baltic amber documented by a multi-method approach. Palaeontologia Electronica, 19.1.6A:1–20.
https://doi.org/10.26879/571
Hughes-Hallett, M., Young, C., and Messier, P. 2021. A Review of RTI and an investigation into the applicability of micro-RTI as a tool for the documentation and conservation of modern and contemporary paintings. Journal of the American Institute for Conservation, 60:18–31.
https://doi.org/10.1080/01971360.2019.1700724
Ideses, I. and Yaroslavsky, L. 2005. Three methods that improve the visual quality of colour anaglyphs. Journal of Optics A: Pure and Applied Optics, 7:755–762.
https://doi.org/10.1088/1464-4258/7/12/008
Ikehata, S., Wipf, D., Matsushita, Y., and Aizawa, K. 2012. Robust photometric stereo using sparse regression, p. 318–325. IEEE Conference on Computer Vision and Pattern Recognition, Providence, RI, USA.
https://doi.org/10.1109/CVPR.2012.6247691
Ikehata, S., Wipf, D., Matsushita, Y., and Aizawa, K. 2014. Photometric stereo using sparse Bayesian regression for general diffuse surfaces. IEEE Transactions on Pattern Analysis and Machine Intelligence, 36:1816–1831.
https://doi.org/10.1109/TPAMI.2014.2299798
Kenchington, C.G., Harris, S.J., Vixseboxse, P.B., Pickup, C., and Wilby, P.R. 2018. The Ediacaran fossils of Charnwood Forest: Shining new light on a major biological revolution. Proceedings of the Geologists’ Association, 129:264–277.
https://doi.org/10.1016/j.pgeola.2018.02.006
Kim, Y.H., Choi, J., Lee, Y.Y., Ahmed, B., and Lee, K.H. 2016. Reflectance Transformation Imaging method for large-scale objects, p. 84–87. 13th International Conference on Computer Graphics, Imaging and Visualization (CGiV), Beni Mellal, Morocco.
https://doi.org/10.1109/CGiV.2016.25
Kinsman, T. 2016. An easy to build Reflectance Transformation Imaging (RTI) system. Journal of Biocommunication, 40:10–14.
https://doi.org/10.5210/jbc.v40i1.6625
Klette, R. 2014. Concise Computer Vision: An introduction into theory and algorithms. Undergraduate topics in computer science. Springer London, London.
https://doi.org/10.1007/978-1-4471-6320-6
Krupev, A.A. and Popova, A.A. 2008. Ghosting reduction and estimation in anaglyph stereoscopic images, p. 375–379. IEEE International Symposium on Signal Processing and Information Technology (ISSPIT), Sarajevo, Bosnia and Herzegovina.
https://doi.org/10.1109/ISSPIT.2008.4775719
Krupev, A.A. and Popova, A.A. 2009. Fast anaglyph retinal rivalry reduction algorithm, p. 209–212. ICEST 2009, Veliko Tarnovo, Bulgaria.
Li, T. and Ren, D. 2009. A new fossil genus of Mesosciophilidae (Diptera, Nematocera) with two new species from the Middle Jurassic of Inner Mongolia, China. Progress in Natural Science, 19:1837–1841.
https://doi.org/10.1016/j.pnsc.2009.06.011
Liu, Y. and Ren, D. 2008. Two new Jurassic stoneflies (Insecta: Plecoptera) from Daohugou, Inner Mongolia, China. Progress in Natural Science, 18:1039–1042.
https://doi.org/10.1016/j.pnsc.2008.03.014
Lowe, D.G. 2004. Distinctive image features from scale-invariant keypoints. International Journal of Computer Vision, 60:91–110.
https://doi.org/10.1023/B:VISI.0000029664.99615.94
MacDonald, L.W. 2011. Visualising an Egyptian artefact in 3D: Comparing RTI with laser scanning, p. 155–162. Electronic Visualisation and the Arts (EVA 2011), London, UK.
Malzbender, T., Gelb, D., Wolters, H., and Zuckerman, B. 2000. Enhancement of shape perception by surface reflectance transformation. Hewlett-Packard Technical Report HPL-2000-38:183.
Malzbender, T., Gelb, D., and Wolters, H. 2001. Polynomial texture maps, p. 519–528. Proceedings of the 28th annual conference on Computer graphics and interactive techniques.
McKay, H.C. 1951. Three-dimensional photography principles of stereoscopy. American Photography Book Department, Minneapolis, Minnesota.
https://archive.org/details/threedimensional010611mbp
Nam, G., Lee, J.H., Wu, H., Gutierrez, D., and Kim, M.H. 2016. Simultaneous acquisition of microscale reflectance and normals. ACM Transactions on Graphics, 35:1–11.
https://doi.org/10.1145/2980179.2980220
Ng, T.W. and Tajuddin, A. 2001. Measuring the illumination angle of a flatbed scanner. Optical Engineering, 40:415–417.
https://doi.org/10.1117/1.1347030
Osborne, C.E. 1958. A means of preventing the formation of newton’s rings during contact printing of motion-picture film. Journal of the SMPTE, 67:169–171.
https://doi.org/10.5594/J11178
Pan, R. and Skala, V. 2013. Normal map acquisition of nearly flat objects using a flatbed scanner, p. 68–73. International Conference on Virtual Reality and Visualization (ICVRV), IEEE, Xi’an, China.
https://doi.org/10.1109/ICVRV.2013.19
Park, T.-Y.S., Kim, D.-Y., Nam, G.-S., and Lee, M. 2022. A new titanopteran Magnatitan jongheoni n. gen. n. sp. from southwestern Korean Peninsula. Journal of Paleontology, 96:1111–1118.
https://doi.org/10.1017/jpa.2022.30
Parsley, R.L., Lawson, M.H. and Pojeta Jr., J. 2018. A practical and historical perspective of the how and why of whitening fossil specimens and casts as a precurser to their photography. Fossil Imprint, 74: 237–244.
https://doi.org/10.2478/if-2018-0016
Pascual-Cebrian, E., Hennhöfer, D.K., and Götz, S. 2013. High resolution and true colour grinding tomography of rudist bivalves, exemplified with the taxonomic revision of Mathesia darderi (Astre). Carribean Journal of Earth Science, 45:35–46.
Pintus, R., Dulecha, T., Ciortan, I., Gobbetti, E., and Giachetti, A. 2019. State‐of‐the‐art in Multi‐Light Image Collections for surface visualization and analysis. Computer Graphics Forum, 38:909–934.
https://doi.org/10.1111/cgf.13732
Ponchio, F., Corsini, M., and Scopigno, R. 2019. RELIGHT: A compact and accurate RTI representation for the web. Graphical Models, 105:101040.
https://doi.org/10.1016/j.gmod.2019.101040
Porter, S.T., Huber, N., Hoyer, C., and Floss, H. 2016. Portable and low-cost solutions to the imaging of Paleolithic art objects: A comparison of photogrammetry and reflectance transformation imaging. Journal of Archaeological Science: Reports, 10:859–863.
https://doi.org/10.1016/j.jasrep.2016.07.013
Prados, E., Chen, Y., and Faugeras, O. 2006. Shape From Shading, p. 375–388. Handbook of Mathematical Models in Computer Vision. Springer.
Purnell, M.A. 2003. Casting, replication, and anaglyph stereo imaging of microscopic detail in fossils, with examples from conodonts and other jawless vertebrates. Palaeontologia Electronica, 6.2:1–11.
https://palaeo-electronica.org/2003_2/rubber/issue2_03.htm
Rollmann, W. 1853. Zwei neue stereoskopische Methoden. Annalen der Physik, 90:186–187.
Quéau, Y., Durou, J., and Aujol, J. 2018. Normal Integration: A survey. Journal of Mathematical Imaging and Vision, 60:576–593.
https://doi.org/10.1007/s10851-017-0773-x
Salvador, R.B., Höltke, O., Valentas-Romera, B.L., and Rasser, M.W. 2022. Fossil molluscs from the Middle Miocene of Öhningen, southwestern Germany. Folia Malacologica, 30:80–92.
https://doi.org/10.12657/folmal.030.010
Schädel, M. 2023. Multi light imaging of small compression fossils - proper tools and a neat shortcut. The Palaeontological Association 67th Annual Meeting (PalAss 2023), Cambridge, UK.
https://doi.org/10.5281/zenodo.8381473
Schädel, M., Yavorskaya, M., and Beutel, R.G. 2022. The earliest beetle †Coleopsis archaica (Insecta: Coleoptera) - morphological re-evaluation using Reflectance Transformation Imaging (RTI) and phylogenetic assessment. Arthropod Systematics & Phylogeny, 80:495–510.
https://doi.org/10.3897/asp.80.e86582
Schindelin, J., Arganda-Carreras, I., Frise, E., Kaynig, V., Longair, M., Pietzsch, T., Preibisch, S., Rueden, C., Saalfeld, S., Schmid, B., Tinevez, J.-Y., White, D.J., Hartenstein, V., Eliceiri, K., Tomancak, P., and Cardona, A. 2012. Fiji: an open-source platform for biological-image analysis. Nature Methods, 9:676–682.
https://doi.org/10.1038/nmeth.2019
Schratt, A. and Riedl, A. 2005. The potential of three-dimensional display technologies for the visualization of geo-virtual environments, p. 1–10. Proceedings of the 22th ICA Cartographic Conference. A Coruña, Spain.
Schubert, R. 2000. Using a flatbed scanner as a stereoscopic near-field camera. IEEE Computer Graphics and Applications, 20:38–45.
https://doi.org/10.1109/38.824535
Schubert, R. 2002. Routinemäßige Herstellung von Vorlagen für 3D-Multiview-Bilder (Producing 3D-Multiview Pictures on a Routine Basis). 3D-NordOst, Berlin.
http://berlin-3d-art.de/tmp/3DNO02_corr_kopfb_corr_crop.pdf
Schubert, R. and Bornowski, C. 2013. Neuartige emotional besetzte 3-D-Bildmotive - Nutzungsmöglichkeiten von emotionaler Konnotierung zur projektiven Diagnostik. Psychologische Medizin, 24:33–40.
Seiko Epson Corporation 2005. EPSON Perfection V700 Photo. Service Manual, Seiko Epson Corporation, Tokyo, downloaded 23 January 2023.
Simcoe, R.J. 2009. Evaluating commercial scanners for astronomical image digitization, p. 410. In Osborn, W. and Robbins, L. (eds.), Preserving astronomy’s photographic legacy. ASP Conference Series.
Skala, V., Pan, R., and Nedved, O. 2014. Making 3D replicas using a flatbed scanner and a 3D printer, p. 76–86. In Murgante, B., Misra, S., Rocha, A.M.A.C., Torre, C., Rocha, J.G., Falcão, M.I., Taniar, D., Apduhan, B.O., and Gervasi, O. (eds.), Computational Science and Its Applications - ICCSA 2014. Lecture Notes in Computer Science. Springer International Publishing, Cham.
https://doi.org/10.1007/978-3-319-09153-2_6
Song, Y., Zou, R., Castaneda, D.I., Riding, K.A., and Lange, D.A. 2017. Advances in measuring air-void parameters in hardened concrete using a flatbed scanner. Journal of Testing and Evaluation 45:20150424.
https://doi.org/10.1520/JTE20150424
Staniczek, A. 2002. First fossil record of the mayfly family Baetiscidae from Baltic amber (Insecta: Ephemeroptera). Stuttgarter Beiträge zur Naturkunde, Serie B, 322:1–11.
Sturm, R. 2020. Stereoscopic imaging of diatoms in light and electron microscopy, p. 183–196. In Cristóbal, G., Blanco, S., and Bueno, G. (eds.), Modern trends in diatom identification. Springer International Publishing, Cham.
https://doi.org/10.1007/978-3-030-39212-3_11
Tao, J., Gong, H., Wang, F., Luo, X., Qiu, X., and Huang, Y. 2021. Automated image segmentation of air voids in hardened concrete surface using photometric stereo method. International Journal of Pavement Engineering, 1–18.
https://doi.org/10.1080/10298436.2021.2001811
Toeppen, J. and Sykes, D. 2009. Digital Stereoscopic Photography using StereoData Maker. In Woods, A.J., Holliman, N.S., and Merrit, J.O. (eds.), Stereoscopic displays and applications. Proceedings of SPIE-IS&T Electronic Imaging, 7237C:1–10.
https://doi.org/10.1117/12.807422
Turnnidge, R. and Pizzanelli, D. 1997. Methods of pre-visualizing temporal parallax suitable for making multiplex holograms part ii: greyscale and colour anaglyphs made in PhotoshopTM. The Imaging Science Journal, 45:43–44.
https://doi.org/10.1080/13682199.1997.11736370
Van Berkel, C., Parker, D.W., and Franklin, A.R. 1996. Multiview 3D-LCD. Stereoscopic Displays and Virtual Reality Systems III, SPIE, 2653:32–39.
https://doi.org/10.1117/12.237437
Vasco, A., Thadeo, M., Conover, M., and Daly, D.C. 2014. Preparation of samples for leaf architecture studies, a method for mounting cleared leaves. Applications in Plant Sciences, 2:1400038.
https://doi.org/10.3732/apps.1400038
Vogt, F. and Wagner, A.Y. 2012. Stereo pairs in astrophysics. Astrophysics and Space Science, 337:79–92.
https://doi.org/10.1007/s10509-011-0801-z
Wainman, B., Pukas, G., Wolak, L., Mohanraj, S., Lamb, J., and Norman, G.R. 2020. The critical role of stereopsis in virtual and mixed reality learning environments. Anatomical Sciences Education, 13:401–412.
https://doi.org/10.1002/ase.1928
Wang, W.-L. 2000. Long depth of focus contact image sensor (LF-CIS) module for compact and light weight flatbed type scanning system. United States Patent 6111244.
Wheatstone, C. 1838. On some remarkable, and hitherto unobserved, phenomena of binocular vision. Philosophical Transactions of the Royal Society of London, 128:371–394.
Woodham, R.J. 1980. Photometric method for determining surface orientation from multiple images. Optical Engineering, 19:139–144.
Woods, A.J. and Rourke, T. 2004. Ghosting in anaglyphic stereoscopic images, p. 354–365. In Woods, A.J., Merritt, J.O., Benton, S.A., and Bolas, M.T. (eds.), Electronic Imaging, San Jose, CA.
https://doi.org/10.1117/12.537424
Woods, A.J. and Harris, C.R. 2010. Comparing levels of crosstalk with red/cyan, blue/yellow, and green/magenta anaglyph 3D glasses, p. 0Q1-0Q12. In Woods, A.J., Holliman, N.S., and Dodgson, N.A. (eds.), Proceedings of SPIE Stereoscopic Displays and Applications, XXI:7253.
https://doi.org/10.1117/12.840835
Wu, L., Ganesh, A., Shi, B., Matsushita, Y., Wang, Y., and Ma, Y. 2010. Robust photometric stereo via low-rank matrix completion and recovery, p. 703–717. In Kimmel, R., Klette, R., and Sugimoto, A. (eds.), Computer Vision - ACCV 2010. Lecture Notes in Computer Science. Springer, Berlin, Heidelberg.
https://doi.org/10.1007/978-3-642-19318-7_55
Zessin, W. 2010. Der Dobbertiner Jura (Lias ε, Mecklenburg) und seine Bedeutung für die Paläoentomologie. Virgo, 13:4–9.
